Healthcare, Utilities, and Tech lead as market confronts resistance
 Stocks continue to consolidate just under their prior high, which is offering formidable resistance. Although many long-standing uncertainties have significantly subsided, others have arisen, including turmoil in a new global hot spot (Ukraine) and the disruptions to the economy caused by the unusually long and brutal winter experienced by most of the U.S. “Polar vortex” is a term most have us had never heard before, but now it is firmly ensconced in the daily lexicon around water coolers everywhere.
Nevertheless, the U.S. economy appears to be poised for stronger growth once the ice clears. But in the short term, the U.S. stock market remains at the proverbial “crossroads” that I discussed last week, which likely will culminate in either a bullish breakout or a bearish reversal. A failure to move higher from here would result in an ominous triple-top sell signal.
Among the ten U.S. business sectors, Utilities and Healthcare are still far-and-away the top performers so far in 2014. Both are up more than +6% year-to-date through Friday’s close. All-weather sector Healthcare got off to a blistering start in January, while defensive sector Utilities has been steadily rising without weakness, including during the extreme market weakness in late January. Technology is the only other sector that is solidly positive, up about +2% YTD. The S&P 500 is still slightly negative YTD, while the other seven sectors are all tightly bunched at or below the broad index. Notably, if you go back one more month to the end of November, Technology is the top-performing sector due to its strong December during the “risk-on” year-end rally.
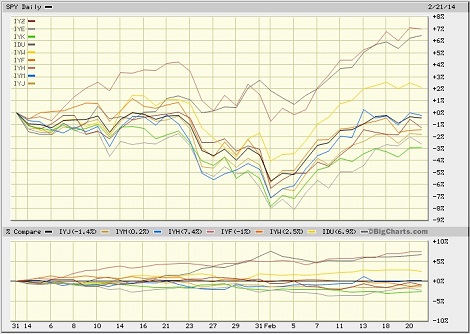
Basic Materials have performed pretty well this month. But take a look at pure commodity indexes like the Greenhaven Continuous Commodity Index ETF (GCC). It has been going straight up for the past month. Also, the PowerShares DB Commodity Index Tracking ETF (DBC) has performed well.
SPY chart review:
The SPDR S&P 500 Trust (SPY) closed Friday at 183.89, which is well above its 20-day and 50-day simple moving averages, but it is battling with strong resistance at the 185 level. It remains at the proverbial “crossroads” (at which it arrived last week) that should culminate in either a bullish breakout or a bearish reversal. Also, the Russell 2000 small cap index is still struggling with its former long-standing uptrend line as overhead resistance. Oscillators RSI, MACD, and Slow Stochastic are not giving any clues, as they are simply consolidating a bit and could go either way from here. If SPY can’t break through resistance at 185 and sellers take over, it would create a triple-top sell signal that could send price back down to test support levels at 180, the 100-day SMA near 179, 177.50, 175, and possibly the 200-day near 172.
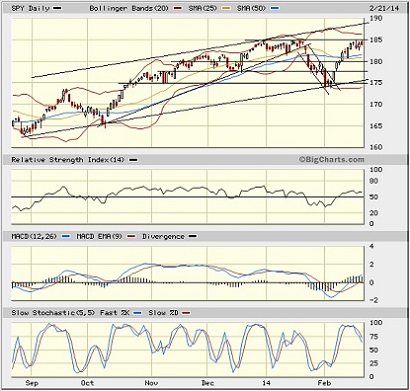
The CBOE Market Volatility Index (VIX), a.k.a. “fear gauge,” closed Friday at 14.68, after briefly moving back up above 15. However, it is still way down from the 21+ levels it hit during the extreme market turbulence in early February. Most market commentators are warning of increased volatility this year, assuming the Fed continues to unwind its quant easing.
Latest sector rankings:
Relative sector rankings are based on Sabrient’s proprietary SectorCast model, which builds a composite profile of each equity ETF based on bottom-up aggregate scoring of the constituent stocks. The “Outlook Score” employs a forward-looking, fundamentals-based multifactor algorithm considering forward valuation, historical and projected earnings growth, the dynamics of Wall Street analysts’ consensus earnings estimates and recent revisions (up or down), quality and sustainability of reported earnings (forensic accounting score), and various return ratios. It helps us predict relative performance over the next 1-3 months.
In addition, SectorCast computes Sabrient's Bull Score and Bear Score for each ETF based on recent price behavior of the constituent stocks on particularly strong and weak market days. High Bull score indicates that stocks within the ETF have tended recently toward relative outperformance when the market is strong, while a high Bear score indicates that stocks within the ETF have tended to hold up relatively well (“safe havens”) when the market is weak.
Outlook Score is forward-looking while Bull and Bear are backward-looking. As a group, these three scores can be helpful for positioning a portfolio for a given set of anticipated market conditions. Of course, each ETF holds a unique portfolio of stocks and position weights, so the sectors represented will score differently depending upon which set of ETFs is used. For Sector Detector, I use the iShares that represent the ten major U.S. business sectors: Financial, Technology, Industrial, Healthcare, Consumer Goods, Consumer Services, Energy, Basic Materials, Telecom, and Utilities. Whereas the Select Sector SPDRs only contain stocks from the S&P 500, I prefer the iShares for their larger universe and broader diversity. Fidelity also offers a group of sector ETFs with an even larger number of constituents in each.
Here are some of my observations on this week’s scores:
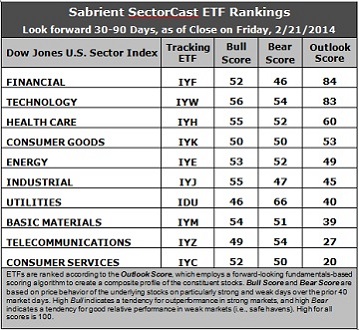
1. Financial (IYF) has moved back into the top spot with an Outlook score of 84, with Technology (IYW) close behind at 83. These two essentially remain in lockstep at the top of the rankings. The Financial sector displays one of the lowest (best) forward P/Es and strong sentiment among both sell-side analysts (net positive revisions to forward earnings estimates) and company insiders (buying activity). Technology has consistently displayed solid factor scores across the board, with a strong forward long-term growth rate, a relatively low forward P/E, the highest return ratios, and excellent sentiment among Wall Street’s sell-side analysts, along with notably improving sentiment among company insiders. In third place again this week is Healthcare (IYH), followed by Consumer Goods (IYK) and Energy (IYE). Energy has risen in the rankings as stocks within the sector benefited from a notable improvement in sentiment among both sell-side analysts and insiders.
2. Consumer Services (IYC) remains in the cellar with an Outlook score of 20, as Telecommunications (IYZ) scores a 27 to widen its distance above the bottom. Consumer Services, a.k.a., consumer cyclicals or consumer discretionary, continues to boast the best forward long-term growth rate, but this is more than offset by a relatively high forward P/E and a continued weakening in sentiment among both Wall Street analysts (net negative revisions to earnings estimates) and company insiders (low buying activity). Telecom continues to score among the lowest on most of the factors in the model, including the highest (worst) forward P/E, lowest return ratios, and a low projected long-term growth rate. The one bright spot is the slight improvement in sentiment among sell-side analysts and insiders.
3. These fundamentals-based rankings still reflect a mostly bullish bias, with economically-sensitive sectors Tech and Financial at the top. However, it would be more bullish to see higher scores in Industrial, Consumer Services, and Basic Materials.
4. Looking at the Bull scores, Technology remains the leader on strong market days, scoring 56, while Utilities (IDU) is the laggard with a score of 46. The top-bottom spread has fallen to 10 points, reflecting somewhat elevated sector correlations on particularly strong market days. It is generally preferably in a healthy market to see the top-bottom spread approach 20 points, but the past two weeks have produced a narrowing, perhaps due to the dovish comments from the new Fed chairwoman, leading to “a rising tide lifting all boats” mentality from ongoing quant easing.
5. Looking at the Bear scores, Utilities scores a 66, indicating that it has been holding up the best (“safe haven”) on recent weak market days. Financial scores the lowest with a 46. The top-bottom spread remains at 20 points, reflecting low sector correlations on weak market days, which is a good sign for a healthy market.
6. Overall, Technology displays the best all-weather combination of Outlook/Bull/Bear scores, while Consumer Services is the worst. Looking at just the Bull/Bear combination, Utilities holds the lead, indicating excellent relative performance in extreme market conditions (whether bullish or bearish), and Technology is a close second, followed by Healthcare. As it so happens, these are the three top performing sectors year-to-date. Financial scores the lowest, indicating investor avoidance (relatively speaking) during extreme conditions.
These Outlook scores represent the view once again that Financial and Technology sectors are relatively undervalued, while Consumer Services and Telecom may be relatively overvalued based on our 1-3 month forward look.
Stock and ETF Ideas:
Our Sector Rotation Model, which appropriately weights Outlook, Bull, and Bear scores in accordance with the overall market’s prevailing trend (bullish, neutral, or bearish), suggests holding Technology (IYW), Healthcare (IYH), and Financial (IYF) in the current bullish climate. (The market climate remains bullish with the SPY above its 50 and 200-day simple moving averages.) Also, Fidelity offers its own line of U.S. sector ETFs, including Fidelity MSCI Financials Index ETF (FNCL), Fidelity MSCI Information Technology Index ETF (FTEC), and Fidelity MSCI Health Care Index ETF (FHLC).
Other ETFs highly-ranked by Sabrient from the Financial, Technology, and Healthcare sectors include iShares Mortgage Real Estate Capped ETF (REM), which is yielding 15%, PowerShares Dynamic Semiconductors Portfolio (PSI), and PowerShares Dynamic Pharmaceuticals Portfolio (PJP).
For an “enhanced” sector portfolio that employs top-ranked stocks (or options) from within the top-ranked sectors (instead of ETFs), some long ideas from Financial, Technology, and Healthcare sectors include Discover Financial Services (DFS), BancorpSouth (BXS), Shanda Games Ltd (GAME), NetScout Systems (NTCT), DepoMed (DEPO), and Cytokinetics (CYTK), all of which are ranked highly in the Sabrient Ratings Algorithm and score near the top of the Sabrient/Gradient Earnings Quality Rank (EQR), which is a pure accounting-based risk assessment signal based on the forensic accounting expertise of Sabrient subsidiary Gradient Analytics.
Disclosure: Author has no positions in stocks or ETFs mentioned.
Disclaimer: This newsletter is published solely for informational purposes and is not to be construed as advice or a recommendation to specific individuals. Individuals should take into account their personal financial circumstances in acting on any rankings or stock selections provided by Sabrient. Sabrient makes no representations that the techniques used in its rankings or selections will result in or guarantee profits in trading. Trading involves risk, including possible loss of principal and other losses, and past performance is no indication of future results.