Sector Detector: Fed tries to refill bulls’ fuel tank as cyclicals lead
 The market went through some gyrations on Wednesday in reaction to Fed Chairman Bernanke’s testimony before the Joint Economic Committee. He first defended continued quant easing by warning, “A premature tightening of monetary policy could lead interest rates to rise temporarily but also would carry a substantial risk of slowing or ending the economic recovery.” Stocks dutifully rallied and all major indexes hit new intraday highs.
But alas, consensus is apparently not a given over the longer term. The minutes hinted that a tapering off could start sooner, “A number of participants expressed willingness to adjust the flow of purchases downward as early as the June meeting if the economic information received by that time showed evidence of sufficiently strong and sustained growth.” So … the indexes turned tail and sold off by the close to give back the last few days’ gains. Still, the Fed is clearly prepared to keep the liquidity flowing as long as necessary, which should be giving the market sufficient confidence to continue its uptrend.
Furthermore, with Japan aggressively devaluing the yen, the ECB is likely to take more aggressive action with the euro. As Scott Minerd of Guggenheim Partners has opined in his weekly commentary, it would serve the primary purpose of propping up the EU peripheral economies while avoiding criticism from the core economies of Germany and France by helping them to boost exports.
With this global currency war approaching full participation, the major economies of the world are seeking to devalue themselves into prosperity. So far, it seems like an effective plan. In fact, Goldman Sachs (GS) revised its year-end target for the S&P 500 from 1,575 to 1,750 while anticipating increasing dividends from the S&P 500.
That will require greater leadership from the cyclicals, and indeed sector rotation (or broadening) continues. Over the past month, the new sector leaders have been Technology, Energy, Materials, Financial, and Industrial, which gives further evidence of the broadening we are seeing from new capital entering the market.
We already knew that the outperformance of defensive sectors like Healthcare, Consumer Staples and Utilities, primarily due to investor comfort with their inelasticity of product demand and dividend yields, wouldn’t be sufficient to power the markets forever, particularly as their valuations surged. No, a continuation of the rally will have to be led by economically-sensitive sectors and investors who are betting on economic growth. Note that Hewlett-Packard (HPQ) tried to do its part afterhours on Wednesday with a better-than-expected earnings report and improved forward guidance.
Many market observers have been concerned about the unrelenting persistence of the uptrend, noting that a healthy market has ups and downs, severe tests of bullish conviction, and momentum-riding in both directions. They fear we are headed for a devastating market correction that could threaten the recovery by destroying the “wealth effect” on which it has been based. They believe the rally has been artificially manufactured by our central bankers, which inevitably makes it doomed to fail. In addition, equity correlations remain far too high.
However, keep in mind that the rally began on the heels of what many feared was global financial Armageddon followed by massive default of European debt and the collapse of the euro. Stock valuations are simply recovering to where they might have been anyway had it not been for the dire global crises and bunker mentality of investors. Plus, we enjoy the added fuel sources of yield-hungry bond refugees, storehouses of cash in corporate coffers for buybacks and acquisitions, and lots of cheap freshly-printed dollars in circulation, which isn’t going to be removed by our friendly central bankers without plenty of advance warning and lots of solid economic data to maintain both business and investor confidence moving forward.
But once the easy money flow does start tapering off, the good news for investors is that the ultra-high equity correlations should recede and stock-picking will be back in vogue. Companies with solid business models and strong earnings quality should prosper while the coattail riders get exposed as the impostors they are.
Looking at the chart of the SPY, it closed Wednesday slightly below 166 and just about where it closed the prior Wednesday. After breaking out last week above the upper line of the bullish rising channel that has been in place since November, Wednesday’s closing selloff left the SPY testing new support at the top of the rising channel. Oscillators RSI, MACD, and Slow Stochastic are all pointing down from severely overbought territory, and price seems to be on track for a reversion to the mean. Price is likely to pull back into the channel for some further technical consolidation before we see a concerted breakout.
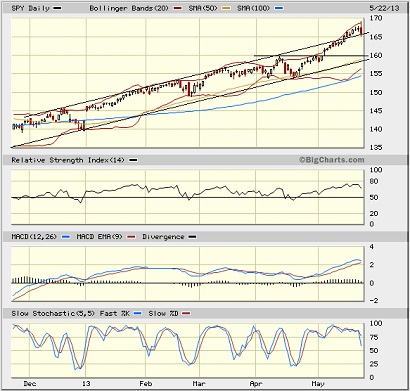
The CBOE Market Volatility Index (VIX), a.k.a. “fear gauge,” closed Wednesday at 13.82, which remains quite low and supports bullish conviction.
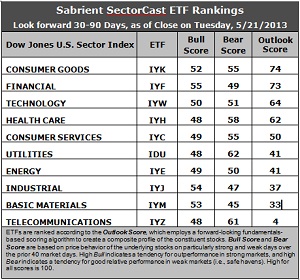
Latest rankings: The table ranks each of the ten U.S. business sector iShares ETFs by Sabrient's proprietary Outlook Score, which employs a forward-looking, fundamentals-based, quantitative algorithm to create a bottom-up composite profile of the constituent stocks within the ETF. The multi-factor model considers forward valuation, historical earnings trends, earnings growth prospects, the dynamics of Wall Street analysts' consensus estimates, accounting practices and earnings quality, and various return ratios. In addition, the table also shows Sabrient's proprietary Bull Score and Bear Score for each ETF.
High Bull score indicates that stocks within the ETF have tended recently toward relative outperformance during particularly strong market periods, while a high Bear score indicates that stocks within the ETF have tended to hold up relatively well during particularly weak market periods. Bull and Bear are backward-looking indicators of recent sentiment trend.
As a group, these three scores can be quite helpful for positioning a portfolio for a given set of anticipated market conditions.
Observations:
1. Consumer Goods (IYK) and Financial (IYF) retain the top spot with Outlook scores of 74 and 73 this week. Stocks within IYK continue to enjoy the most support from insiders and Wall Street an analysts (i.e., net upgrades in forward earnings estimates) and strong return ratios. However, those net upgrades diminished somewhat this week, and valuations (P/Es) are getting high. IYF displays strong sentiment among insiders and Wall Street analysts, as well as a low forward P/E.
2. Telecom (IYZ) stays in the cellar with an Outlook score of 4. It is weak in forward P/E, long-term projected growth, and return ratios. It is joined in the bottom two again this week by Basic Materials (IYM). However, the analysts haven’t been quite as negative lately, and its Outlook score has improved from 28 to 33.
3. This week’s fundamentals-based rankings appear to have improved slightly to a less defensive tone, as Consumer Services (IYC) has cracked the top five ahead of Utilities (IDU).
4. Looking at the Bull scores, IYF has been the leader on particularly strong market days, scoring 55, followed closely by Industrial (IYJ) and Materials (IYM), while defensive sectors IYZ, IYH, and IDU have been the laggards on strong market days, scoring 48. This is “normal” market behavior and further evidence of the rotation into traditional leaders of market rallies. The narrow top-bottom spread of 7 points continues to indicate high sector correlation on strongly bullish days.
5. Looking at the Bear scores, Utilities (IDU) is still serving as the favorite “safe haven” on weak market days, scoring 62, followed closely by IYZ at 61, while Materials (IYM) is the worst during extreme market weakness as reflected in its low Bear score of 45. The top-bottom spread is 17 points, which continues to indicate lower correlations on weak market days, i.e., it pays to be in the “safer” sectors when the market is bearish.
6. Overall, Consumer Goods (IYK) still shows the best all-weather combination of Outlook/Bull/Bear scores. Adding up the three scores gives a total of 181. Telecom (IYM) is the worst at 113. Looking at just the Bull/Bear combination, Utilities (IDU) displays an impressive total score of 110 once again, followed closely by Telecom (IYZ). Materials (IYM) and Energy (IYE) display the lowest combined scores of 98 and 99, respectively. This indicates that Utilities stocks have performed the best overall during extreme market conditions (whether bullish or bearish) while Materials stocks have tended to fair the worst (although things are improving on the bullish side).
These Outlook scores represent the view that Consumer Goods and Financial sectors may be relatively undervalued, while Telecom and Basic Materials sectors may be relatively overvalued based on our 1-3 month forward look.
Some top-ranked stocks within IYK and IYF include Middleby Corp (MIDD), Bunge Ltd (BG), Markel Corp (MKL), and Portfolio Recovery Associates (PRAA).
Disclosure: Author has no positions in stocks or ETFs mentioned.
About SectorCast: Rankings are based on Sabrient’s SectorCast model, which builds a composite profile of each equity ETF based on bottom-up aggregate scoring of the constituent stocks. The Outlook Score employs a fundamentals-based multi-factor approach considering forward valuation, earnings growth prospects, Wall Street analysts’ consensus revisions, accounting practices, and various return ratios. It has tested to be highly predictive for identifying the best (most undervalued) and worst (most overvalued) sectors, with a 1-3 month forward look.
Bull Score and Bear Score are based on the price behavior of the underlying stocks on particularly strong and weak days during the prior 40 market days. They reflect investor sentiment toward the stocks (on a relative basis) as either aggressive plays or safe havens. So, a high Bull score indicates that stocks within the ETF have tended recently toward relative outperformance during particularly strong market periods, while a high Bear score indicates that stocks within the ETF have tended to hold up relatively well during particularly weak market periods.
Thus, ETFs with high Bull scores generally perform better when the market is hot, ETFs with high Bear scores generally perform better when the market is weak, and ETFs with high Outlook scores generally perform well over time in various market conditions.
Of course, each ETF has a unique set of constituent stocks, so the sectors represented will score differently depending upon which set of ETFs is used. For Sector Detector, I use ten iShares ETFs representing the major U.S. business sectors.
About Trading Strategies: There are various ways to trade these rankings. First, you might run a sector rotation strategy in which you buy long the top 2-4 ETFs from SectorCast-ETF, rebalancing either on a fixed schedule (e.g., monthly or quarterly) or when the rankings change significantly. Another alternative is to enhance a position in the SPDR Trust exchange-traded fund (SPY) depending upon your market bias. If you are bullish on the broad market, you can go long the SPY and enhance it with additional long positions in the top-ranked sector ETFs. Conversely, if you are bearish and short (or buy puts on) the SPY, you could also consider shorting the two lowest-ranked sector ETFs to enhance your short bias.
However, if you prefer not to bet on market direction, you could try a market-neutral, long/short trade—that is, go long (or buy call options on) the top-ranked ETFs and short (or buy put options on) the lowest-ranked ETFs. And here’s a more aggressive strategy to consider: You might trade some of the highest and lowest ranked stocks from within those top and bottom-ranked ETFs.