Sector Detector: Higher quality may be back in vogue
 Small caps, mid-caps, Financials, Telecom, and Consumer Discretionary were among the market segments that hit new highs this week, even as bearish sentiment and short interest have risen, and there is still plenty of idle cash on the sidelines looking for a home. However, if we focus for a moment on small caps, you might not know that the WisdomTree Small Cap Earnings ETF (EES) has displayed significant outperformance versus the cap-weighted iShares Russell 2000 Index ETF (IWM). Since the March 2009 V-bottom, EES has nearly doubled the return of IWM, but over the past year they were tracking almost identically until mid-May when EES suddenly began to noticeably outperform.
EES is composed of 916 profitable small caps that are weighted by their relative earnings, so perhaps higher quality might be starting to matter again to investors. There’s no doubt that many speculative stocks with high short interest and questionable business models, earnings quality, and accounting practices have been coat-tailing the risk-on trade. But the cream always rises to top eventually.
As for earnings season, it has just gotten underway, and so far it has been encouraging. There have been many more beats than misses, which was expected given how low the bar has been set with all the reductions to guidance. Beaters on Wednesday included Bank of America (BAC), First Republic Bank (FRC), IBM (IBM), and Xilinx (XLNX), plus a big beat from Sabrient favorite SanDisk (SNDK), which was up +7% afterhours.
And lest you forget, the doves remain in control of the FOMC, comprising 11 of the 12 voting members, no matter what we hear about hawkishness among the non-voters. So, as Bernanke said last week, “highly accommodative monetary policy for the foreseeable future” is what we can expect. It’s all bullish.
The George Zimmerman trial has dominated the news lately. No matter how you feel about the verdict in this tragic case, there are lessons to be learned for the general public and an analogy for traders. For the general public, if you are ever walking through a strange neighborhood by yourself after dark and suspect you are being followed, it is likely either a mugger, a cop, or a neighborhood watchman, and in any case you should assume he is armed. So, your best move is to avoid confrontation by proceeding quickly to your destination or running to safety rather than jumping whoever is following you. You never know who’s packing.
For a trader, the analogy is, “Don’t fight the Fed.” After all, although Chairman Bernanke is not physically imposing, he and his dovish cohorts are always packing. They hold the gun and the bullets. A brief run of success scalping shorts in this market might embolden you to take greater risks, but ultimately the Fed is determined to maintain the wealth effect created by inflating the housing and stock markets until the economy can do the job on its own. Fight the trend at your own peril. If you truly believe excessive liquidity will ultimately lead to a market correction of epic proportions once the spigot is turned off, it’s best to wait for a confirmed breakdown from the safety of the sidelines or in solid, dividend-paying stocks with strong fundamentals and conservative accounting practices that tend to do well amid rising interest rates.
Looking at the chart of the SPDR S&P 500 Trust (SPY), it closed Wednesday near 168 and very close to its all-time high of 169 set in May, which is now providing some technical resistance. After an impressive recovery from the breakdown caused by the Fed’s talk of tapering its quant easing program, SPY is back above all its major moving averages and the uptrend line from November. There also appears to be another short-term uptrend line in place from that recent V-bottom recovery off the May breakdown. Oscillators RSI, MACD, and Slow Stochastic all look a bit tired, and could use a bit more technical consolidation, but there is a lot of strong support nearby in the form of uptrend lines, moving averages, and prior levels of support.
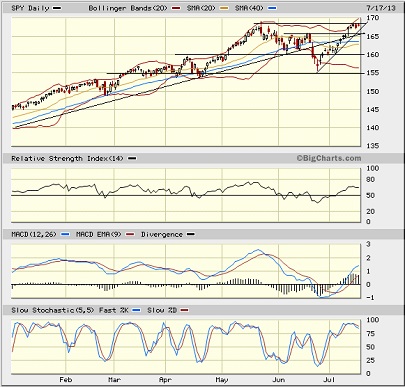
The CBOE Market Volatility Index (VIX), a.k.a. “fear gauge,” closed Wednesday at 13.78, which keeps it in the zone of complacency below 15 that we saw for most of the earlier part of the year.
On that note, a ConvergEx Morning Briefing this week discussed their monthly review of the volatilities in a variety of asset classes and sectors. They found that, “…the implied volatility in the options chains of everything from Energy stocks to Small Cap equities to junk bonds is down over the last 30 days…The only assets with a higher [volatility] over the past 4 weeks are Gold, Investment Grade Bonds and Emerging Markets.”
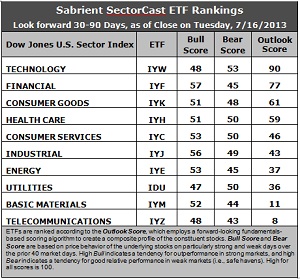
Latest rankings: The table ranks each of the ten U.S. business sector iShares ETFs by Sabrient's proprietary Outlook Score, which employs a forward-looking, fundamentals-based, quantitative algorithm to create a bottom-up composite profile of the constituent stocks within the ETF. The multi-factor model considers forward valuation, historical earnings trends, earnings growth prospects, the dynamics of Wall Street analysts' consensus estimates, accounting practices and earnings quality, and various return ratios. In addition, the table also shows Sabrient's proprietary Bull Score and Bear Score for each ETF.
High Bull score indicates that stocks within the ETF have tended recently toward relative outperformance during particularly strong market periods, while a high Bear score indicates that stocks within the ETF have tended to hold up relatively well during particularly weak market periods. Bull and Bear are backward-looking indicators of recent sentiment trend.
As a group, these three scores can be quite helpful for positioning a portfolio for a given set of anticipated market conditions.
Observations:
1. Technology (IYW) remains in the top spot with a robust Outlook score of 90, as scores have changed very little this week. Stocks within IYW display a low forward P/E, a solid long-term projected growth rate, and the best return ratios. Wall Street analysts are not showing great optimism about their earnings projections, but they really aren’t downgrading, either. Financial (IYF) to take the second spot again with a score of 77 as stocks within IYF enjoy the best Wall Street support, a low forward P/E, and strong insider sentiment. Healthcare (IYH) drops from third to fourth, as Consumer Goods (IYK) moves back ahead of it with an Outlook score of 61. In case you were wondering, fifth-place Consumer Services (IYC) enjoys the highest long-term projected growth rate, while seventh-place Energy (IYE) enjoys the lowest forward P/E.
2. Telecom (IYZ) stays in the cellar yet again with an Outlook score of 8. Although stocks within IYZ enjoy relatively stable analyst support, they are generally weak in all other factors, including a high forward P/E, low long-term projected growth, and poor return ratios. Also in the bottom two again this week is Basic Materials (IYM) with a score of 11, as stocks within this sector were hammered even worse this week with downward earnings revisions from Wall Street.
3. This week’s fundamentals-based rankings are little changed from last week and retain their slightly bullish bent. Industrial (IYJ) moved ahead of Energy (IYE) even though its Outlook score dropped, so that makes it less of a bullish development than it might at first appear. A major concern remains the dearth of Wall Street earnings net upgrades for any of the sectors.
4. Looking at the Bull scores, IYF has been the leader on particularly strong market days, scoring 57, followed closely by IYJ, while Utilities (IDU) scores the lowest at 47. The top-bottom spread is still a narrow 10 points, indicating relatively high sector correlations, which indicates more of a “risk-on/risk-off” approach in which all boats are lifted together, rather than a thoughtful stock-picking approach.
5. Looking at the Bear scores, IYW remains the surprising favorite “safe haven” on weak market days, scoring 53, which is well ahead of defensive sectors like Utilities (IDU), but is not anywhere near the usual high in Bear scores of around 65-70 that we’ve often seen in IDU. IYZ is also surprising as the having the worst performance during extreme market weakness as reflected in its low Bear score of 43. We often think of Telecom as a defensive sector. The top-bottom spread is again only 10 points, which indicates relatively high sector correlations on weak market days.
6. Overall, Technology (IYW) shows the best all-weather combination of Outlook/Bull/Bear scores. Adding up the three scores gives a total of 191. Telecom (IYM) is the by far the worst at 99. Looking at just the Bull/Bear combination, Industrial (IYJ) displays the highest score of 105, which indicates good relative performance in extreme market conditions (whether bullish or bearish), while Telecom (IYZ) scores the lowest at 91, which indicates investor avoidance during extreme conditions.
These Outlook scores represent the view that Technology and Financial sectors may be relatively undervalued, while Telecom and Basic Materials sectors may be relatively overvalued based on our 1-3 month forward look.
Some top-ranked stocks within IYW and IYF include CACI International (CACI), Harris Corp (HRS), Prosperity Bancshares (PB), and Citigroup (C). Each of these also displays a solid score in our new Earnings Quality Rank (EQR), which is a pure accounting-based risk assessment signal that has proven valuable for both fundamental screening and as an orthogonal alpha factor for quant models. It was co-developed by Sabrient and subsidiary Gradient Analytics, a forensic accounting firm.
As a reminder, Sabrient’s annual Baker’s Dozen portfolio of top stocks for 2013 continues to perform exceedingly well. It is up +24.6% from the portfolio’s inception on January 11, led by Genworth Financial (GNW), which is up +57%. In fact, all 13 stocks are positive, and 12 are comfortably up by double digits, while the S&P 500 is up only +14.2% over the same timeframe. The underlying model includes EQR as a key scoring factor to help avoid meltdowns that can ruin overall portfolio performance.
Also, we publish a quarterly Earnings Busters portfolio of 20 stocks based on a similar algorithm. The Q2 portfolio was up +12.2% during the 4/15-7/15 period, led by Santarus (SNTS) up +44%, compared with S&P 500 of +8.0%. The current Q3 portfolio launched on July 1 and it is already up over +5.5% (vs. S&P 500 up +4.4%) with 18 of the 20 stocks positive, led by Pacific Continental Corp (PCBK) up +14.3%. With strong earnings trends and EQR as important factors in the Baker’s Dozen and Earnings Busters models, this is another indication that higher quality stocks may be coming back in vogue.
Disclosure: Author has no positions in stocks or ETFs mentioned.
About SectorCast: Rankings are based on Sabrient’s SectorCast model, which builds a composite profile of each equity ETF based on bottom-up aggregate scoring of the constituent stocks. The Outlook Score employs a fundamentals-based multi-factor approach considering forward valuation, earnings growth prospects, Wall Street analysts’ consensus revisions, accounting practices, and various return ratios. It has tested to be highly predictive for identifying the best (most undervalued) and worst (most overvalued) sectors, with a 1-3 month forward look.
Bull Score and Bear Score are based on the price behavior of the underlying stocks on particularly strong and weak days during the prior 40 market days. They reflect investor sentiment toward the stocks (on a relative basis) as either aggressive plays or safe havens. So, a high Bull score indicates that stocks within the ETF have tended recently toward relative outperformance during particularly strong market periods, while a high Bear score indicates that stocks within the ETF have tended to hold up relatively well during particularly weak market periods.
Thus, ETFs with high Bull scores generally perform better when the market is hot, ETFs with high Bear scores generally perform better when the market is weak, and ETFs with high Outlook scores generally perform well over time in various market conditions.
Of course, each ETF has a unique set of constituent stocks, so the sectors represented will score differently depending upon which set of ETFs is used. For Sector Detector, I use ten iShares ETFs representing the major U.S. business sectors.
About Trading Strategies: There are various ways to trade these rankings. First, you might run a sector rotation strategy in which you buy long the top 2-4 ETFs from SectorCast-ETF, rebalancing either on a fixed schedule (e.g., monthly or quarterly) or when the rankings change significantly. Another alternative is to enhance a position in the SPDR Trust exchange-traded fund (SPY) depending upon your market bias. If you are bullish on the broad market, you can go long the SPY and enhance it with additional long positions in the top-ranked sector ETFs. Conversely, if you are bearish and short (or buy puts on) the SPY, you could also consider shorting the two lowest-ranked sector ETFs to enhance your short bias.
However, if you prefer not to bet on market direction, you could try a market-neutral, long/short trade—that is, go long (or buy call options on) the top-ranked ETFs and short (or buy put options on) the lowest-ranked ETFs. And here’s a more aggressive strategy to consider: You might trade some of the highest and lowest ranked stocks from within those top and bottom-ranked ETFs.