Sector Detector: Investors get a second-chance entry point, courtesy of coronavirus, algo traders, and Bernie
 by Scott Martindale
President & CEO, Sabrient Systems LLC
What a week. From its intraday all-time high on 2/19/20 to the intraday low on Friday 2/28/20, the S&P 500 fell -15.8%. It was a rare and proverbial “waterfall decline,” typically associated with a Black Swan event – this time apparently driven primarily by fears that the COVID-19 virus would bring the global economy to its knees. Once cases started popping up across the globe and businesses shuttered their doors, it was clear that no amount of central bank liquidity could help.
But in my view, it wasn’t just the scare of a deadly global pandemic that caused last week’s selloff. Also at play were the increasing dominance of algorithmic trading to exaggerate market moves, as well as the surprising surge in popularity of dustbin Bolshevik Bernie Sanders. I think both lent a hand in sending investors into a tizzy last week.
Even before fears of a pandemic began to proliferate, market internals were showing signs of worry. After a sustained and long-overdue risk-on rotation into the value factor, small-mid caps, and cyclical sectors starting on 8/27/19, which boosted the relative performance of Sabrient’s portfolios, investor sentiment again turned cautious in the New Year, even as the market continued to hit new highs before last week’s historic selloff. It was much the same as the defensive sentiment that dominated for most of the March 2018 — August 2019 timeframe, driven mostly by the escalating China trade war. (It seems like all market swoons these days are related to China!)
Alas, I think we may have seen on Friday a selling climax (or “capitulation”) that should now allow the market to recover going forward. In fact, the market gained back a good chunk of ground in the last 15 minutes of trading on Friday – plus a lot more in the afterhours session – as the extremely oversold technical conditions from panic selling triggered a major reversal, led by institutional and algorithmic traders. That doesn’t mean there won’t be more volatility before prices move higher, but I think we have seen the lows for this episode.
The selloff wasn’t pretty, to be sure, but for those who were too timid to buy back in October, you have been given a second chance at those similar prices, as the forward P/E on the S&P 500 fell from nearly 19.0x to 16.3x in just 7 trading days. Perhaps this time the broad-based rally will persist much longer and favor the risk-on market segments and valuation-oriented strategies like Sabrient’s Baker’s Dozen – particularly given our newly-enhanced approach designed to improve all-weather performance and reduce relative volatility versus the benchmark S&P 500.
In this periodic update, I provide a detailed market commentary (including other factors at play in the market selloff), discuss Sabrient’s new process enhancements, offer my technical analysis of the S&P 500, and review Sabrient’s latest fundamentals-based SectorCast rankings of the ten US business sectors, and serve up some actionable ETF trading ideas. In summary, our sector rankings look neutral, and our sector rotation model moved to a defensive posture when the S&P 500 lost support from its 200-day moving average. The technical picture has moved dramatically from grossly overbought to grossly oversold in a matter of a few days, such that the S&P 500 has developed an extreme gap below its 20-day moving average and the VIX is at an extreme high. Thus, I believe a significant bounce is likely.
As a reminder, you can find my latest Baker’s Dozen presentation slide deck and commentary at http://bakersdozen.sabrient.com/bakers-dozen-marketing-materials. Click to Read on....
Market commentary:
Goldman Sachs recently observed that, “In recent years, with rising vol of vol, drawdowns have been faster and sharper which is in part due to positioning” such that last week’s selloff is indicative of a secular trend towards violent market dislocations and rapid repricing of risk in the modern market.
As a result of the selloff, BlackRock’s "fear gauge,” which plots the relationship between the CBOE Volatility Index (VIX) and the 10-year Treasury, hit its worst reading since the eurozone crisis of 2011. The VIX hit an intraday high of 49.48 on Friday, up from a close of 17.08 on the previous Friday. But outside of the 2008-9 financial crisis, rarely has the VIX hit 50. In fact, over the past 30 years, outside of the 2008-9 financial crisis, there have been only 2 days in which an intraday reading on the VIX was higher than 50. And such an extreme level of fear is typically a contrarian indicator suggesting that selling nearly exhausted. Furthermore, the yield on the benchmark 10-year US Treasury closed at 1.127% on Friday (and reached as low as 1.064% this morning!), setting an all-time low, after closing 2019 (just several weeks ago) at 1.92%, and after reaching a high of 3.25% just 17 months ago.
Rather that laying it all on COVID-19, I think the market actually was reacting to a combination of four factors: 1) extremely overbought technical conditions and lofty valuations, causing many traders to be looking for any excuse to bail; 2) algorithmic traders (aka “algos,” who now control the bulk of daily trading volume) happily exaggerating major market moves; 3) widespread fears that the coronavirus will become a global economy-killing pandemic, and 4) proud socialist Bernie Sanders displaying a real shot at winning the presidency and implementing economy-killing measures with multiple Executive Orders.
Indeed, the first two are related, as the algo traders had pushed up stocks well ahead of the corporate earnings recovery, with a forward P/E on the S&P 500 of nearly 19x, as the rally since 12/24/2018 was built almost entirely on multiple expansion, leaving little cushion to absorb a Black Swan event like the coronavirus. Thus, those same algos were only too happy to jump to the other side of the see-saw to push prices back down – and I expect they will soon reverse course to push prices back to the upside. As for COVID-19, despite its high transmissibility, it seems that its severity may be less than feared for all but those with preexisting pulmonary issues or heavy smokers, and optimism is growing that the outbreak will be contained, particularly as spring brings warmer weather. And as for Bernie, Jeffrey Gundlach of Doubleline Capital, who thinks the selloff was mostly due to Bernie’s rise, opined on a potential self-perpetuating pattern, “The market goes down in a knee jerk way on the Bernie rise, but the market going down makes Bernie's polls go up on his rejection of a market based economy. Which makes the market go down another leg…Rinse and repeat."
Please indulge me a brief aside. Our Founding Fathers quite deliberately, brilliantly, and presciently created a constitutional republic at the federal level rather than a pure democracy. Indeed, a pure democracy means majority rule, which easily can devolve into mob rule in which individual rights (including property rights and freedom from force and coercion) are either subordinate or irrelevant. In a republic, the rights of the individual are paramount. When politicians lament their frustration with features of our system like a bicameral legislature and electoral college, it is because a simple majority vote would better serve their personal objectives today, often in pursuit of what they deem the “common good.” But our founders knew very well where that road can lead. As Benjamin Franklin himself once explained, “Democracy is two wolves and a sheep deciding what to have for dinner.” As a reminder, Bolsheviks in Russia followed the ideas of Karl Marx in believing that the working classes should be liberated from the economic and political control (aka “tyranny”) of the ruling classes (aka “top 1%”). Sound familiar? Punishing the highest achievers by confiscating and redistributing their wealth through big government socialist programs designed to collectivize America and make us dependent (and subservient) to the state is hardly the answer to the distortions of “crony capitalism.” Instead of resurrecting the dustbin of history to line up behind socialism, young Americans would be much better served by demanding a return to our constitutional roots. But I digress.
2020 sees a return in defensive sentiment:
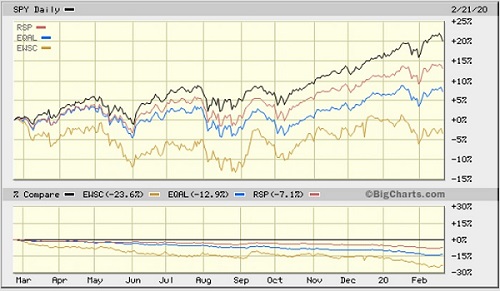
Let’s take a closer look at the past 12 months, which roughly corresponds to the life of the February 2019 Baker’s Dozen portfolio. The portfolio’s default benchmark, the cap-weighted S&P 500, which of course is dominated by a handful of mega-cap Tech secular growth juggernauts, has handily outperformed its equal-weighted brethren, including the S&P 500 Equal-Wt (RSP), the Russell 1000 Equal-Wt (EQAL), and the S&P 600 Small Cap Equal-Wt (EWSC), as shown in the chart below for the 12 months leading up to 2/21/20, just before last week’s big selloff. This made it quite difficult for any cap-diversified and equal-weight portfolio to keep up with the narrow leadership of the S&P 500. Even during last week’s selloff, the Value factor and small-mid caps lagged Growth and Momentum factors and large caps, according to S&P Dow Jones Indices.
Moreover, as small caps and value/cyclicals continue to be ignored, the performance divergence versus large caps and low-volatility/defensives keeps widening, and the persistence of Growth-versus-Value factor outperformance has become historic. Billionaire quant hedge fund manager Cliff Asness of AQR Capital recently observed that, even as the market was hitting new highs on 2/19/20, the 2020 YTD large cap Value relative performance to Growth is in the 3rd percentile of all observations since 1991, while going back only to 2010 (when Growth began to consistently outperform Value) it is in the 0th percentile (yes, I mean zeroth), which implies that the first 6 weeks of 2020 was the worst 6-week period for value investing in the past 10 years. And although Sabrient doesn’t employ a strict value strategy (which is why we were able to outperform for most of the past 10 years, our Growth at a Reasonable Price (GARP) approach does have a strong value bent.
The widely followed Russell 2000 small cap index has not outperformed the S&P 500 Index since 2016 and in fact has outperformed only four of the past ten calendar years. And the resulting investor disappointment has been self-perpetuating given the dominance of passive investing, as US large cap ETF inflows were solidly positive YTD through 2/21/20, while US small cap ETFs suffered massive outflows – despite predictions of an imminent “mean reversion” of the historic relative valuation divergence. Furthermore, the aggregate market cap of just the five famed “MAGA-F” stocks (Microsoft, Apple, Google, Amazon, Facebook) is now more than twice the size of the entire Russell 2000 small cap index.
And as the market was hitting new highs, it was the four MAGA stocks leading the way. From a broader perspective, the S&P 500 was being led by Technology (e.g., XLK) and Utility (e.g., XLU) sectors along with US Treasury bonds (e.g., TLT) in something of a “barbell” investing approach of high-beta/secular-growth on one end and low-volatility/high-dividend payers (“bond proxies”)/bonds on the other end. And global investors had returned to their stark (and highly defensive) preference for the US. In fact, Bespoke Investment Group reported that as of 2/12/20, the US accounted for nearly 41% of total world equity market capitalization, which is up from 30% a decade ago.
Many blame this persistent underperformance in small-cap, value, and foreign markets on the extraordinary interference of central bank monetary policies since the financial crisis. Others see it as a more recent phenomenon tied to the global populist movement, which manifested in the US with the popularity of Donald Trump and Bernie Sanders (and the associated uncertainties in healthcare, energy, global supply chains, protectionism, and tariffs). Still others cite the increasing appeal of passive investing, which is dominated by market cap-weighted indexes. My friends at DataTrek opined that as defensive investors this year were moving capital out of US stocks and into fixed income, they were also “up-risking” their remaining equity exposure to keep overall portfolio expected returns relatively constant (and out of a fear of missing out), and as a result, “…growth stocks get an ever-larger premium, value languishes, and rates remain low from a persistent bid driven by asset reallocation.”
Sabrient adjusts to a “new normal” in market sentiment:
Over the past few years, Sabrient’s long-standing model has favored cyclicals (e.g., Materials, Energy, Industrials, and Financial sectors, plus industries like homebuilding, semiconductors, transports), which tend to display strong earnings growth in a growing economy, as well as small-mid caps, as secular-growth Technology companies and large caps in general have been largely “bid up” to high valuations. Such tilts represent areas in which an investor historically would want to be positioned in a growing economy – and especially today for a convergence of the relative-valuation bubble. But it appears that perhaps a “new normal” has set in.
Other fund managers who subscribe to fundamentals and valuation-driven strategies, like Cliff Asness of AQR Capital, are choosing to stick with their long-successful strategies despite the past two years of unusual pain – essentially waiting for market sentiment to “re-rationalize” so that performance might turn around. In fact, Dr. Asness recently wrote, “We are not indifferent between the good and bad times – far from it! But caring desperately should not lead to acting foolishly. We think much of long-term investment success is still about sticking with real but modest edges for the long-term.” Similarly, JPMorgan’s global head of quant strategy Marko Kolanovic wrote, “Our view that cyclical and value assets should rally in the first quarter was set back by the COVID-19 epidemic…We caution investors that this bubble will likely collapse, i.e. this time is not ‘different.”
However, Michael Arone of SSGA wrote, “Value investors and mean reversion enthusiasts looking for someone or something to blame should look no further than the incredible market distortions brought on by extraordinary government policies and unprecedented central bank interference in financial markets. I don’t know about you, but I don’t see that changing anytime soon. As a result, I expect that US large-cap growth stocks will soldier on for a little while longer.”
After 6-1/2 years of consistent outperformance for Sabrient’s Baker’s Dozen portfolios since launch in 2009 (as illustrated in the chart below for a theoretical rolling January portfolio), the rise in popularity of disruptive leaders with a populist message like Donald Trump and Bernie Sanders (and others around the world) starting in mid-2015 changed the character of investor sentiment to be more cautious and defensive, and thus wary of cyclical growth and smaller caps (despite a positive economic outlook) while pushing large-cap secular growth companies to elevated P/E multiples. And although stocks saw a “Trump Bump” in anticipation of tax cuts and deregulation throughout 2017 favoring the risk-on sectors, allowing Sabrient’s portfolios to outperform, in March 2018 the extreme escalation in the trade war with China threw a monkey wrench into it all and risk-off sentiment took hold, ultimately leading to the Q4 2018 selloff.
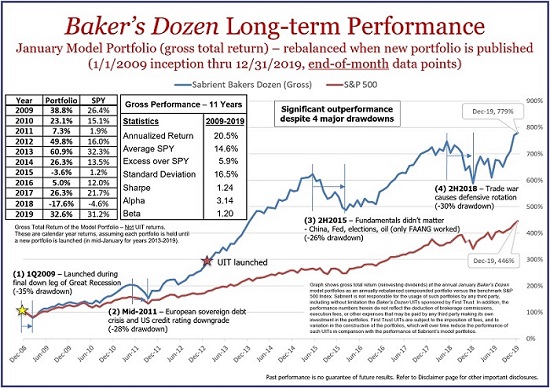
Then, even with the rapid recovery from that selloff, most of 2019 was dominated by investor caution, largely due to concerns about further escalation in the trade war, contraction in the manufacturing segment, reduced corporate capital spending, and slowing global economic growth. Finally, starting on 8/27/2019, the market saw the sustained risk-on rotation back into cyclical sectors and small-mid caps that one would expect given the actual fundamental outlook of rising GDP growth, a strong consumer, record low unemployment, and low interest rates.
Even during those first 6-1/2 years in which the Baker’s Dozen portfolios consistently outperformed, temporary periods would arise in which investor sentiment became misaligned from the consensus fundamental outlook of the sell-side analyst community. This is normal market behavior, so Sabrient chose to stay true to its disciplined investment process and ride out those fleeting periods of misalignment. However, in retrospect, it seems mid-2015 marked the beginning of a “new normal” of persistent and painful periods of irrational/unwarranted defensive sentiment due to both macro events (like populism, elections, China trade war, Fed monetary policy) and the rise of algorithmic trading (which can amplify and prolong fluctuations in sentiment).
Although it seems as though it is only the last two years since the trade war escalated that has so changed market sentiment, in reality it has been going on since mid-2015. In fact, it has been unlike anything we had seen or tested on our quantitative models in the past (i.e., since the “irrational exuberance” of the Internet Bubble burst in 2000), and our portfolios have struggled at times during much of the past nearly five years. So, we at Sabrient came to the conclusion that this global “new normal” warranted some introspection, leading us to develop and implement two new enhancements to our longstanding portfolio selection approach. We wanted to retain most of the alpha during the “good” times and also better cushion the downside during the “bad” times, while also acknowledging that investors are comparing our performance to the S&P 500 (however unfair that comparison might be in times of narrow, mega-cap, secular-growth Tech leadership).
Of course, this isn’t the first time we have enhanced our process, such as when we developed our proprietary Earnings Quality Rank (EQR) with our wholly-owned subsidiary Gradient Analytics, a forensic accounting research firm, and when we added a third-party corporate integrity score to our fundamental review process. Similarly, the new enhancements aim to preserve the market-beating potential investors had come to expect (before the last two years of seemingly irrational sentiment) while reducing relative volatility versus the benchmark S&P 500 (with new limitations on extreme sector “tilts”) and providing better all-weather performance (with the addition of a new proprietary Growth Quality Rank, aka GQR, as an alpha factor in our quant model. GQR measures the consistency and predictability of a company’s earnings and thus its likelihood of meeting estimates, while also allowing for more in the way of secular growth companies (even if they display slightly higher forward P/Es) rather than letting the model steer stock selection heavily into lower-P/E cyclical growth companies.
Examples of stocks that have been selected for recent Baker’s Dozen portfolios largely due to the addition of the new GQR factor include names like Adobe (ADBE), Autodesk (ADSK), Advanced Micro Devices (AMD), and Charter Communications (CHTR), all of which displayed elevated P/Es (compared to what we normally seek) of over 35x, but also consistently strong historical and projected EPS growth rates. In fact, 4 of the 13 names in our Q1 2020 Baker’s Dozen displayed top scores in both EQR (5 on a scale of 1-5) and GQR (10 on a scale of 1-10) – ADBE, ADSK, Anthem (ANTM), and Bristol-Myers (BMY).
Market outlook:
Mohamed El-Erian’s (Allianz Capital) view for the past few weeks has been that we should “resist our inclination to buy the dip” because he thinks the coronavirus will paralyze the global economy, with little help afforded by any amount of central bank liquidity. Nevertheless, CME Group fed funds futures are now pricing 100% probability of a 50-bp rate cut on or before the March 18 meeting, 87% chance of another 25-50 bps by the June meeting, and a slight 7% chance that rates will be back to zero (i.e., ZIRP) by year end.
But to me, this dip is a welcome buying opportunity. As Tom Porcelli, chief U.S. economist at RBC Capital Markets, has said, “…even if we are looking at a supply shock where postponed activity does not fully get recaptured, it still does not warrant a 10% repricing in a market that is supposed to be forward-looking in nature and ultimately realigns with fundamentals.”
The coronavirus seems to me to be more similar to a severe seasonal flu (albeit one without an effective vaccine) than the Black Death of the 14th Century. Nor has it proven as deadly as SARS or MERS. From a broader perspective, the US enjoys so many positives right now, including low inflation, ultra-low interest rates and an accommodative Fed, a strong dollar, record low unemployment, rising wages, cheap oil and gas, rising business and consumer confidence, and improving manufacturing readings (which had been the main trouble spot). Some pundits have noted the impressive stability of GDP growth, low inflation, and the strong labor market (rather than their trajectories) as highly encouraging indicators. Moreover, after 14 quarters of essentially flat or falling corporate earnings, consensus expectations still see a positive turn this year, with earnings growth expected to reach nearly 10% starting in Q2 (or even more if there is a “catch up” aspect to the virus-induced global slowdown). Corporate tax cuts and lowered regulatory compliance expenses have freed up cash for aggressive buyback programs, raised dividends, and increased capital spending. And while the forward P/E on the S&P 500 had become quite elevated (before the selloff), the price-to-free cash flow ratio and price-to-returned capital (dividends + buybacks) has remained at long-term averages.
So, both monetary and fiscal policy here in the US are working in concert to stimulate economic activity, and the Trump Administration continues to spend rather than cut while signaling a desire for additional fiscal stimulus in the form of a Middle-Class tax cut, continued deregulation, and an infrastructure spending bill. And looking overseas, monetary and fiscal stimulus is in overdrive, especially in China, which has also reduced tariffs on US goods in accordance with Phase One of the U.S.-China trade deal. And finally, there is the supply/demand issue of outstanding shares of US equities versus their demand among global investors awash in liquidity. As Fundstrat’s Tom Lee said in a recent note to clients, “The S&P 500 is about $25 trillion in market cap and there is $300 trillion of global household liquid assets.”
Of course, risks abound (as they always do), as I described in my January article, including rising wealth inequality (leading to socialism and Modern Monetary Theory), growing tension in the Middle East, high debt levels around the world, a re-escalation in trade wars, or a liquidity event in the US (given the dysfunctional repo market and massive federal deficit spending) – or even a so-called “Minsky Moment” (which I have discussed in the past) in which asset values crash because of “Ponzi financing” in the face of global stagflation. But for now, despite the apparent Black Swan event in the form of a potentially crippling global health scare, I believe fears will pass within a matter of a few months, if not several weeks, and we may be in the early stages of a new expansionary cycle that could run for several years, driven by an upswing in manufacturing activity, infrastructure spending, and new technologies like 5G, the Internet of Things (IoT), AI/ML, robotics, clean energy, oil fracking, blockchain, space travel, quantum computing, nanotechnology, genomics, and precision medicine.
SPY Chart Review:
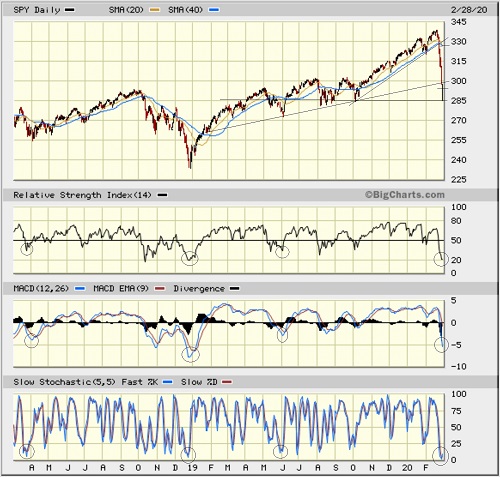
The SPDR S&P 500 ETF (SPY) closed last week at about 296. It lost support at all the gaps and minor support levels I discussed in my January article. Price even fell below its important 200-day simple moving average (SMA) but managed to regain its 300-day SMA by end of day on Friday. The technical picture has moved dramatically from grossly overbought to grossly oversold in a matter of a few days, such that the S&P 500 has developed an extreme gap below its 20-day moving average, which will likely close considerably before potentially retesting these latest lows. Looking at the 2-year chart, SPY essentially has come all the way back to the base from which it launched higher back in the August-October 2019 timeframe. Oscillators RSI, MACD, and Slow Stochastics are all deeply oversold. And over the past 2 years, whenever Slow Stochastic has fallen to the zero line while confirmed by oversold levels for MACD and Relative Strength, a solid rally has ensued. Of course, this time might be different given the uncertainty around the coronavirus (not to mention the Sanders presidential bid). But the big difference now is that traders will be looking for bullish entry points and reasons to buy rather than overbought, lofty valuation, bearish reasons to sell.
Latest Sector Rankings:
Relative sector rankings are based on our proprietary SectorCast model, which builds a composite profile of each of nearly 500 equity ETFs based on bottom-up aggregate scoring of the constituent stocks. The Outlook Score employs a forward-looking, fundamentals-based multifactor algorithm considering forward valuation, historical and projected earnings growth, the dynamics of Wall Street analysts’ consensus earnings estimates and recent revisions (up or down), quality and sustainability of reported earnings, and various return ratios. It helps us predict relative performance over the next 2-6 months.
In addition, SectorCast computes a Bull Score and Bear Score for each ETF based on recent price behavior of the constituent stocks on particularly strong and weak market days. A high Bull score indicates that stocks within the ETF recently have tended toward relative outperformance when the market is strong, while a high Bear score indicates that stocks within the ETF have tended to hold up relatively well (i.e., safe havens) when the market is weak.
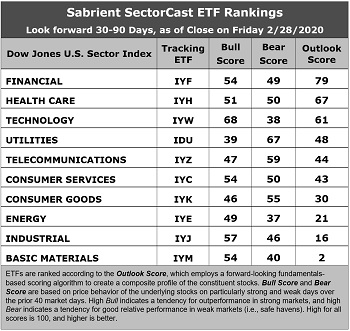
Outlook score is forward-looking while Bull and Bear are backward-looking. As a group, these three scores can be helpful for positioning a portfolio for a given set of anticipated market conditions. Of course, each ETF holds a unique portfolio of stocks and position weights, so the sectors represented will score differently depending upon which set of ETFs is used. We use the iShares that represent the ten major U.S. business sectors: Financial (IYF), Technology (IYW), Industrial (IYJ), Healthcare (IYH), Consumer Goods (IYK), Consumer Services (IYC), Energy (IYE), Basic Materials (IYM), Telecommunications (IYZ), and Utilities (IDU). Whereas the Select Sector SPDRs only contain stocks from the S&P 500 large cap index, I prefer the iShares for their larger universe and broader diversity.
Here are some of my observations on this week’s scores:
1. Despite the massive selloff and new fears of global recession, the rankings haven’t changed very much. Financial remains in the top spot with an Outlook score of 79, with generally solid scores across the board, including an attractive forward P/E (13.8x), flat sell-side analyst sentiment (net positive revisions to EPS estimates) compared with massive cuts in other sectors, a solid projected year-over-year aggregate EPS growth rate of 9.3%, an attractive forward PEG ratio (forward P/E divided by projected EPS growth rate) of 1.48, and the best insider sentiment (open market insider buying). Moving into second is Healthcare with a score of 67, mostly due to its relatively attractive forward P/E (15.2x), solid EPS expected growth (11.0%), low forward PEG (1.39), and good return ratios. Rounding out the top six are Technology, Utilities, Telecom, and Consumer Services (Discretionary/Cyclical). Notably, Technology displays a high projected EPS growth rate of 14.5%) but also the highest forward P/E (20.3x).
2. At the bottom of the rankings we find three cyclical sectors: Basic Materials, Industrial, and Energy. All have seen massive net reductions to earnings estimates from the sell-side analyst community – although Telecom and Consumer Goods (Staples/Noncyclical) have seen substantial cuts, as well. We are still waiting to see upward revisions to guidance in light of the Phase One trade deal with China, which may not happen until the coronavirus panic phase is behind us.
3. Looking at the Bull scores, Technology has the top score of 68, as stocks within this sector in particular have displayed relative strength on strong market days. Defensive sector Utilities scores the lowest at 39. The top-bottom spread is a healthy 29 points, which reflects quite low sector correlations on strong market days. It is desirable in a healthy market to see low correlations reflected in a top-bottom spread of at least 20 points, which indicates that investors have clear preferences in the market segments and stocks they want to hold (rather than broad risk-on behavior).
4. Looking at the Bear scores, as usual we find defensive sector Utilities alone in the top spot with a score of 67, which means that stocks within this sector have been the preferred safe havens lately on weak market days. Energy displays the lowest score of 37, followed closely by Technology at 38, as investors have fled during recent market weakness. The top-bottom spread is 30 points, which reflects quite low sector correlations on weak market days. Ideally, certain sectors will hold up relatively well while others are selling off (rather than broad risk-off behavior), so it is desirable in a healthy market to see low correlations reflected in a top-bottom spread of at least 20 points.
5. Financial displays the best all-around combination of Outlook/Bull/Bear scores, followed by Healthcare, while Materials is the worst. Looking at just the Bull/Bear combination, Technology, Utilities, and Telecom tie for the best, indicating superior relative performance (on average) in extreme market conditions (whether bullish or bearish), while Energy is by far the worst, and the best balance is displayed by Consumer Services (Discretionary/Cyclical) as it scores above 50 on both metrics.
6. I would say this week’s fundamentals-based Outlook rankings continue to reflect a neutral bias, given the mix of defensive and economically sensitive sectors among the top six, and given that three cyclical sectors are at the bottom. It appears that the sell-side analyst community is still grappling with visibility in capital spending programs and earnings growth, and the new economic scares aren’t helping matters. Keep in mind, the Outlook Rank does not include timing, momentum, or relative strength factors, but rather reflects the consensus fundamental expectations at a given point in time for individual stocks, aggregated by sector.
ETF Trading Ideas:
Our Sector Rotation model, which appropriately weights Outlook, Bull, and Bear scores in accordance with the overall market’s prevailing trend (bullish, neutral, or defensive), has moved to a defensive bias and suggests holding Utilities (IDU), Telecom (IYZ), and Financial (IYF), in that order. (Note: In this model, we consider the bias to be defensive from a rules-based trend-following standpoint when SPY is below both its 50-day and 200-day simple moving averages.)
Besides iShares’ IDU, IYZ, and IYF, other highly-ranked ETFs in our SectorCast model (which scores nearly 800 US-listed equity ETFs) from the Utilities, Telecom, and Financial sectors include Virtus Reaves Utilities (UTES), Communications Services Select Sector SPDR (XLC), and SPDR S&P Capital Markets (KCE).
If you prefer a neutral bias, the Sector Rotation model suggests holding Financial, Healthcare, and Technology, in that order. On the other hand, if you are comfortable taking a bullish stance on the market, the model suggests holding Technology, Financial, and Healthcare, in that order.
An assortment of other interesting ETFs that are scoring well in our latest rankings include US Global Jets (JETS), Davis Select Financial (DFNL), Arrow QVM Equity Factor (QVM), iShares Mortgage Real Estate (REM), First Trust NASDAQ Technology Dividend Index (TDIV), iShares US Broker-Dealers & Securities Exchanges (IAI), John Hancock Multifactor Financials (JHMF), Invesco S&P SmallCap 600 Pure Growth (RZG), WBI BullBear Rising Income 3000 (WBIE), VanEck Vectors Pharmaceutical (PPH), First Trust Dorsey Wright Momentum & Value (DVLU), Invesco BuyBack Achievers (PKW), SPDR S&P Insurance (KIE), Invesco Dynamic Biotechnology & Genome (PBE), iShares US Home Construction (ITB), and VanEck Vectors Semiconductor (SMH).
As always, I welcome your thoughts on this article! Please email me, as any and all feedback is appreciated!
IMPORTANT NOTE: I post this information periodically as a free look inside some of our institutional research and as a source of some trading ideas for your own further investigation. It is not intended to be traded directly as a rules-based strategy in a real money portfolio. I am simply showing what a sector rotation model might suggest if a given portfolio was due for a rebalance, and I do not update the information on a regular schedule or on technical triggers. There are many ways for a client to trade such a strategy, including monthly or quarterly rebalancing, perhaps with interim adjustments to the bullish/neutral/defensive bias when warranted, but not necessarily on the days that I happen to post this article. The enhanced strategy seeks higher returns by employing individual stocks (or stock options) that are also highly ranked, but this introduces greater risks and volatility. I do not track performance of the ideas mentioned here as a managed portfolio.
Disclosure: At the time of this writing, the author held leveraged long positions and protective puts on the SPY.
Disclaimer: This newsletter is published solely for informational purposes and is not to be construed as advice or a recommendation to specific individuals. Individuals should take into account their personal financial circumstances in acting on any opinions, commentary, rankings, or stock selections provided by Sabrient Systems or its wholly owned subsidiary Gradient Analytics. Sabrient makes no representations that the techniques used in its rankings or analysis will result in or guarantee profits in trading. Trading involves risk, including possible loss of principal and other losses, and past performance is no indication of future results.