Sector Detector: Stock market approaching a crossroads
 Stocks provided a volatile and sweat-inducing ride last week in what many investors and traders thought might be the big selloff that so many have been predicting. Although the market tends to follow a path that fools the greatest number of people, sometimes it behaves in a self-fulfilling prophesy. It simply had to selloff eventually -- to shake out the weaker holders and provide an irresistible entry point to attract fresh capital from the high-conviction bulls. Now the market finds itself approaching a critical crossroads in which it must decide whether to go for a bullish breakout…or make a bearish reversal that ultimately tests critical support levels, including the 200-day simple moving average.
Historically, equity and bond prices move in opposite directions. Periods of strong economic growth typically led to rising equity prices (risk on), while periods of weaker growth led to rising bond prices (risk off). More recently, however, equity and bond prices were highly correlated as Fed liquidity drove cheap capital into both. But ever since the Fed announced its intention to taper quant easing, correlations have fallen and equities have greatly outperformed bonds. However, there has been no massive selloff in bonds as part of an expected “Great Rotation” into equities, at least not yet, and in fact the latest “flight to safety” has pushed capital back into Treasuries.
The 10-year Treasury yield is now at 2.68%, and a yield below 3-3.5% is highly supportive of current stock valuations. In fact, the trailing P/E of the S&P 500 is still around the historical average in the mid-16s, which means that prices have further to go to the upside before the market can be considered frothy, especially with the low fixed income yields that help justify higher P/E multiples.
Nevertheless, improving economic fundamentals eventually will drive longer-term interest rates higher. But rather than be concerned that stock valuations will be pressured, the trade-off will be that a steepening yield curve is historically reflective of a healthy economy and rising corporate earnings growth.
U.S. GDP grew at a +3.2% annual rate during Q4 and +4.1% in Q3, which was the best 6-month growth in over a decade. Continued GDP acceleration, helped along by flat or falling energy prices as domestic production increases, will allow corporate earnings to rise, as well.
Among the ten U.S. business sectors, Utilities and Healthcare are still the leaders so far in 2014, and in fact they are the only sectors in positive territory, with both up about +2%. However, Technology has held up reasonably well, too, only down about -1%. Leading the latest rebound has been Consumer Discretionary and Industrial, followed by Financial and Basic Materials.
SPY chart review:
The SPDR S&P 500 Trust (SPY) closed Friday at 179.68, which is just below the psychological threshold of 180 (corresponding with 1800 on the S&P 500). I have redrawn the boundaries of the rising bullish channel to correspond with the lows of the past 12 months, and from this viewpoint, the market made a bullish reversal intraday on Wednesday by bouncing from the uptrend line, followed by two very strong days on Thursday-Friday (in spite of the lackluster jobs report). On the other hand, if I draw a similar uptrend line under the lows for the Russell 2000 small caps, the recent selloff created a definitive failure of the uptrend line, which is admittedly worrisome.
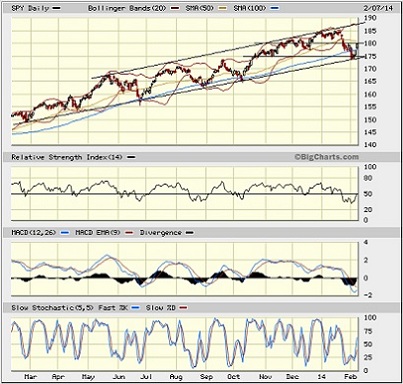
Although support at the 100-day simple moving average failed after briefly holding during the prior week, the 200-day (near 171) was not challenged. Oscillators RSI, MACD, and Slow Stochastic are all bouncing nicely from deeply oversold territory. However, as the bounce brings price back up near its 50-day SMA and the 180 level, the market will have reached a crossroads that will likely culminate in either a bullish breakout or a bearish reversal back down to test the 200-day SMA and perhaps an even deeper correction. But even in the bearish case, I expect the market will eventually make its way higher.
On Friday, the CBOE Market Volatility Index (VIX), a.k.a. “fear gauge,” closed at 15.29 after briefly spiking above 21 during the market turbulence last Monday, and may be ready to challenge the 15 threshold to the downside, which would be bullish for stocks. The mid-21s marked previous VIX highs (and market recovery) last June and October. Furthermore, the difference between the cash VIX and front-month (February) VIX futures displayed “backwardation” last week (rather than the typical “contango”), meaning that the cash VIX traded above front-month VIX futures. This unusual occurrence typically denotes a measure of panic as traders protect their portfolios, and such signs of panic almost always precede a market bounce.
Latest rankings:
Relative rankings are based on Sabrient’s proprietary SectorCast model, which builds a composite profile of each equity ETF based on bottom-up aggregate scoring of the constituent stocks. The “Outlook Score” employs a forward-looking, fundamentals-based multifactor algorithm considering forward valuation, historical and projected earnings growth, the dynamics of Wall Street analysts’ consensus earnings estimates and recent revisions (up or down), quality and sustainability of reported earnings (forensic accounting score), and various return ratios. It helps us predict relative performance over the next 1-3 months.
In addition, SectorCast computes Sabrient's Bull Score and Bear Score for each ETF based on recent price behavior of the constituent stocks on particularly strong and weak market days. High Bull score indicates that stocks within the ETF have tended recently toward relative outperformance when the market is strong, while a high Bear score indicates that stocks within the ETF have tended to hold up relatively well (“safe havens”) when the market is weak.
Outlook Score is forward-looking while Bull and Bear are backward-looking. As a group, these three scores can be helpful for positioning a portfolio for a given set of anticipated market conditions. Of course, each ETF holds a unique portfolio of stocks and position weights, so the sectors represented will score differently depending upon which set of ETFs is used. For Sector Detector, I use the iShares that represent the ten major U.S. business sectors: Financial, Technology, Industrial, Healthcare, Consumer Goods, Consumer Services, Energy, Basic Materials, Telecom, and Utilities. Whereas the Select Sector SPDRs only contain stocks from the S&P 500, I prefer the iShares for their larger universe and broader diversity. Fidelity also offers a group of sector ETFs with an even larger number of constituents in each.
Here are some of my observations on this week’s scores:
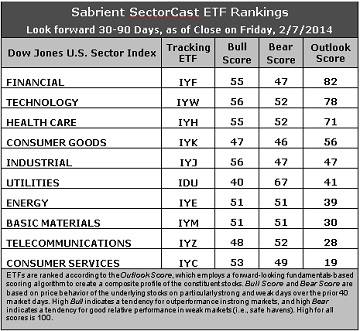
1. Financial (IYF) retains the top spot with an Outlook score of 82, while Technology (IYW) scores 78 to stay in second place. The Financial sector displays one of the lowest forward P/Es and reasonably good sentiment among both Wall Street analysts (net revisions to earnings estimates) and company insiders (buying activity). Technology still displays strong factor scores across the board, with a relatively low forward P/E, a strong forward long-term growth rate, the best return ratios, and excellent sentiment among both sell-side analysts and company insiders. In third place again this week is Healthcare (IYH), whose score continues to rise, now sitting at 71. Technology and Healthcare are now the only two displaying net positive sell-side revisions. Rounding out the top five are Consumer Goods (IYK) and Industrial (IYJ).
2. Consumer Services (IYC) is now firmly planted in the bottom spot, as Telecom (IYC) has gained even more support from Wall Street. Consumer Services, a.k.a., consumer cyclicals or consumer discretionary, continues to boast the best forward long-term growth rate, but this is more than offset by weakening sentiment among both Wall Street analysts (negative revisions to earnings estimates) and company insiders (low buying activity). Telecom scores among the lowest on most of the factors in the model, including the highest (worst) forward P/E, lowest return ratios, and a low projected long-term growth rate, but sentiment among sell-side analysts continues to improve, which has boosted the sector from the bottom of the rankings. Notably, Energy (IYE) and Materials (IYM) are getting hammered worse than ever by sell-side reductions to earnings estimates.
3. Although these fundamentals-based rankings still reflect a mostly bullish bias, with economically-sensitive sectors at the top, the weakening Outlook scores in Basic Materials (IYM) and Consumer Services are a concern.
4. Looking at the Bull scores, Industrial and Technology have been the leaders on strong market days, scoring 56, while Utilities (IDU) is by far the laggard with a score of 40. The top-bottom spread has expanded further to 16 points, reflecting progressively lower sector correlations on particularly strong market days.
5. Looking at the Bear scores, Utilities continues to display an increasing score, this week scoring 67, which indicates that it has been holding up the best (“safe haven”) on recent weak market days. As a traditionally defensive sector during a weak market period, this makes perfect sense. However, Consumer Good, which is another traditionally defensive sector, actually scores the lowest this week at 46, which is surprising. The top-bottom spread widened even more this week to 21 points, which reflects a continued trend towards lower sector correlations on weak market days.
6. Overall, Technology now holds a slim lead with the best all-weather combination of Outlook/Bull/Bear scores, while Consumer Services is the worst. Looking at just the Bull/Bear combination, Technology holds the lead, indicating excellent relative performance in extreme market conditions (whether bullish or bearish), while Consumer Goods scores by far the lowest, indicating investor avoidance (relatively speaking) during extreme conditions.
These Outlook scores represent the view once again that Financial and Technology sectors are still relatively undervalued, while Telecom and Consumer Services may be relatively overvalued based on our 1-3 month forward look.
Stock and ETF Ideas:
Our Sector Rotation Model, which appropriately weights Outlook, Bull, and Bear scores in accordance with the overall market’s prevailing trend (bullish, neutral, or bearish), suggests holding Financial (IYF), Technology (IYW), and Healthcare (IYH) in the current neutral climate. (The trend moved to neutral when the SPY moved down to between the 50 and 200-day simple moving averages.)
Other ETFs highly-ranked by Sabrient from the Financial, Technology, and Healthcare sectors include the First Trust NASDAQ ABA Community Bank Index Fund (QABA), the PowerShares Dynamic Semiconductors Portfolio (PSI), and the Market Vectors Pharmaceutical ETF (PPH).
For an “enhanced” sector portfolio that employs top-ranked stocks (or options) from within the top-ranked sectors (instead of ETFs), some long ideas from Financial, Technology, and Healthcare sectors include PartnerRe (PRE), Signature Bank (SBNY), F5 Networks (FFIV), WorkDay Inc (WDAY), Biogen Idec (BIIB), and McKesson Corp (MCK), all of which are ranked highly in the Sabrient Ratings Algorithm.
Disclosure: Author has no positions in stocks or ETFs mentioned.
Disclaimer: This newsletter is published solely for informational purposes and is not to be construed as advice or a recommendation to specific individuals. Individuals should take into account their personal financial circumstances in acting on any rankings or stock selections provided by Sabrient. Sabrient makes no representations that the techniques used in its rankings or selections will result in or guarantee profits in trading. Trading involves risk, including possible loss of principal and other losses, and past performance is no indication of future results.