Sector Detector: Summer slog likely to keep a lid on further stock gains
Stock investors entered the Fourth of July holiday on a high note, pushing the Dow Jones Industrials Index above 17,000 and the Wilshire 5000 Total Market Index above 21,000, and even pushing the S&P 500 to a smidge above the upper trend line of its long-standing bullish ascending channel that has been in place for nearly three years. However, with the Independence Day cheer behind us, persistently overbought technical conditions, and two months of summer doldrums ahead until the Labor Day holiday, I don’t think stocks are likely to muster much in the way of further progress over the near term. This may give bears a chance to make their long-stymied move. Although bulls should be able to maintain the upper hand in the longer term, I expect bears will finally have their window of opportunity to drive prices down (at least a little) before summer is over.
Last week I reported that among the ten U.S. business sectors, defensive and income-oriented Utilities displayed the best first-half performance. But last week was harsh on Utilities, allowing Energy to become the new leader, while Utilities fell into a virtual dead-heat with Healthcare and Technology for second place. Basic Materials also has shown good strength of late. This recent action might suggest some early signs of positioning for rising inflation and interest rates on the horizon.
Although the 10-year Treasury bond continues to remain strong with a low yield of 2.66%, this is actually a bit of a spike from the prior week’s close of 2.53%. Nevertheless, some top bond fund managers are still predicting that the 10-year yield could fall as low as 2.2% this year.
While the CPI is showing no signs of inflation, there’s no doubt that healthcare and housing costs are rising. But with the labor force participation rate on a downtrend and capacity utilization still relatively low, wage pressures and GDP will gradually rise. As a result, assuming the Fed starts raising interest rates by the end of next year, some (like Guggenheim Partners) are predicting 10-year Treasury yields to approach 4% over the next few years. Much of this capital should rotate into equities.
The CBOE Market Volatility Index (VIX), a.k.a. fear gauge, continues on its slow trek toward the depths of single digits, closing the short week on Thursday at 10.32. While some observers have been predicting single digits for the VIX, others expect an imminent reversion to the mean, perhaps all the way up to test resistance at 15. But short of a major black swan event, catalysts for such a volatility spike seem scarce.
Indeed, investor sentiment is definitely not overly bullish, which means from a contrarian basis that there is plenty of fuel available to fill the tank. For example, there has been three straight months of outflows from U.S. equity funds. Also, short interest in S&P 500 stocks has been rising, trading volume is moribund, and individual investor participation remains low.
Furthermore, corporate stock buybacks continue in earnest, and with persistently low interest rates and wage inflation, central banks can continue their liquidity programs without constraint. This means that equity prices and P/E multiples still have plenty of room to the upside.
Economists are expecting strong economic growth in the second half of 2014. Sell-side analysts are anticipating record earnings per share for both the second quarter and the calendar year. Companies in the S&P 500 are estimated to achieve 7.1% EPS growth compared with last quarter’s actual of 3.4%. However, top-line revenues are only projected to grow at 2.6%, indicating cost-cutting and productivity gains as the key drivers. At some point, revenues will have to become the driver for earnings growth. Notably, all ten business sectors are expected to report positive growth.
SPY chart review:
The SPDR S&P 500 Trust (SPY) closed the short week on Thursday at 198.20. The upper line of the long-standing bullish rising channel has been extremely tough resistance, but on Thursday SPY showed some desire to want to break through during the low-volume, holiday-shortened week. However, even if it succeeds this week, I believe the writing is on the wall for a failed breakout and a cycle back down to test the 50-day simple moving average and the lower Bollinger Band as we slog through the summer doldrums. Oscillators RSI, MACD, and Slow Stochastic are all acting fatigued at these heights and wanting to cycle back down. A successful test of the 50-day SMA (around 192 or so) would be healthy for bullish conviction by attracting fresh capital to make a new run at the 200 level, which is both psychologically attractive and ominous. Now that would be a test of resistance that I would really like to see.
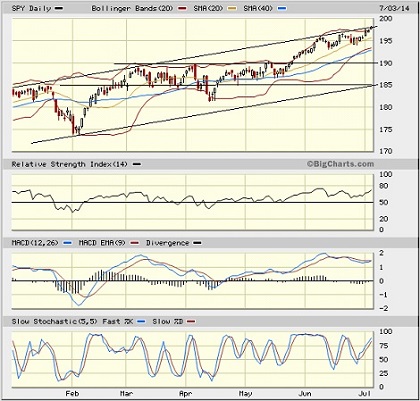
By the way, the Russell 2000 small cap index has rallied from a May double-bottom formation back above the 1200 level, but now might be forming a bearish double-top formation.
Latest sector rankings:
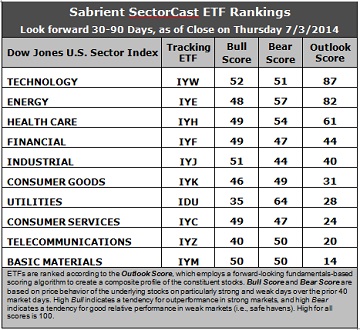
Relative sector rankings are based on our proprietary SectorCast model, which builds a composite profile of each equity ETF based on bottom-up aggregate scoring of the constituent stocks. The Outlook Score employs a forward-looking, fundamentals-based multifactor algorithm considering forward valuation, historical and projected earnings growth, the dynamics of Wall Street analysts’ consensus earnings estimates and recent revisions (up or down), quality and sustainability of reported earnings (forensic accounting), and various return ratios. It helps us predict relative performance over the next 1-3 months.
In addition, SectorCast computes a Bull Score and Bear Score for each ETF based on recent price behavior of the constituent stocks on particularly strong and weak market days. High Bull score indicates that stocks within the ETF recently have tended toward relative outperformance when the market is strong, while a high Bear score indicates that stocks within the ETF have tended to hold up relatively well (i.e., safe havens) when the market is weak.
Outlook score is forward-looking while Bull and Bear are backward-looking. As a group, these three scores can be helpful for positioning a portfolio for a given set of anticipated market conditions. Of course, each ETF holds a unique portfolio of stocks and position weights, so the sectors represented will score differently depending upon which set of ETFs is used. We use the iShares that represent the ten major U.S. business sectors: Financial (IYF), Technology (IYW), Industrial (IYJ), Healthcare (IYH), Consumer Goods (IYK), Consumer Services (IYC), Energy (IYE), Basic Materials (IYM), Telecommunications (IYZ), and Utilities (IDU). Whereas the Select Sector SPDRs only contain stocks from the S&P 500, I prefer the iShares for their larger universe and broader diversity. Fidelity also offers a group of sector ETFs with an even larger number of constituents in each.
Here are some of my observations on this week’s scores:
1. Technology remains in first place with a strong Outlook score of 87, although Energy is catching up fast at 82. Technology continues to display generally solid factor scores across the board, with a strong forward long-term growth rate, a reasonable forward P/E, the highest return ratios, and good sentiment among Wall Street analysts (upward revisions to earnings estimates). Energy displays the most upward revisions from Wall Street, the second lowest forward P/E, and the strongest insider sentiment (open market buying) this week. Healthcare takes third place, scoring 61, with solid sell-side sentiment and a strong forward long-term growth rate, while Financial and Industrial round out the top five. However, Financial and Industrial are both scoring well below the 50 mid-point, so only three sectors are scoring above mid-point, which is concerning. Notably, Utilities continues to fall, as well.
2. Basic Materials is in the cellar this week with an Outlook score of 14, as it displays the worst sentiment among both Wall Street analysts (downward revisions to earnings estimates) and insiders (open market selling). Telecommunications takes a rare trip out of the bottom spot but remains in the bottom two with a score of 20.
3. Looking at the Bull scores, Technology is the leader with a relatively low score of 52, followed by Industrial at 51, while Utilities is the clear laggard at 35. The top-bottom spread is 17 points, reflecting lower sector correlations on particularly strong market days. It is generally desirable in a healthy market to see a top-bottom spread of at least 20 points, which indicates that investors have clear preferences in the stocks they want to hold, rather than the all-boats-lifted-in-a-rising-tide mentality that dominated 2013.
4. Looking at the Bear scores, Utilities is the clear leader with a 64, which means that stocks within this sector have been the preferred safe havens on weak market days. Industrial displays the lowest score of 44. The top-bottom spread is up to 20 points, reflecting lower sector correlations on particularly weak market days. Again, it is generally desirable in a healthy market to see a top-bottom spread of at least 20 points, so this is promising.
5. Technology displays the best all-weather combination of Outlook/Bull/Bear scores, while Telecom is the worst. Looking at just the Bull/Bear combination, Energy is the leader, indicating superior relative performance (on average) in extreme market conditions (whether bullish or bearish). Telecom scores the lowest, indicating general investor avoidance during extreme conditions.
6. Overall, this week’s fundamentals-based Outlook rankings still look neutral. On the one hand, economically-sensitive sectors Technology, Financial, and Industrial are all in the top five, while defensive sector Utilities continues to fall. But on the other hand, only three of the ten sectors hold an Outlook score above 50, and none of sectors are displaying very high Bull scores.
These Outlook scores represent the view that the Technology and Energy sectors are relatively undervalued, while Basic Materials and Telecom may be relatively overvalued based on our 1-3 month forward look.
Stock and ETF Ideas:
Our Sector Rotation model, which appropriately weights Outlook, Bull, and Bear scores in accordance with the overall market’s prevailing trend (bullish, neutral, or bearish), suggests continuing to hold Technology, Energy, and Healthcare (in that order) in the prevailing bullish climate. (Note: In this model, we consider the bias to be bullish from a rules-based standpoint because SPY is still above its 50-day simple moving average while also remaining above its 200-day SMA.)
Other highly-ranked ETFs from the Technology, Energy, and Healthcare sectors include First Trust NASDAQ Technology Dividend Index Fund (TDIV), PowerShares Dynamic Energy E&P Portfolio (PXE), and ProShares Ultra Health Care (RXL).
For an enhanced sector portfolio that enlists top-ranked stocks (instead of ETFs) from within Technology, Energy, and Healthcare, some long ideas include Skyworks Solutions (SWKS), OmniVision Technologies (OVTI), Valero Energy (VLO), EOG Resources EOG), McKesson Corp (MCK), and Questcor Pharmaceuticals (QCOR). All are highly ranked in the Sabrient Ratings Algorithm and also score in the top two quintiles (lowest accounting-related risk) of our Earnings Quality Rank (EQR), a pure accounting-based risk assessment signal based on the forensic accounting expertise of our subsidiary Gradient Analytics. We have found it quite valuable for helping to avoid performance-offsetting meltdowns in our model portfolios.
If you are more comfortable with a neutral bias, the model still suggests holding Technology, Energy, and Healthcare (in that order). But if you have a bearish outlook on the market, the model suggests holding Energy, Utilities, and Technology (in that order).
Disclosure: Author has no positions in stocks or ETFs mentioned.
Disclaimer: This newsletter is published solely for informational purposes and is not to be construed as advice or a recommendation to specific individuals. Individuals should take into account their personal financial circumstances in acting on any rankings or stock selections provided by Sabrient. Sabrient makes no representations that the techniques used in its rankings or selections will result in or guarantee profits in trading. Trading involves risk, including possible loss of principal and other losses, and past performance is no indication of future results.