Sector Detector: Volatility continues as earnings reports create excitement and despair
Volatility reigned in January on elevated volume as stock investors shifted their focus from global events to U.S. earnings reports, which have ranged from amazing (e.g., Apple) to crushing (e.g., Microsoft). Although the earnings reports have brought plenty of surprises, the volatility is no surprise, as I and many other market commentators predicted for the New Year. Still, although the road may be bumpier than the past couple of years, the path of least resistance appears to be up, and the main question is whether small caps and emerging markets will make an attempt to regain past glories or if U.S. large caps must continue to carry the load.
In this weekly update, I give my view of the current market environment, offer a technical analysis of the S&P 500 chart, review our weekly fundamentals-based SectorCast rankings of the ten U.S. business sectors, and then offer up some actionable trading ideas, including a sector rotation strategy using ETFs and an enhanced version using top-ranked stocks from the top-ranked sectors.
Market overview:
The Wall Street Journal reported that the S&P 500 experienced average daily swings of 1.5% during January. If it continues, it would make 2015 the most volatile year since 2011 when the Eurozone crisis hit. Last year, the S&P dropped more than -3.5% in January. This year, the S&P 500 closed the month down -3.1% while German equities closed up +7.2% and the iShares MSCI EAFE Index Fund (EFA) was up +2.2%. It’s pretty evident that this will not be a risk-on, all-boats-lifted kind of year.
After a streak of eight consecutive quarters of earnings growth, the estimates are indicating that the streak may be ending soon. According to FactSet, Wall Street was expecting +4% earnings growth in the S&P 500, but after a rash of downward revisions, overall growth (or lack thereof) is estimated at -2%, with the most optimistic earnings estimates for 2015 have fallen from around $133 average per share to nearly $125, which of course is driven mostly by the pratfall of the Energy sector, falling from a Q1 2015 estimate of +3.3% from several months ago to a current estimate of -53.8%. Harsh.
Already, earnings season has shown major stumbles in names like Caterpillar (CAT), Ford (F), Procter & Gamble (PG), and Microsoft (MSFT). But on the other hand, we saw strong reports and nice upside moves in names like Google (GOOGL), Apple (AAPL), Amazon.com (AMZN), Boeing (BA), Visa (V), and D.R. Horton (DHI).
Volatility has increased across all assets. The CBOE Market Volatility Index (VIX), a.k.a. fear gauge, closed Friday at 20.97, which is back above the important 20 threshold that suggests real fear, but still above the 30 level that indicates panic. Asset correlations are relatively high across the board, as well. As expected, the new reality is that while VIX averaged around 14 in 2014, it closed above 15 every day in January and averaged above 19.
Some people are saying that now is time for a reversion-to-the-mean in emerging markets and Europe, even though they admit that the U.S. economy is in the best condition of any economy in the world. It’s kind of like a Dogs of the Dow strategy in which buying the underperforming companies tends to outperform, and they see more upside opportunity in Europe, China, and India (i.e., “Dogs of the World”). Given that Fed quant easing has ended while Europe’s has just begun, U.S. corporate profit margins appear to be at a peak and destined to fall, and the strong dollar is hurting U.S. earnings. Furthermore, the argument goes that QE in Europe will withdraw duration from their market as yields are driven lower, and so asset prices will rise -- particularly equities, which are of course a long-duration asset by definition.
However, the news is still quite good here, on balance. For example, the Conference Board’s Consumer Confidence Index surged to 102.9, which is its highest reading since August 2007. Despite the official end of QE and the plan to start on the path of normalizing the fed funds rate sometime later this year, the Federal Reserve continues to run an expansionary monetary policy. Commercial and industrial loans are up significantly from the same time last year and are displaying the strongest growth since 2008. So, I still think that the “dumb trade” (a.k.a, “The Trend is Your Friend”) is likely the better bet for 2015, i.e., U.S. equities -- particularly large caps.
I am back in the office now after 12 straight nights on the road, supporting the sales effort for our Baker’s Dozen portfolio, as packaged by First Trust Portfolios in a unit investment trust. It has been a total pleasure meeting the many financial advisors who have embraced our “quantamental” GARP process (growth at a reasonable price) with a forensic accounting “backstop” to help us avoid the landmines. Many investment professionals also have signed up for our web-based suite of research products. In fact, I always employ the ETF Summaries section of the product suite when writing this weekly article to identify highly ranked stocks from the strongest sector ETFs when providing stock ideas for an enhanced sector rotation strategy (see below).
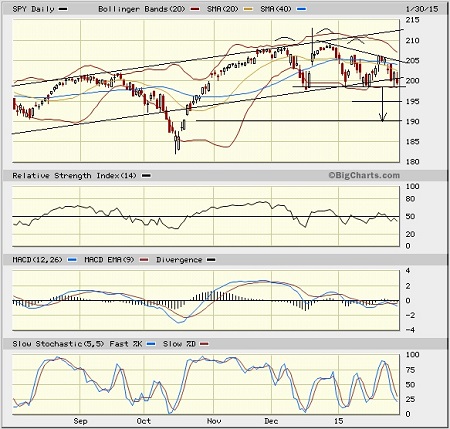
SPY chart review:
The SPDR S&P 500 Trust (SPY) closed last Friday at 199.45. After closing the prior Friday perched on precarious support at its 50-day simple moving average (which as flat-lined at 205), it struggled last Monday to hold support but ultimately failed miserably. On Friday it closed bearishly slightly below the 100-day SMA and is testing support from the lower trend line of the long-standing bullish rising channel and round-number support at 200. The 20-day has crossed down bearishly through the 40- and 50-day SMAs. Oscillators RSI and MACD are still stuck in neutral territory but Slow Stochastic has again cycled back down from overbought to oversold. The bearish head-and-shoulders pattern with a head around 209 and a neckline at the lower uptrend line is possibly still in play, and it would indicate downside risk to the prior price gap at 190. However, a neutral symmetrical triangle might be forming as shown, which is usually a continuation pattern (i.e., bullish). So, there are many conflicting signals. Price currently sits near a lot of converging support levels, including the 100-day SMA, the long-standing lower uptrend line, and round-number support at 200. The important 200-day SMA near is approaching 198. Below that is a possible level of prior support at 195, followed by the prior price gap at 190. If price can rally, the charts reflect a number of new overhead resistance levels (including the top of the symmetrical triangle) that will make things even more difficult for the bulls to resume their upward march.
Latest sector rankings:
Relative sector rankings are based on our proprietary SectorCast model, which builds a composite profile of each equity ETF based on bottom-up aggregate scoring of the constituent stocks. The Outlook Score employs a forward-looking, fundamentals-based multifactor algorithm considering forward valuation, historical and projected earnings growth, the dynamics of Wall Street analysts’ consensus earnings estimates and recent revisions (up or down), quality and sustainability of reported earnings (forensic accounting), and various return ratios. It helps us predict relative performance over the next 1-3 months.
In addition, SectorCast computes a Bull Score and Bear Score for each ETF based on recent price behavior of the constituent stocks on particularly strong and weak market days. High Bull score indicates that stocks within the ETF recently have tended toward relative outperformance when the market is strong, while a high Bear score indicates that stocks within the ETF have tended to hold up relatively well (i.e., safe havens) when the market is weak.
Outlook score is forward-looking while Bull and Bear are backward-looking. As a group, these three scores can be helpful for positioning a portfolio for a given set of anticipated market conditions. Of course, each ETF holds a unique portfolio of stocks and position weights, so the sectors represented will score differently depending upon which set of ETFs is used. We use the iShares that represent the ten major U.S. business sectors: Financial (IYF), Technology (IYW), Industrial (IYJ), Healthcare (IYH), Consumer Goods (IYK), Consumer Services (IYC), Energy (IYE), Basic Materials (IYM), Telecommunications (IYZ), and Utilities (IDU). Whereas the Select Sector SPDRs only contain stocks from the S&P 500, I prefer the iShares for their larger universe and broader diversity. Fidelity also offers a group of sector ETFs with an even larger number of constituents in each.
ETF, sectors, iShares, volatility, S&P 500, SectorCast, safe haven, Technology, Healthcare, Financial, Utilities, Consumer Discretionary
Here are some of my observations on this week’s scores:
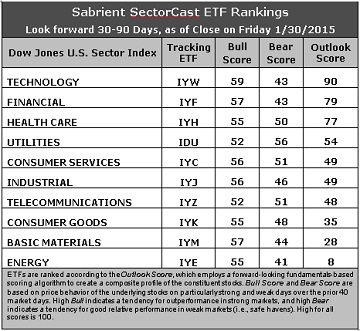
1. The most notable observation is the acceleration in downward revisions to forward earnings estimates by Wall Street sell-side research analysts. Hardest hit (in order) were Energy, Basic Materials, Consumer Goods/Staples, Industrial, and Financial. We are seeing a three-tier ranking. At the top, Technology continues to rank first with an Outlook score of 90. It displays the best return ratios, a good forward long-term growth rate and forward P/E, and relatively good sell-side analyst sentiment (i.e., not as bad as most of the other sectors in downward revisions to earnings estimates). Financial moves into second place with a score of 79, jumping slightly ahead of Healthcare’s 77. Financial displays the lowest (best) forward P/E and the second best (after Consumer Services) insider sentiment (buying activity). The next tier includes defensive sector Utilities, Consumer Services/Discretionary, Industrial, and Telecommunications, whose scores are all bunched around 50. And at the bottom we see Consumer Goods/Staples, Basic Materials, and Energy.
2. It is no surprise that Energy continues to hold the bottom spot given the plunge in oil prices. Wall Street has resumed its assault on earnings projections, and the Outlook score for Energy is an anemic 8. Joining Energy in the bottom two again is Basic Materials, as these two sectors continue to endure Wall Street’s downward revisions to forward earnings estimates. Energy also shows the worst forward long-term growth rate, the highest (worst) forward P/E (despite the huge drop already in share prices), and the worst insider sentiment.
3. Looking at the Bull scores, Technology now displays the top score of 59, followed by Financial and Materials. Utilities and Telecom score the lowest at 52. The top-bottom spread is only 7 points, which is quite low and reflects extremely high sector correlations during particularly strong market days, i.e., highly-correlated risk-on action. It is generally desirable in a healthy market to see low correlations and a top-bottom spread of at least 20 points, which indicates that investors have clear preferences in the stocks they want to hold going forward.
4. Looking at the Bear scores, Utilities displays the highest score of 56 this week, which means that stocks within this sector have been the preferred safe havens on weak market days, although not so clearly preferred as in the past. Energy again has the lowest score of 41. The top-bottom spread is 15 points, reflecting relatively low sector correlations on particularly weak market days. In other words, certain sectors are holding up relatively well while others are selling off. Again, it is generally desirable in a healthy market to see low correlations and a top-bottom spread of at least 20 points.
5. Technology displays the best all-around combination of Outlook/Bull/Bear scores, followed by Healthcare, while Energy is clearly the worst. Looking at just the Bull/Bear combination, Utilities is the leader, followed by Healthcare, indicating superior relative performance (on average) in extreme market conditions (whether bullish or bearish). Energy is the worst, indicating general investor avoidance, which is no surprise.
6. Overall, this week’s fundamentals-based Outlook rankings still look generally bullish to me, although less so than last week, as market sentiment has taken a cautionary tone. Nevertheless, 5 of the top 6 sectors are economically-sensitive and growth-oriented (or in the case of Healthcare, all-weather), with the exception of Utilities. Cautious optimism remains the prevailing mood. Keep in mind, the Outlook Rank does not include timing or momentum factors, but rather is a reflection of the fundamental expectations of individual stocks aggregated by sector.
Stock and ETF Ideas:
Our Sector Rotation model, which appropriately weights Outlook, Bull, and Bear scores in accordance with the overall market’s prevailing trend (bullish, neutral, or defensive), is sticking with a neutral bias, and the model suggests holding Technology, Financial, and Healthcare, in that order. (Note: In this model, we consider the bias to be neutral from a rules-based trend-following standpoint when SPY is between its 50-day and 200-day simple moving averages.)
Other highly-ranked ETFs from the Technology, Financial, and Healthcare sectors include Market Vectors Semiconductor ETF (SMH), PowerShares KBW High Dividend Yield Financial Portfolio (KBWD), and iShares NASDAQ Biotechnology ETF (IBB).
For an enhanced sector portfolio that enlists some top-ranked stocks (instead of ETFs) from within the top-ranked sectors, some long ideas from Technology, Financial, and Healthcare sectors include Cavium (CAVM), Gartner (IT), Sun Communities (SUI), Starwood Property Trust (STWD), Shire plc (SHPG), and Biogen Idec (BIIB). All are highly ranked in the Sabrient Ratings Algorithm and also score within the top two quintiles (lowest accounting-related risk) of our Earnings Quality Rank (a.k.a., EQR), a pure accounting-based risk assessment signal based on the forensic accounting expertise of our subsidiary Gradient Analytics. We have found EQR quite valuable for helping to avoid performance-offsetting meltdowns in our model portfolios.
However, if you prefer to maintain a bullish bias, the Sector Rotation model suggests holding Technology, Financial, and Healthcare, in that order. And if you prefer a defensive stance on the market, the model suggests holding Utilities, Healthcare, and Consumer Services/Discretionary, in that order (although Telecommunications is in a virtual tie with Consumer Services/Discretionary).
IMPORTANT NOTE: I post this information each week as a free look inside some of our institutional research and as a source of some trading ideas for your own further investigation. It is not intended to be traded directly as a rules-based strategy in a real money portfolio. I am simply showing what a sector rotation model might suggest if a given portfolio was due for a rebalance, and I may or may not update the information each week. There are many ways for a client to trade such a strategy, including monthly or quarterly rebalancing, perhaps with interim adjustments to the bullish/neutral/defensive bias when warranted -- but not necessarily on the days that I happen to post this weekly article. The enhanced strategy seeks higher returns by employing individual stocks (or stock options) that are also highly ranked, but this introduces greater risks and volatility. I do not track performance of the ETF and stock ideas mentioned here as a managed portfolio.
Disclosure: Author has no positions in stocks or ETFs mentioned.
Disclaimer: This newsletter is published solely for informational purposes and is not to be construed as advice or a recommendation to specific individuals. Individuals should take into account their personal financial circumstances in acting on any rankings or stock selections provided by Sabrient. Sabrient makes no representations that the techniques used in its rankings or selections will result in or guarantee profits in trading. Trading involves risk, including possible loss of principal and other losses, and past performance is no indication of future results.