Sector Detector: Anticipating a robust Q2 earnings season – and launch of Q3 2021 Baker’s Dozen
 by Scott Martindale
President & CEO, Sabrient Systems LLC
As earnings season gets going, I believe we will see impressive reports reflecting stunning YOY growth in both top and bottom lines. According to Bloomberg, sell-side analysts' consensus YOY EPS growth estimate for the S&P 500 is north of 63% for Q2, 36% for full-year 2021, and 12% for 2022. But I still consider this to be somewhat conservative, with plenty of upside surprises likely. However, the market’s reaction to each earnings release will be more predicated on forward guidance, as investors are always forward-looking. To me, this is the bigger risk, but I am optimistic. Today’s lofty valuations are pricing in the expectation of both current “beats” and raised guidance, so as the speculative phase of the recovery moves into a more rational expansionary phase, I expect some multiple contraction such that further share price appreciation will depend upon companies “growing into” their valuations rather than through further multiple expansion, i.e., the earnings growth rate (through revenue growth, cost reduction, and rising productivity) will need to outpace the share price growth rate.
Despite the lofty valuations, investors seem to be betting on another blow-out quarter for earnings reports, along with increased forward guidance. On a technical basis, the market seems to be extended, with unfilled “gaps” on the chart. But while small caps, value stocks, cyclical sectors, and equal-weight indexes have pulled back significantly and consolidated gains since early June, the major indexes like S&P 500 and Nasdaq that are dominated by the mega caps haven’t wanted to correct very much. This appears to reinforce the notion that investors today see these juggernaut companies as defensive “safe havens.” So, while “reflation trade” market segments and the broader market in general have taken a 6-week risk-off breather from their torrid run and pulled back, Treasuries have caught a bid and the cap-weighted indexes have hit new highs as the big secular-growth mega-caps have been treated as a place to park money for relatively safe returns.
It also should be noted that the stock market has gone quite a long time without a significant correction, and I think such a correction could be in the cards at some point soon, perhaps to as low as 4,000 on the S&P 500, where there are some unfilled bullish gaps (at 4,020 and 3,973). However, if it happens, I would look at it as a long-term buying opportunity – and perhaps mark official transition to a stock-picker’s market.
The past several years created historic divergences in Value/Growth and Small/Large performance ratios with narrow market leadership. But after a COVID-selloff recovery rally, fueled by a $13.5 trillion increase in US household wealth in 2020 (compared to an $8.0 trillion decrease in 2008 during the Financial Crisis), that pushed abundant cheap capital into speculative market segments, SPACs, altcoins, NFTs, meme stocks, and other high-risk investments (or “mal-investments”), it appears that the divergences are converging, leadership is broadening, and Quality is ready for a comeback. A scary correction might be just the catalyst for the Quality factor to reassert itself. It also should allow for active selection, strategic beta, and equal weighting to thrive once again over the passive, cap-weighted indexes, which also would favor the cyclical sectors (Financial, Industrial, Materials, Energy) and high-quality dividend payers (e.g., “Dividend Aristocrats”). But I wouldn’t dismiss secular-growth Technology names that still sport relatively attractive valuations (Note: the new Q3 2021 Baker’s Dozen includes four such names).
In this periodic update, I provide a comprehensive market commentary, offer my technical analysis of the S&P 500 chart, review Sabrient’s latest fundamentals based SectorCast quant rankings of the ten US business sectors, and serve up some actionable ETF trading ideas. To summarize, our sector rankings reflect a solidly bullish bias; the technicals picture has been strong for the cap-weighted major indexes but is looking like it is setting up for a significant (but buyable) correction; and our sector rotation model retains its bullish posture.
As a reminder, Sabrient’s newer portfolios – including Small Cap Growth, Dividend, Forward Looking Value (launched on 7/7/21), and the upcoming Q3 2021 Baker’s Dozen (launches on 7/20/21) – all reflect the process enhancements that we implemented in December 2019 in response to the unprecedented market distortions that created historic Value/Growth and Small/Large performance divergences. With a better balance between cyclical and secular growth and across market caps, most of our newer portfolios once again have shown solid performance relative to the benchmark (with some substantially outperforming) during quite a range of evolving market conditions. (Note: we post my latest presentation slide deck and Baker’s Dozen commentary on our public website.) Read on….
Commentary:
With reopening nearly complete and the recovery humming, the economic reports and forecasts have been stellar. Q1 GDP YOY growth was reconfirmed at an annualized rate of +6.4% by the BEA. The Conference Board’s estimate is +9.0% (annualized) for Q2 GDP and +6.6% YOY for full-year 2021. Meanwhile, the St. Louis Fed’s GDP Nowcast also expects +9.0% for Q2, and the Atlanta Fed’s GDPNow model predicts +7.5% (as of 7/16/20). Although this is down significantly from early May (when the Atlanta GDPNow was forecasting 13.6% for Q2), it is still quite a robust growth rate. Other encouraging data includes JPMorgan Chase’s newly released 2021 Business Leaders Outlook survey showing a record 88% of respondents are optimistic about the next six months, and a survey of small business by the NFIB reflects high levels of optimism as well.
First-quarter 2021 adjusted real Gross Output (GO) – which measures spending across all stages of economic production – rose +11.5% to a record $48.6 trillion. This is almost double the 6.4% GDP growth rate. GO can be considered the top-line number, with GDP the bottom-line number, and according to Mark Skousen (who conceived the GO metric), whenever GO grows substantially faster than GDP, it reflects a strong economic recovery and a bullish environment for stocks.
The 15.24% total return posted by the S&P 500 Index in the first half was its second-best showing since 1998. Q2 2021 was the fifth straight quarter that the market gained at least 5% – an achievement that has only happened once before – way back in 1953-1954. However, performance attribution during Q2 was quite different from Q1. Whereas Q1 was dominated by small caps, the Value factor, and strong market breadth, Q2 was more of a throwback period characterized by narrow leadership from Big Tech, with the dominant FAAAM stocks – Facebook, Amazon.com, Alphabet, Apple, Microsoft – all rising more than 10% during the quarter, which allowed Large Cap Growth to handily outperform Large Cap Value. However, Russell 2000 Value was still able to eke out a slight outperformance versus R2000 Growth for Q2. So, it would be a stretch to say that the resurgence in Small Cap Value has petered out; it was more of a retrenchment or consolidation. No doubt, the contraction in longer-term Treasury yields provided a tailwind to Large Cap Growth to the detriment of small caps, value stocks, cyclical sectors, and higher-dividend payers that have been leading the way since 11/1/2020.
The recent new highs on the major indexes have been driven by the mega caps. The Tech sector now has a 28% weighting in the S&P 500, and if you add back the big FANG stocks that were moved a few years ago to Consumer and Comm Services sectors, the number is closer to 38%.
With today’s 12-month forward P/E on the S&P 500 at around 21.2x, valuations remain historically frothy, which understandably makes many experienced investors and traders feel anxious. But in my view, lofty valuations generally reflect investor confidence in sustainable economic recovery and a supportive Federal Reserve. More specifically, this means: 1) low interest rates, with 10-year Treasury yield holding below 1.5% and corporate bond spreads remaining near all-time lows as inflation expectations appear to have plateaued and may be rolling over, and 2) rising corporate earnings expectations, as there has been a surge in positive guidance from the companies themselves. According to FactSet, a record number of companies have provided positive guidance for Q2, leading analysts to raise consensus earnings estimates by 6.7% versus their estimates 3 months ago such that the S&P 500 is now expected to achieve 63% aggregate YOY earnings growth and 20% revenue growth. However, DataTrek has opined that markets are pricing in more like 80-100% EPS growth, and in any case, revenue beats will matter more than earnings beats since the top-line better reflects the status of post-pandemic recovery.
According to S&P DJI, the top-performing sectors during Q2 were Real Estate, Information Technology, and Energy. Also, the top factor-based strategies for the S&P 500 during Q2 were Momentum, Growth, and Quality, although on a YTD basis, the top performers were High Beta, Enhanced Value, and Dividend Income. Moreover, Pure Growth topped the Q2 performance table while Pure Value was at the bottom, and 6-month correlations between the Growth and Value indices hit a record low. In addition, the Quality factor seems to be gaining traction, giving hope that the “dash for trash” or “junk rally” may have run its course. According to Tony DeSpirito, BlackRock CIO of U.S. fundamental equities, higher quality stocks were trading at their largest valuation discount to the broad market since the dot com bubble of the early 2000s.
With money being printed (aka QE or MMT), we have low (negative yielding) Treasuries, low market volatility, and junk bond yields at record lows, so investors have been enticed into chasing returns by buying equities, thus driving up valuations. BlackRock has stated, “Tactically we prefer to take risk in equities over credit amid low rates and tight spread.” This is classic TINA (i.e., there is no alternative). Moreover, the preponderance of algorithmic market-making means the computers tighten up on liquidity when volatility rises, which exacerbates selloffs. So, despite the apparent complacency, today’s lofty valuations would suggest investors should carry portfolio insurance of some sort (e.g., puts, inverse ETFs, stops). Nevertheless, I believe any significant correction should be looked upon as a longer-term buying opportunity.
Value/Growth and Small/Large convergence update:
The chart below illustrates various performance differentials since the value rotation began on 11/1/2020. You can see that the growth and large-cap oriented SPY, QQQ, and RPG continue to be bunched together at the bottom. However, since mid-February the broader small-cap index (IWM) has essentially gone sideways while small-cap value continues to surge higher. According to S&P Dow Jones Indices, most style factors posted gains during May, led by High Beta and most Value-oriented strategies, while Growth and Momentum both declined. Most sectors posted gains, led by Energy. The CBOE Volatility Index (VIX) closed the month at a relatively complacent 16.76 after spiking mid-month to nearly 29 following the latest CPI reading.
The 4½-year chart below compares Invesco S&P 600 Small Cap Pure Value (RZV) and Invesco S&P 500 Large Cap Pure Growth (RPG) to illustrate the stark divergence between both Growth/Value and Large/Small. Also shown is Invesco S&P 500 Equal Weight ETF (RSP) to illustrate the impact of rising/falling market breadth. After the initial “Trump Bump” in late-2016 that briefly boosted Value, Small caps, and Cyclical sectors, a stark market bifurcation ensued primarily due to trade wars, and then worsened from COVID and the economic lockdowns. RPG enjoyed a strong uptrend driven by mega-cap secular-growth Tech, while RZV was mired in a strong downtrend. However, as noted in the top chart and magnified on the bottom chart, since 11/1/20 there has been a strong rotation into Small caps, Value, and Cyclicals – i.e., convergence of the historic Growth/Value and Large/Small divergences. It actually began on 5/15/20, but really accelerated starting on 11/1/20. In addition, you can see that since mid-February the Equal Weight S&P 500 has outperformed Large Cap Growth, which indicates strong market breadth.
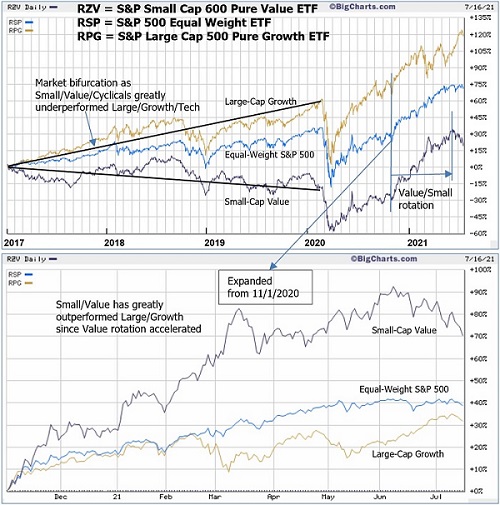
However, sharp eyes can’t help but notice that, starting in early June, Large Cap Growth has made a bit of a comeback, and the Equal Weight S&P 500 has flatlined while the cap-weighted version has hit new highs. This begs the question, have the Small/Value rotation and broadening market run out of steam? If inflation is indeed transitory, one might think so. But in my view, it simply reflects some technical consolidation and retrenchment after a big run for those long beaten-down market segments. Assuming reopening and global economic expansion continue, then I expect a renewed bid under Small/Value/Cyclicals, but not to the exclusion of attractively valued secular growth names.
In particular, I think the Energy sector is well-positioned to thrive in a climate of global growth and rising oil prices, especially when you consider its solid dividend yield, with the Energy Select Sector SPDR (XLE) paying nearly 4% after this past 6-week swoon, which is the highest yield of any sector. Notably, after spending most of the past few years at or near the bottom of Sabrient’s SectorCast ETF rankings, Energy has now risen to the third highest ranking of the 10 US sectors (as described in the Sector Rankings section below).
Inflation and interest rates:
The 10-year Treasury yield closed Friday right around 1.30%. As a reminder, it started the year just under 1.0%, and only three months later it hit 1.765%. But that’s as high as it got. It ranged between 1.5-1.7% during April and May, then fell below 1.5% in June and below 1.4% in July (to as low as 1.268%) and is now threatening to fall below 1.3%. Jeffrey Gundlach of DoubleLine Capital believes the buying of Treasuries is led by pension funds, foreign buyers, and other investors holding extreme levels of liquidity from QE for which they are seeking a safe yield at something marginally better than just holding cash. And BlackRock recently stated their “new nominal” investment theme, which calls for a “more muted response in interest rates to higher inflation than in the past.” No doubt, with global investors putting a bid under bonds and keeping nominal long term yields low and real yields negative, bond yields today have been less sensitive to inflationary signals.
Looking ahead, rates probably won’t fall much further, but I don’t expect they will suddenly lurch higher either. The Bloomberg consensus for the U.S. 10-Year Treasury Yield in 2022 is 2.2%, which I think might be on the high side but in any case, is still a manageable level for the economy and stocks. With federal debt now around $30 trillion, or about 135% of GDP, the Fed will be reluctant to raise rates (and debt financing costs). As long as the Fed is focused on maximizing employment, supporting economic growth, and containing the cost of financing high debt levels, it will maintain asset purchases and a low fed funds rate. And as long as interest rates are modest and investment capital abundant, stocks – including growth stocks – can do well. Again, it’s a classic set up for TINA.
In the early stages of an economic recovery, there are typically too many workers seeking too few jobs, but we find that the opposite is true today. Although Industrial Production and Capacity Utilization continue to rise, the manufacturing sector remains hindered not only by supply chain issues but also by a severe labor shortage. Job openings in manufacturing are near a record high; in fact, they are more than double the pre-pandemic levels, even though unemployment is still elevated at 5.9%. And Capacity Utilization is around 75% – well below the important 80% threshold that often presages worrisome inflation. Moreover, we continue to have all the many disinflationary structural factors at work like aging demographics, slowing global population growth, re-globalization of trade and supply chains, and of course the rapid pace of development of automation and new innovative/disruptive technologies that improve productivity in ways that are hard to fully foresee.
So, as supply chains adapt, bottlenecks are fixed, and workers return to the workplace, it seems that inflationary pressures will recede. Indeed, when you consider moribund gold prices, a low 10-year yield, and the strong US dollar, it appears that investors are not particularly concerned about recent inflationary signals. Michael Arone of SSGA opined that the annual Jackson Hole Economic Policy Symposium in late August is an opportunity for the Fed to signal any changes it has in store for monetary policy and the likely future path for interest rates and inflation.
Final comments:
Looking ahead, I expect the highly bullish combination of robust economic growth, strong earnings growth, modest inflation, and low interest rates to persist. However, investors should be more selective among the secular growth favorites that sport high P/E multiples as they now must justify their valuations with earnings growth rather than through further multiple expansion. That means meeting (and preferably exceeding) expectations and guiding estimates higher for the future. In fact, I think we will see some multiple contraction as earnings grow into valuations, but prices can still rise as long as earnings growth is faster than the rate of share price appreciation.
The Fed has been artificially depressing interest rates across the yield curve while simultaneously flooding the economy with liquidity. Current interest rates allow companies to refinance debt at ultra-low yields, bolster cash reserves, and boost share buybacks. Indeed, we find that S&P 500 companies are flush with cash and cash equivalents, totaling more than $2 trillion as of May. So, assuming a robust Q2 earnings season, this lends further support to my buying opportunity view of any near-term market correction.
In my view, a “Roaring ‘20s redux” from 100 years ago appears to be in motion, with a solid likelihood of a more modest inflationary climate than many are forecasting and an extended expansionary economic cycle. Thus, I continue to suggest that investors remain bullish and invested in both cyclical and secular growth equities but with a greater focus on quality as we move past the exuberant speculative recovery phase. Moreover, I expect fundamental active selection, strategic beta, and equal weighting will outperform the cap-weighted passive indexes that have been so hard to beat over the past few years. This should be favorable for Sabrient’s enhanced growth-at-a-reasonable-price (aka GARP) approach, which combines value, growth, and quality factors while seeking a balance between secular growth and cyclical/value stocks and across market caps.
Let me reiterate that I have been particularly excited about our new portfolios this year (including Baker’s Dozen, Forward Looking Value, Small Cap Growth, and Dividend Opportunity) because, whereas last year we were hopeful based on our testing that our enhanced portfolio selection process would provide better “all-weather” performance, over the course of the past year we have seen solid evidence (over quite a range of evolving market conditions) that it has indeed provided significantly improved performance relative to the benchmark. One exception is the terminating Q2 2020 Baker’s Dozen, but keep in mind it was selected in April 2020 when most companies had poor forward visibility (which our model depends upon).
SPY Chart Review:
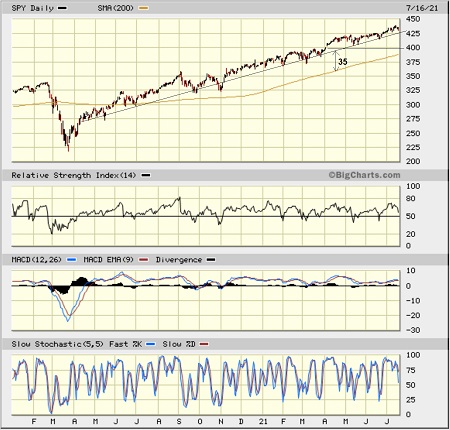
Looking at the chart of the SPDR S&P500 Trust (SPY) since the beginning of 2020, you can see that the pandemic selloff knifed straight down through the 200-day simple moving average (SMA), but after recovering above it and then retesting support at the end of June 2020, there hasn’t been another test of support at the 200-day since then. Indeed, the market essentially has gone straight up with only a handful of tests of the 50-day SMA, while the gap between the uptrend line and the 200-day has remained pretty constant during 2021 at around $35. As of Friday’s close of 431.34, the 200-day SMA is at 388, or about $43 lower. Given how long it has been without a significant correction, I think we might see one sometime over the next few months, perhaps to fill some unfilled bullish gaps at 400 and 396, which could coincide with a test of support from the rising 200-day SMA. Oscillators RSI, MACD, and Slow Stochastics are all pointing downward. However, if it does fall that far, I would see it as a long-term buying opportunity.
Latest Sector Rankings:
Relative sector rankings are based on our proprietary SectorCast model, which builds a composite profile of each of over 1,000 equity ETFs based on bottom-up aggregate scoring of the constituent stocks. The Outlook Score employs a forward-looking, fundamentals-based multifactor algorithm considering forward valuation, historical and projected earnings growth, the dynamics of Wall Street analysts’ consensus earnings estimates and recent revisions (up or down), quality and sustainability of reported earnings, and various return ratios. It helps us predict relative performance over the next 2-6 months.
In addition, SectorCast computes a Bull Score and Bear Score for each ETF based on recent price behavior of the constituent stocks on particularly strong and weak market days. A high Bull score indicates that stocks within the ETF recently have tended toward relative outperformance when the market is strong, while a high Bear score indicates that stocks within the ETF have tended to hold up relatively well (i.e., safe havens) when the market is weak.
Outlook score is forward-looking while Bull and Bear are backward-looking. As a group, these three scores can be helpful for positioning a portfolio for a given set of anticipated market conditions. Of course, each ETF holds a unique portfolio of stocks and position weights, so the sectors represented will score differently depending upon which set of ETFs is used. We use the iShares that represent the ten major U.S. business sectors: Financial (IYF), Technology (IYW), Industrial (IYJ), Healthcare (IYH), Consumer Goods (IYK), Consumer Services (IYC), Energy (IYE), Basic Materials (IYM), Telecommunications (IYZ), and Utilities (IDU). Whereas the Select Sector SPDRs only contain stocks from the S&P 500 large cap index, I prefer the iShares for their larger universe and broader diversity.
Here are some of my observations on this week’s scores:
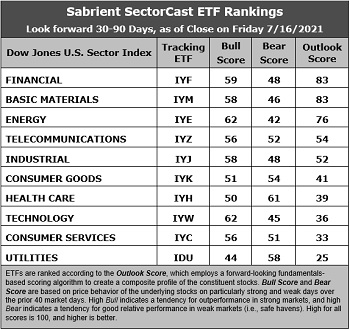
1. Financial and Basic Materials share the top spot with an Outlook score of 83, with Energy moving up to the third spot with a 76. These are all cyclical sectors, which you would expect given their high earnings leverage within a robust expansionary economy and rising oil and commodity prices. Financial enjoys strong analyst sentiment (recent positive net revisions to EPS estimates), strong insider sentiment, a reasonable forward P/E of 17.8x, and an attractive forward PEG of 1.24. Materials reflects given strong analyst sentiment, a reasonable forward P/E of 16.3x, and an attractive forward PEG (forward P/E divided by projected EPS growth rate) of 1.33. Energy is on the rise after dwelling in or near the cellar for much of the past few years, with oil holding above $70 (and spiking to nearly $77 on 7/6/20). It displays the best sentiment among both analysts and insiders, the most attractive forward P/E of 14.4x, a strong projected EPS growth rate of 16.7%, and the lowest forward PEG of 0.86 – not to mention one of the highest dividend yields. Rounding out the top five are Telecom and Industrial, and all five have Outlook scores above 50.
2. At the bottom are Utilities and Consumer Services (Discretionary/Cyclical) with Outlook scores of 25 and 33, respectively. Utilities is in the cellar primarily due to having little in the way of positive earnings revisions, a low projected EPS growth rate of 5.8%, and by far the highest forward PEG of 3.45. Although Consumer Services boasts the highest projected EPS growth of 20.8% and an attractive forward PEG of 1.22, it has a high valuation (forward P/E of 25.5x) and there has been little in the way of positive analyst revisions.
3. Looking at the Bull scores, Technology and Energy share the top score of 62 followed by Financial at 59, as stocks within these sectors have displayed relative strength on strong market days. Utilities scores the lowest at 44. The top-bottom spread of 18 points reflects low sector correlations on strong market days. It is desirable in a healthy market to see low correlations reflected in a top-bottom spread of at least 20 points, which indicates that investors have clear preferences in the market segments and stocks they want to hold.
4. Looking at the Bear scores, Healthcare scores the highest at 61 followed by Utilities at 58, as stocks within these sectors have been the preferred safe havens lately on weak market days. Energy displays the lowest score of 42, as investors have fled the sector during recent market weakness. The top-bottom spread of 19 points reflects low sector correlations on weak market days. Ideally, certain sectors will hold up relatively well while others are selling off (rather than broad risk-off behavior), so it is desirable in a healthy market to see low correlations reflected in a top-bottom spread of at least 20 points.
5. Financial displays the best all-around combination of Outlook/Bull/Bear scores, while Utilities is the worst. Looking at just the Bull/Bear combination, Healthcare displays the highest score, indicating superior relative performance (on average) in extreme market conditions whether bullish or bearish, while Utilities scores the worst.
6. This week’s fundamentals-based Outlook rankings display a solidly bullish bias given that 4 of the top 5 sectors are considered “deep cyclicals” (i.e., highly economically sensitive). The near-term earnings outlook in our fundamentals-based model is displaying much clearer visibility as the economic reopening accelerates. Keep in mind, the Outlook Rank does not include timing, momentum, or relative strength factors, but rather reflects the consensus fundamental expectations at a given point in time for individual stocks, aggregated by sector.
ETF Trading Ideas:
Our Sector Rotation model, which appropriately weights Outlook, Bull, and Bear scores in accordance with the overall market’s prevailing trend (bullish, neutral, or defensive), continues to display a bullish bias and suggests holding Energy (IYE), Financial (IYF), and Basic Materials (IYM), in that order. (Note: In this model, we consider the bias to be bullish from a rules-based trend-following standpoint when SPY is above both its 50-day and 200-day simple moving averages.)
If you prefer a neutral bias, the Sector Rotation model suggests holding Financial, Basic Materials, and Energy, in that order (same 3 sectors, different order). Or, if you are more comfortable with a defensive stance, the model suggests holding Healthcare, Utilities, and Consumer Goods (Staples/Noncyclical), in that order.
An assortment of other interesting ETFs that are scoring well in our latest rankings include First Trust Dorsey Wright Momentum & Value (DVLU), First Trust Indxx Global Natural Resources Income (FTRI), First Trust Financials AlphaDex (FXO), Invesco KBW Bank (KBWB), SPDR S&P Metals & Mining (XME), iShares Focused Value Factor (FOVL), Invesco DWA Basic Materials Momentum (PYZ), iShares Global Financials (IXG), Invesco S&P 500 Equal Weight Financials (RYF), Davis Select Financial (DFNL), iShares US Insurance (IAK), Invesco S&P SmallCap Energy (PSCE), First Trust Materials AlphaDEX (FXZ), Affinity World Leaders Equity (WLDR), iShares US Home Construction (ITB), SPDR S&P Capital Markets (KCE), Avantis US Small Cap Value (AVUV), First Trust Natural Gas (FCG), and iShares MSCI Global Energy Producers (FILL), among others. Interestingly, most of the popular ARK Invest ETFs rank near the bottom given the speculative nature of their holdings.
As always, I welcome your thoughts on this article! Please email me anytime. Any and all feedback is appreciated!
IMPORTANT NOTE: I post this information periodically as a free look inside some of our institutional research and as a source of some trading ideas for your own further investigation. It is not intended to be traded directly as a rules-based strategy in a real money portfolio. I am simply showing what a sector rotation model might suggest if a given portfolio was due for a rebalance, and I do not update the information on a regular schedule or on technical triggers. There are many ways for a client to trade such a strategy, including monthly or quarterly rebalancing, perhaps with interim adjustments to the bullish/neutral/defensive bias when warranted, but not necessarily on the days that I happen to post this article. The enhanced strategy seeks higher returns by employing individual stocks (or stock options) that are also highly ranked, but this introduces greater risks and volatility. I do not track performance of the ideas mentioned here as a managed portfolio.
Disclosure: At the time of this writing, among the securities mentioned, the author held protective puts in SPY.
Disclaimer: This newsletter is published solely for informational purposes and is not to be construed as advice or a recommendation to specific individuals. Individuals should take into account their personal financial circumstances in acting on any opinions, commentary, rankings, or stock selections provided by Sabrient Systems or its wholly owned subsidiary, Gradient Analytics. Sabrient makes no representations that the techniques used in its rankings or analysis will result in or guarantee profits in trading. Trading involves risk, including possible loss of principal and other losses, and past performance is no indication of future results.