Sector Detector: Caution flag stays out as stocks continue their consolidation
 As Q1 of 2014 comes to an end, we can see that January was extremely weak, February gained it all back, and March treaded water. At this point, as we head into what has been the strongest month of the year over the past 20 years, signals are mixed, with a steadily recovering economy and bullish fundamental indicators mixed with neutral technical and some bearish sentiment indicators.
Most of the ETF inflows in Q1 have been into bond funds rather than rotating out of bonds and into equities, as has been expected given a recovering economy and Fed tapering. So, rather than seeing rising interesting rates, Treasury yields have come down, with the 10-year yield closing Friday at 2.72% (versus a 52-week high of 3.06% and 52-week low of 1.62%). Also, gold has made something of a comeback this year, up over +7% YTD. With the fed funds rate due to increase no sooner than six months after tapering is complete, we should see short-term rates remain low until around mid-2015.
There has been a notable selloff recently in many of the momentum stocks. This has been expected for some time, as the high equity correlations and “all boats lifted in a rising tide” mentality of 2013 transitions into a more thoughtful stock-picking environment, which should lead more investment capital into the higher quality companies and less into the speculative darlings. Also, the Russell 2000 small caps took a -3.5% hit last week. On the other hand, stocks in China and emerging markets have been trying to bounce after a miserable stretch. iShares China Large Cap (FXI) recently broke above its 50-day moving average, and the iShares MSCI Emerging Markets (EEM) is back above both its 50- and 200-day moving averages.
Among the ten U.S. business sectors, Among the ten U.S. business sectors, Energy was the big winner last week, up more than +2%. Utilities is still the leader year-to-date (+7.5%), followed by Healthcare (+4%). This is similar to what happened during Q1 of 2013.
When long-term rates finally begin to rise and the yield curve steepens, the Financial sector should prove to be a beneficiary. Notably, the securities industry paid $26.7 billion in bonuses during 2013, which was the highest since 2008. However, 904 hedge funds closed their doors during 2013, many of them long/short equity or global macro strategies, which proved particularly difficult in the prevailing market environment.
The CBOE Market Volatility Index (VIX), a.k.a. “fear gauge,” has been staying right around 15 during the period of consolidation, which is slightly elevated from the low levels below 12 that it was hitting during the periods of market strength. Most market observers are expecting higher volatilities going forward.
SPY chart review:
The SPDR S&P 500 Trust (SPY) closed Friday at 185.49, which is still within spittin’ distance of its all-time highs. After a pullback from overbought conditions at the top of the long-standing rising channel, SPY continues to find support from prior resistance-turned-support at 185, and it sits smack dab in the middle of the rising channel. It also tested its 50-day simple moving average on Thursday. The sideways consolidation pattern has morphed into what might be a descending triangle pattern, which could be foretelling a reversal signal (bearish). On the other hand, it might be just some more of the same sideways action that could break either direction, and oscillators RSI, MACD, and Slow Stochastic have all worked off their overbought conditions and now are either in a neutral or oversold position (bullish).
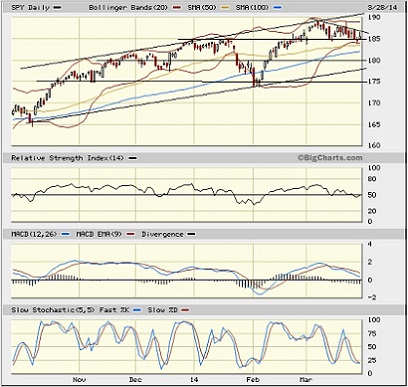
However, if SPY declines further, there are plenty of support levels to cushion the fall, starting with the 50-day SMA (near 184), the 100-day SMA (near 183), round-number support at 180, and the bottom of the rising channel (currently near 178).
Latest sector rankings:
Relative sector rankings are based on our proprietary SectorCast model, which builds a composite profile of each equity ETF based on bottom-up aggregate scoring of the constituent stocks. The “Outlook Score” employs a forward-looking, fundamentals-based multifactor algorithm considering forward valuation, historical and projected earnings growth, the dynamics of Wall Street analysts’ consensus earnings estimates and recent revisions (up or down), quality and sustainability of reported earnings (forensic accounting score), and various return ratios. It helps us predict relative performance over the next 1-3 months.
In addition, SectorCast computes our Bull Score and Bear Score for each ETF based on recent price behavior of the constituent stocks on particularly strong and weak market days. High Bull score indicates that stocks within the ETF have tended recently toward relative outperformance when the market is strong, while a high Bear score indicates that stocks within the ETF have tended to hold up relatively well (“safe havens”) when the market is weak.
Outlook Score is forward-looking while Bull and Bear are backward-looking. As a group, these three scores can be helpful for positioning a portfolio for a given set of anticipated market conditions. Of course, each ETF holds a unique portfolio of stocks and position weights, so the sectors represented will score differently depending upon which set of ETFs is used. For Sector Detector, I use the iShares that represent the ten major U.S. business sectors: Financial, Technology, Industrial, Healthcare, Consumer Goods, Consumer Services, Energy, Basic Materials, Telecom, and Utilities. Whereas the Select Sector SPDRs only contain stocks from the S&P 500, I prefer the iShares for their larger universe and broader diversity. Fidelity also offers a group of sector ETFs with an even larger number of constituents in each.
Here are some of my observations on this week’s scores:
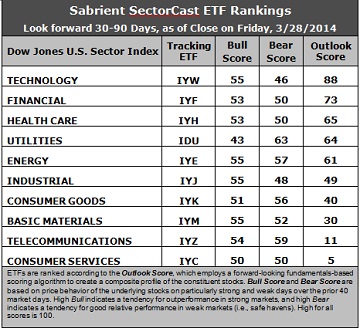
1. Technology (IYW) is once again in the top spot with a strong Outlook score of 88. Utilities (IDU) has fallen back to fourth place as Wall Street’s sell-side analysts are still upgrading earnings estimates, but not in quite the same magnitude. Instead, Financial (IYF) is solidly in second place as it scores 73 for the third week in a row. Technology has consistently displayed solid factor scores across the board, with a strong forward long-term growth rate, a relatively low forward P/E, the highest return ratios, and fine sentiment among sell-side analysts (net positive revisions to forward earnings estimates). Financial displays one of the lowest forward P/Es and decent sentiment among both sell-side analysts and company insiders (open market buying). Healthcare (IYH) is third at 65, followed by Utilities (IDU) and Energy (IYE). Notably, from a valuation standpoint, Energy displays the lowest forward P/E.
2. Consumer Services (IYC) stays in the cellar with an Outlook score of 5, as the retail sector continues to see cuts to forward guidance and negative earnings revisions by Wall Street. Consumer Services, a.k.a., consumer cyclicals or consumer discretionary, displays a high forward P/E and weak sentiment among both Wall Street analysts and company insiders. Nevertheless, the sector still boasts the highest forward long-term growth rate. Telecommunications (IYZ) is again in the second worst spot, scoring 11 this week, as it continues to display among the lowest scores on most of the factors in the model, including the highest forward P/E (valuation), low return ratios, and a low projected long-term growth rate.
3. Overall, this week’s fundamentals-based sector rankings have returned to a slightly bullish bias after a couple of neutral weeks with the caution flag up. This is my subjective interpretation given that Tech and Financial are the solid leaders, with Energy and Industrial scoring pretty well, too. Among the defensive sectors, the high score for Utilities is still somewhat cautionary, but Consumer Goods has fallen back a bit. As I think about it, I would say a caution flag is still present in these rankings.
4. Looking at the Bull scores, four sectors -- Tech, Energy, Industrial, and Basic Materials (IYM) -- all score 55, with Telecom right behind at 54, while Utilities (IDU) is by far the laggard with a score of 43. In fact, Utilities is the only sector scoring below 50. The top-bottom spread is 12 points, reflecting moderately high sector correlations on particularly strong market days. It is generally preferable in a healthy market to see the top-bottom spread approach 20 points.
5. Looking at the Bear scores, Utilities scores a 63, giving a clear indication that stocks within this defensive sector are the preferred “safe havens” on recent weak market days. Technology scores the lowest with a 46. The top-bottom spread is 17 points, reflecting relatively low sector correlations on weak market days, which is a good sign for a healthy market. But it is generally preferable in a healthy market to see a top-bottom spread of 20 points.
6. Overall, Technology easily displays the best all-weather combination of Outlook/Bull/Bear scores, while Consumer Services is the worst. Looking at just the Bull/Bear combination, Energy and Telecom share the lead, indicating superior relative performance (on average) in extreme market conditions. Consumer Services scores the lowest, indicating investor avoidance (relatively speaking) during extreme conditions.
These Outlook scores represent the view that Technology and Financial sectors are relatively undervalued, while Consumer Services and Telecom may be relatively overvalued based on our 1-3 month forward look.
Stock and ETF Ideas:
Our Sector Rotation Model, which appropriately weights Outlook, Bull, and Bear scores in accordance with the overall market’s prevailing trend (bullish, neutral, or bearish), suggests holding Technology (IYW), Financial (IYF), and Energy (IYE) in the current bullish climate. (We consider the bias to be bullish because the SPY is still above its 50 and 200-day simple moving averages. Note: If you are more comfortable moving to a neutral bias, the model suggests replacing Energy with Healthcare.)
Other ETFs that are ranked high by our algorithm from the Technology, Financial, Energy, and Healthcare sectors include iShares PHLX Semiconductor ETF (SOXX), PowerShares DWA Financial Momentum Portfolio (PFI), iShares Global Energy ETF (IXC), and SPDR S&P Pharmaceuticals ETF (XPH).
For an “enhanced” sector portfolio that employs top-ranked stocks (instead of ETFs) from within Tech, Financial, and Energy, some long ideas include SanDisk (SNDK), QUALCOMM (QCOM), Capital One Financial (COF), Simon Property Group (SPG), Helmerich & Payne (HP), and Schlumberger (SLB). All are ranked highly in the Sabrient Ratings Algorithm and also score within the top two quintiles of our Earnings Quality Rank (EQR), which is a pure accounting-based risk assessment signal based on the forensic accounting expertise of our subsidiary Gradient Analytics. We have found EQR quite valuable for helping to avoid performance-offsetting meltdowns in our model portfolios.
On the other hand, if you have a bearish outlook on the market, our Sector Rotation Model would suggest holding Utilities (IDU), Energy (IYE), and Consumer Goods (IYK).
Disclosure: Author has no positions in stocks or ETFs mentioned.
Disclaimer: This newsletter is published solely for informational purposes and is not to be construed as advice or a recommendation to specific individuals. Individuals should take into account their personal financial circumstances in acting on any rankings or stock selections provided by Sabrient. Sabrient makes no representations that the techniques used in its rankings or selections will result in or guarantee profits in trading. Trading involves risk, including possible loss of principal and other losses, and past performance is no indication of future results.