Sector Detector: The Fed faces conflicting signals from inflation, jobs growth, GDP, and forex
 by Scott Martindale
President & CEO, Sabrient Systems LLC
StocksThe S&P 500 fell more than 5% over the first three weeks of April (it’s largest pullback since last October). Bonds also took it on the chin (as they have all year), with the 2-year Treasury yield briefly eclipsing 5%, which is my “line in the sand” for a healthy stock market. But the weakness proved short-lived, and both stocks and bonds have regained some footing to start May. During the drawdown, the CBOE Volatility Index (VIX), aka fear index, awakened from its slumber but never closed above the 20 “panic threshold.”
In a return to the “bad news is good news” market action of yore, stocks saw fit to gap up last Friday as the US dollar weakened and stocks, bonds, and crypto all caught a nice bid (with the 10-year yield falling 30 bps)—on the expectation of sooner rate cuts following the FOMC’s softer tone on monetary policy and a surprisingly weak jobs report. So, the cumulative “lag effects” of quantitative tightening (QT), falling money supply, and elevated interest rates finally may be coming to roost. In fact, Fed chairman Jay Powell suggested that any sign of weakening in inflation or employment could lead to the highly anticipated rate cuts—leaving the impression that the Fed truly wants to start cutting rates.
But I can’t help but wonder whether that 5% pullback was it for the Q2 market correction I have been predicting. It sure doesn’t seem like we got enough cleansing of the momentum algo traders and other profit-protecting “weak holders.” But no one wants to miss out on the rate-cut rally. Despite the sudden surge in optimism about rates, inflation continues to be the proverbial “fly in the ointment” for rate cuts, I believe we are likely to see more volatility before the Fed officially pivots dovish, although we may simply remain in a trading range with downside limited to 5,000 on the S&P 500. Next week’s CPI/PPI readings will be crucial given that recent inflation metrics have ticked up. But I don’t expect any unwelcome inflationary surprises, as I discuss in today’s post.
The Fed faces conflicting signals from inflation, unemployment, jobs growth, GDP, and the international impact of the strong dollar on the global economy. Its preferred metric of Core PCE released on 4/26 stayed elevated in March at 2.82% YoY and a disheartening 3-month (MoM) rolling average of 4.43%. But has been driven mostly by shelter costs and services. But fear not, as I see a light at the end of the tunnel and a resumption of the previous disinflationary trend. Following one-time, early-year repricing, services prices should stabilize as wage growth recedes while labor demand slows, labor supply rises, productivity improves, and real disposable household income falls below even the lowest pre-pandemic levels. (Yesterday, the San Francisco Fed reported that American households have officially exhausted all $2.1 trillion of their pandemic-era excess savings.) Also, rental home inflation is receding in real time (even though the 6-month-lagged CPI metrics don’t yet reflect it), and inflation expectations of consumers and businesses are falling. Moreover, Q1 saw a surge in oil prices that has since receded, the Global Supply Chain Pressure Index (GSCPI) fell again in April. So, I think we will see Core PCE below 2.5% this summer. The Fed itself noted in its minutes that supply and demand are in better balance, which should allow for more disinflation. Indeed, when asked about the threat of a 1970’s-style “stagflation, the Fed chairman said, "I don't see the stag or the 'flation."
The Treasury's quarterly refunding announcement shows it plans to borrow $243 billion in Q2, which is $41 billion more than previously projected, to continue financing our huge and growing budget deficit. Jay Powell has said that the fiscal side of the equation needs to be addressed as it counters much of the monetary policy tightening. It seems evident to me that government deficit spending has been a key driver of GDP growth and employment—as well as inflation.
And as if that all isn’t enough, some commentators think the world is teetering on the brink of a currency crisis, starting with the collapse of the Japanese yen. Indeed, Japan is in quite the pickle with the yen and interest rates, which is a major concern for global financial stability given its importance in the global economy. Escalating geopolitical tensions and ongoing wars are also worrisome as they create death, destruction, instability, misuse of resources, and inflationary pressures on energy, food, and transportation prices.
All of this supports the case for why the Fed would want to start cutting rates (likely by mid-year), which I have touched on many times in the past. Reasons include averting a renewed banking crisis, fallout from the commercial real estate depression, distortion in the critical housing market, the mirage of strong jobs growth (which has been propped up by government spending and hiring), and of course the growing federal debt, debt service, and debt/GDP ratio (with 1/3 of the annual budget now earmarked to pay interest on the massive and rapidly growing $34 trillion of federal debt), which threatens to choke off economic growth. In addition, easing financial conditions would help highly indebted businesses, consumers, and our trading partners (particularly emerging markets). Indeed, yet another reason the Fed is prepared to cut is that other central banks are cutting, which would strengthen the dollar even further if the Fed stood pat. And then we have Japan, which needs to raise rates to support the yen but doesn’t really want to, given its huge debt load; it would be better for it if our Federal Reserve cuts instead.
So, the Fed is at a crossroads. I still believe a terminal fed funds rate of 3.0% would be appropriate so that borrowers can handle the debt burden while fixed income investors can receive a reasonable real yield (i.e., above the inflation rate) so they don’t have to take on undue risk to achieve meaningful income. As it stands today, assuming inflation has already (in real time, not lagged) resumed its downtrend, I think the real yield is too high—i.e., great for savers but bad for borrowers.
Nevertheless, I still believe any significant pullback in stocks would be a buying opportunity. As several commentators have opined, the US is the “best house in a lousy (global) neighborhood.” In an investment landscape fraught with danger nearly everywhere you turn, I see US stocks and bonds as the place to be invested, particularly as the Fed and other central banks restore rising liquidity (Infrastructure Capital Advisors predicts a $2 trillion global injection to make rates across the yield curve go down). But I also believe they should be hedged with gold and crypto. According to Michael Howell of CrossBorder Capital, a strong dollar will still devalue relative to gold and bitcoin when liquidity rises, and gold price tends to rise faster than the rise in liquidity—and bitcoin has an even higher beta to liquidity. Ever since Russia invaded Ukraine on 2/24/2022 and was sanctioned with confiscation of $300 billion in reserves, central banks around the world have been stocking up, surging gold by roughly +21% and bitcoin +60%, compared to the S&P 500 +18% (price return). During Q1, institutions bought a record 290 tons, according to the World Gold Council (WGC).
With several trillions of dollars still sitting defensively in money market funds, we are nowhere near “irrational exuberance” despite somewhat elevated valuations and the ongoing buzz around Gen AI. At the core of an equity portfolio should be US large cap exposure (despite its significantly higher P/E versus small-mid-cap). But despite strong earnings momentum of the mega-cap Tech darlings (which are largely driven by robust share buyback programs), I believe there are better investment opportunities in many under-the-radar names (across large, mid, and small caps), including among cyclicals like homebuilders, energy, financials, and REITs.
So, if you are looking outside of the cap-weighted passive indexes (and their elevated valuation multiples) for investment opportunities, let me remind you that Sabrient’s actively selected portfolios include the latest Q2 2024 Baker’s Dozen (a concentrated 13-stock portfolio offering the potential for significant outperformance) which launched on 4/19, Small Cap Growth 42 (an alpha-seeking alternative to the Russell 2000 index) which just launched last week on 5/1, and Dividend 47 (a growth plus income strategy) paying a 3.8% current yield. Notably, Dividend 47’s top performer so far is Southern Copper (SCCO), which is riding the copper price surge and, by the way, is headquartered in Phoenix—just 10 miles from my home in Scottsdale.
I talk more about inflation, federal debt, the yen, and oil markets in today’s post. I also discuss Sabrient’s latest fundamentals based SectorCast quantitative rankings of the ten U.S. business sectors (which continue to be led by Technology), current positioning of our sector rotation model, and several top-ranked ETF ideas. And in my Final Comments section, I have a few things to say about the latest lunacy on our college campuses (Can this current crop of graduates ever be allowed a proper ceremony?).
Click here to continue reading my full commentary. Or if you prefer, here is a link to this post in printable PDF format (as some of my readers have requested). Please feel free to share my full post with your friends, colleagues, and clients. You also can sign up for email delivery of this periodic newsletter at Sabrient.com.
By the way, Sabrient founder David Brown has a new book coming out soon through Amazon.com in which he describes his approach to quantitative modeling and stock selection for four distinct investing strategies (Growth, Value, Dividend, and Small Cap). It is concise, informative, and a quick read. David has written a number of books through the years, and in this new one he provides valuable insights for investors by unveiling his secrets to identifying high-potential stocks. I will send out an email once it becomes available on Amazon.
Market commentary:
Before I get started, I wanted to mention that I attended the Social Leverage private investment partnership’s annual meeting in Scottsdale last week, and it was quite enjoyable. Two of the start-ups they have invested in through their latest fund that I found particularly applicable to my readership include Finchat.io, a sort of ChatGPT for investment managers, and ArchiveIntel.com, which uses AI to assist financial advisors in keeping compliance records of their text and email conversations with clients. You might want to check them out (I get no direct benefit from this). Also, I will be attending the Wealth Management EDGE / Inside ETFs conference in Florida next week. If you are attending as well, please send me a note on the ConnectMe app.
The market found encouragement in Fed chairman Jay Powell’s remarks last week. He was quite clear that current monetary policy is already tight enough to get inflation lower and sees little likelihood of any further rate hikes. He even announced a slowdown in QT, that is, the Fed will reduce its monthly redemption cap on Treasury securities from $60 billion to $25 billion, which helps ease concerns about large new debt issuance. This is in addition to the refilled Treasury General Account (TGA) from April tax payments (making less need for new Treasury issuance to fund the government) and the proposed new banking rules for the Fed’s Discount Window in which banks would be required to hold collateral (typically Treasuries) of perhaps 40% of a bank’s uninsured deposits. Altogether, it would stabilize our money supply domestically—and likely lead to a positive turn for global liquidity as well, which should be bullish for stocks.
Then, last Friday’s BLS jobs report showed a significant slowing in April for both hiring and wage growth. The US economy added 175,000 new jobs (versus 240,000 expected) and the unemployment rate rose to 3.9% last month, which is near the Fed’s 4.0% threshold of concern. Wage growth fell to 3.9% year-over-year (YoY), the lowest since June 2021, and average hours worked per week continued to fall. This is not so good, but again, bad news is good news in the minds of traders if it pushes the Fed to cut rates.
As I observed in my April post, it appears that rather than organic economic growth, the government has been buying many of our jobs and much of our GDP growth through big (deficit) spending programs, while most of the new private sector jobs are in healthcare, hospitality, and construction—which are mostly lower-paying and part-time, with new layoffs and reduced hiring across manufacturing, technology, and financial services. So, it seems many of the earlier “great” jobs reports were a bit of a mirage.
More bad news last week included the Conference Board’s Consumer Confidence Index plunging in April to 97.0, down from 103.1 in March. Also, the ISM Manufacturing Index fell back into contraction (below 50) after a one-month reprieve in March from the previous 16 months of contraction, and the ISM Services Index for April dropped below 50 for the first time since December 2022. Furthermore, many US companies are warning of weaker US consumer spending on their Q1 earnings calls, consumer debt defaults and delinquencies, contraction in manufacturing activity and order backlogs, commercial real estate stress from debt maturity rollovers, and federal, state, and local governments similarly burdened by higher financing costs on debt rollovers and new issuances.
As I mentioned earlier, the Treasury's quarterly refunding announcement shows it plans to borrow $243 billion in Q2 to finance the growing budget deficit and further add to the enormous $34 trillion total federal debt load—which is growing by $1 trillion every 100 days and incurring annual interest payments exceeding $1 trillion/year. Frighteningly, we now pay over $1 trillion/year (or 1/3 of tax revenue) in interest expense to service the federal debt, and we will have to borrow about 5% of GDP every year for at least the next 10 years just to pay today’s bills, passing on the burden to future generations. As Thomas Jefferson once said, “The principle of spending money to be paid by posterity, under the name of funding, is but swindling futurity on a large scale.” Clearly, this is unsustainable. But of course, although it robs citizens of purchasing power, inflation can serve as a tool of government to devalue the debt over time.
But wait, there’s more! Businesses and households add another $65 trillion to the mix, so total US debt including government, businesses, and households is approaching $100 trillion. And that still doesn’t consider all the other unfunded liabilities our federal government has committed to dole out. According to The Hill, total unfunded liabilities—comprising the federal debt as well as promised programs like Social Security, Medicare, employee pensions, and veterans’ benefits—is estimated to be around $212 trillion, which is up from $122 trillion in 2019 and growing fast. And then we have the massive municipal pension liabilities and state budget shortfalls that might eventually need bailouts. It’s just too much to fathom, which is why I say we have effectively taken on Modern Monetary Theory (MMT) as our de facto economic system—i.e., print money now and figure it out later. It’s like a junkie taking one more hit to get through the day (“I’ll go to rehab tomorrow”). That rehab might entail higher taxes, spending cuts, and higher inflation (to “inflate away” the debt).
As for real GDP, Q1 2024 came in at an anemic 1.6% annualized rate following a strong 3.4% in Q4 2023, although the Atlanta Fed’s GDPNow model is forecasting 3.3% growth for Q2. We shall see. As for earnings, Q1 corporate earnings season has been solid as a whole (albeit driven more by cost-cutting and buybacks than sales growth), and analysts are raising their Q2 earnings estimates overall. Indeed, share buybacks have been robust, which suggests a lack of recession fears (the reason buybacks were slow in 2023). In addition, corporate bond credit spreads remain low relative to recent history, indicating an underlying confidence in economic growth. Meanwhile, there continue to be signs of a synchronized global growth acceleration, such as copper reaching 52-week highs, which signals rising industrial demand.
However, Mark Skousen’s Gross Output (GO) metric has been growing slower than GDP for the past few quarters, which historically suggests an imminent slowing in GDP (and perhaps a recession). Skousen has long asserted that business spending rather than consumer spending is the real engine of economic growth by creating jobs and raising wages, and the BEA has gotten onboard and begun to publish GO (although less frequently). Indeed, with B2B spending growth having recently turned negative, it appears to me that government deficit spending has kept GDP and new jobs growth positive. So, that’s not so encouraging.
Here's an interesting factoid. According to the St. Louis Fed, the Technology sector contributes just 5.4% as a percentage of US GDP (as of Q3 2023) while representing about 30% of the total US stock market capitalization. But the Financial Services sector (including REITs) contributes 20.7% of US GDP while representing only about 15.5% of total US market cap. Although this seems like evidence that InfoTech is grossly overvalued, the dichotomy is primarily due to Tech’s combination of faster growth rates, secular “all weather” growth, and products that boost efficiency, productivity, and product development in all industries. So, its total impact on GDP can’t be measured strictly by its direct financial contribution to GDP given its broad indirect impacts.
Inflation, the yen, and Fed policy:
As I have often discussed in the past, the Fed has other concerns for determining monetary policy than just inflation and unemployment here at home. Its actions influence the strength of the dollar against other currencies and the ability of foreign companies and countries holding dollar-denominated debt to service that debt. Of course, the relative weakness of the yen and much lower interest rates in Japan have made the “yen carry trade” quite popular among hedge funds—i.e., sell short the yen, buy the dollar (or other currencies) given that Japan’s interest rates are 0.00%-0.10% while US interest rates are 5.25%-5.50%).
So, the BoJ was forced to intervene massively last week to avert the yen’s collapse (as it fell to 160:1 versus the dollar, its lowest level since 1990), which surely influenced Fed chair Powell’s dovish comments about the low likelihood of further rate hikes (which would further strengthen the dollar). A surge in Japan’s rates would create a lot of market turmoil (e.g., especially with forex markets, foreign currency reserves, and the yen carry trade) and difficulty for heavily leveraged Japanese businesses and the government itself. Although the country has restored positive interest rates (from the hard-to-fathom negative rates that had persisted for so long) and halted its yield curve control (YCC), its economic stability is highly rate-sensitive given its eyepopping 260% national debt/GDP ratio. As Eric Peters of One River Asset Management analogized, “Sometimes [forex intervention] works. When it does not, it reminds investors that as powerful as central bankers are, markets are apex predators. And when nature is out of balance, and bankers are weakened, markets restore balance swiftly, savagely, without regard for stability.”
Moreover, while the broad stock market indexes have been steadily climbing, the financial sector has looked frailer. S&P Global recently downgraded five regional banks—First Commonwealth Financial, M&T Bank, Synovus Financial, Trustmark, and Valley National Bancorp—to a negative rating, reflecting “the possibility that stress in CRE markets may hurt the asset quality and performance of the five banks, which have some of the highest exposures to CRE loans among banks we rate." This brings the total number of banks with negative outlooks from S&P to nine. In addition, regional banks have been dealing with depositors fleeing to higher interest money market funds. So, this is another concern on the Fed’s radar screen.
As we anticipate the latest CPI/PPI readings next week, it’s important to understand the extreme lag in some of the components used by the BLS, particularly regarding shelter cost, which has a 6-month delay purposely built in—which is particularly significant given that shelter is 36% of CPI. The chart below summarizes a study by RealInvestmentAdvice.com (RIA) that adjusts the official CPI reading using the Cleveland Fed’s All Tenants Regressed Rent index (ATRR) and New Tenant Rent index (NTR). For March, it shows an adjusted CPI Shelter cost reading of 4.18% (versus the 5.7% official BLS number), adjusted CPI of 2.48% (1% lower than the official 3.48%), and CPI Less Shelter of only 0.95%!
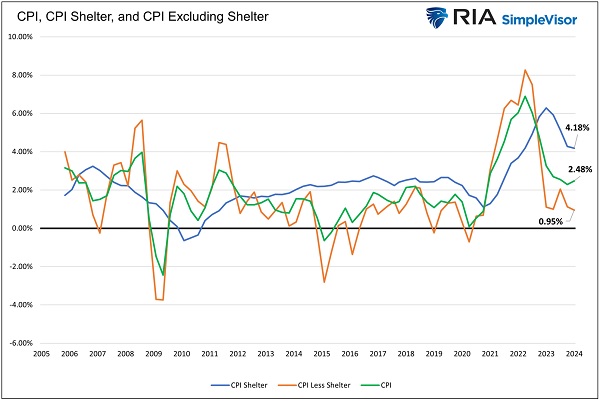
Infrastructure Capital Advisors performed a similar study and found that if shelter inflation was adjusted to reflect market rents readily available from internet rental companies, shelter inflation would be -0.8%, which would make headline CPI inflation only 1.2% (versus the official 3.48% reading and 2.48% from the RIA study above). Either way, both studies support my contention that disinflationary pressures are still in play, which bodes well for next week’s official April CPI release. And as mentioned earlier, the real-time, blockchain-based “Truflation” metric, which historically presages CPI by several months, currently shows a reading of +2.27%, although it has been creeping up (from as low as 1.80% around this time last month).
Oil and energy:
I’d like to focus a bit more today on the energy markets. Although gasoline is only about 3.5% of CPI, it still impacts consumers’ marginal spending on other things. So, higher gasoline prices might bring about lower prices on other consumer goods. In addition, it (along with food prices) impacts consumers’ perception and expectation of inflationary pressures. And there is no sign today of an inflationary (1970’s style) surge in oil prices that would drive up gasoline prices.
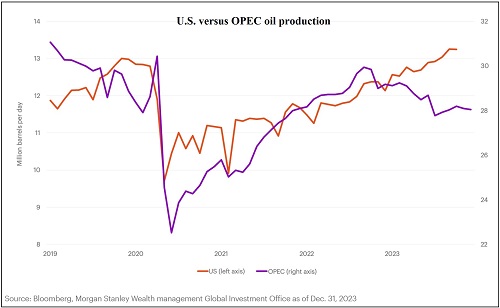
As of 2023, the US is the world’s top producer of hydrocarbons, as shown in the chart below. OPEC has curtailed production in an effort to bolster oil prices above $80/bbl. In addition, Mexico has cut crude oil exports dramatically as part of its long-term plan to become self-sufficient in motor fuels and ultimately stop exporting crude completely, and it is now at its lowest export level since 2019. But US production continues to increase, despite reduced capital spending largely due to efforts from the Biden Administration, activist investors, and the climate change community to restrict it.
In addition, liquefied petroleum gas (LPG), which is put into a liquid state through pressure (like your propane tank) and liquefied natural gas (LNG), which is put into a liquid state through deep freeze. In both cases, they take up much less volume for transportation purposes when in a liquid state rather than a gaseous state, which is why they are liquefied.
After it is transported to its overseas destination by refrigerated tanker, LNG is returned to its gaseous state (mostly methane) for distribution through pipelines to the final users. As evidenced by the natural gas in your kitchen stove, it is clear, odorless, colorless, and produces such low levels of soot, carbon dioxide, sulfur dioxide, mercury, and other harmful pollutants that it can be used indoors. So, it is the cleanest fossil fuel, which is why Germany shut down its nuclear facilities and signed the ill-fated supply agreement with Russia. US exports of both LNG and LPG continue to rise and are at a record high, even though the US gas rig count has fallen, with LNG export capacity on track to rise 80% by 2028, according to Energy Infrastructure Channel, which will benefit shippers as well as liquefaction and natural gas energy infrastructure companies.
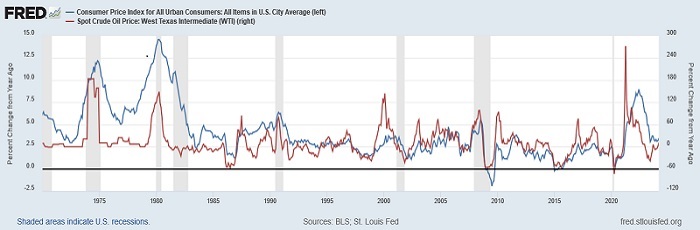
Exports of all these hydrocarbons have helped reduce our trade deficit while also helping to keep inflationary pressures in check (both at home and abroad). According to DataTrek, since 1970, US gasoline prices explain more than 50% of the change in headline CPI, even though gasoline has composed just 3-6% of CPI over this period. Because petroleum is used to make so many other products (including plastics and chemicals), lower prices filter through into broader consumer goods prices. The chart below illustrates the strong historical correlation between changes in crude oil price (red) and CPI (blue).
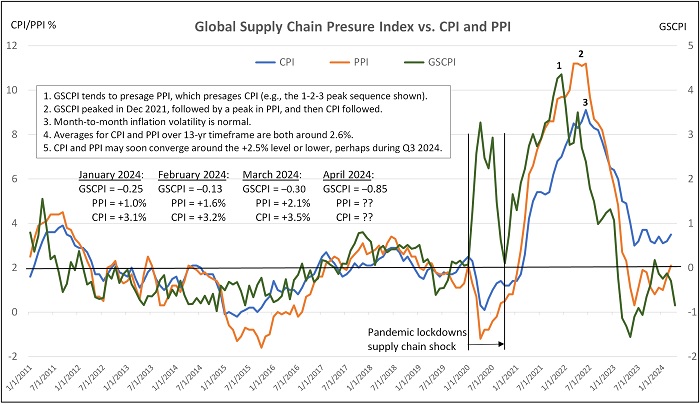
The next chart will be familiar to my regular readers. It compares CPI and PPI with the New York Fed’s Global Supply Chain Pressure Index (GSCPI), which measures the number of standard deviations from the historical average value (aka Z-score) and generally foreshadows movements in inflation metrics. GSCPI fell again in April to -0.85, which keeps it in negative territory despite disruptions to shipping in parts of the world due to war in Ukraine and Gaza, suggesting that supply chain pressures are firmly back below the long-run average—which, as a precursor to producer prices, has kept the PPI low and suggests that CPI should resume its gradual retreat (leaving only sticky shelter costs as the main concern, as I discussed earlier). We will see next week the latest readings for PPI (on 5/14) and CPI (on 5/15). But I continue to believe disinflationary trends will continue to manifest and that the Fed will be able to justify cutting rates soon.
By the way, I listened to a remarkable interview on John Stossel’s podcast of a fellow named Alex Epstein on “The Moral Case for Fossil Fuels” that pretty effectively responds to all the arguments for renewable energy sources as replacements for fossil fuels. We all have heard horror stories about the poor reliability of clean energy production (including brownouts and rolling blackouts during peak power usage times, going offline when needed most, leading to deaths), not to mention its high cost (which has largely depended upon government subsidies—and China dumping of goods—for some semblance of economic viability). Given the current state of its technology, renewable energy can’t replace traditional power plants anytime soon; instead it adds to the cost of fossil fuels. So, the only way to make it relatively affordable is to make fossil fuels unaffordable by restricting them, which drags down the entire global economy, particularly the poorest countries. Epstein asserts that truly affordable energy is the only path to prosperity and for lifting the standard of living for all. No matter where you stand on this issue, it’s a must-listen for any open-minded individual.
Several years ago, there was a utopian (or Pollyanna?) vision that net zero could be attained with little pain while boosting economic growth. Furthering the urgency was the likes of AOC admonishing us, “The world is going to end in 12 years if we don't address climate change!” But the downsides to current renewable technology have been revealed such that the experts, and society at large, are acquiring some pragmatism regarding the evils of hydrocarbons and the infallibility of renewables.
My regular readers know that I have written often about how the world’s energy needs are set to accelerate as: 1) developing and frontier nations are growing rapidly and rely upon affordable power to continue their development, and 2) while developed nations try to reduce their energy consumption, those efforts are offset by the enormous power demands of data centers in serving the exponential growth in Gen AI applications. Progress requires energy, and given the high cost and massive raw materials requirements of solar and wind production, they cannot provide it alone. As I often say, to power the rapidly advancing technologies of the 2020s, including Gen AI, blockchain and distributed ledger technologies (DLTs), an quantum computing, we will need development of high-efficiency energy sources like localized natural gas generators and small modular nuclear reactors (SMRs) that employ advanced nuclear fission technology—and perhaps the game-changing technology of the 2030s will be safe, zero-emission, perpetual-energy-generating, nuclear fusion reactors.
Final comments:
It's notable that eminent value investor Warren Buffett does not feel comfortable with current equity valuations. In reference to Berkshire Hathaway’s $190 billion (and growing) cash balance, he said at the latest annual meeting, “I don’t think anyone at this table has any idea of how to use it effectively and therefore we don’t use it.” For now, he’s happy to earn 5.4% from T-bills.
But I firmly believe that US equities offer the best combination of relative safety and high potential—and will be a good bit higher than they are today by year end (albeit not without volatility along the way). The strong dollar makes emerging markets and most of our developed-market trading partners less appealing. Moreover, DataTrek observed that over the past five years, S&P 500 and Nasdaq 100 dividends have grown by +27% and +67%, respectively, whereas MSCI Europe dividend growth is just +7%, and MSCI Emerging Markets has seen a -15% dividend reduction.
Europe is dragged down by aging demographics and anti-capitalist policies that have led to deindustrialization, disastrous energy policy, relatively low corporate margins, and lack of spirited tech innovation and market-dominant companies. So, whenever I hear people on the political Far left espouse the glory of Europe’s quasi-socialist governance, I wonder why—given its relative similarity to the US in ethnic demography and a modern society based on the same “Euro-Christian” principles—it hasn’t come close to the US in producing game-changing technologies, opportunities, and prosperity for itself and the world at large. In my view, it lacks the same freedom, openness, dynamicism, and incentive structures that we have.
And as for China’s unique “capitalism with Chinese characteristics” that has created the “China Miracle,” although its authoritarian rule, homogenous society, and obedient culture helps ensure broad unity and focus on common goals, its system is still far inferior when it comes to freedom of thought, entrepreneurship, and innovation. Despite America’s glaring inequalities and inadequacies, there is no better country on earth for tolerance, opportunity, and economic prosperity, and we continue to grow ever more diverse and inclusive.
So, living in such a vibrant society, how can our youth in the US support the intolerance, hate, and authoritarianism of Radical Islam and Hamas over a modern, hospitable, and resilient Israel, the ancestral homeland of Jews before all others, and where all faiths are free to peacefully speak and worship as they please? It has to do with the destructive narrative of “oppressors versus oppressed” into which they have been indoctrinated by our schools and social media—as well as much of the mainstream media and some of our illustrious members of Congress (specifically “the squad”). You see, Palestinians are considered part of the oppressed class that is virtuous by definition and thus must be defended no matter what, even though the reality is that Jews have succeeded (and thus gained entry into the “oppressor” and “colonizer” class) by doggedly overcoming a long history of oppression stretching thousands of years.
I feel compelled to speak on this topic given that—much like the 2020 BLM/Antifa riots of 2020—such a small but radicalized segment of the population (led by many of the same professional agitators from 2020) has created so much unwarranted disruption and has cowed so many citizens into silence. And just like in the summer of 2020, virtually none of them are suffering any consequences for the damage they have wrought. If arrested, they are immediately released. As an aside, if you do not impose “guardrails” on the behavior of your kids or dogs, it would lead to utter chaos and ruin at your home. Similarly, allowing hoodlums, misfits, thrill-seekers, and professional agitators to completely upend our functioning society for ludicrous Leftist causes cannot go unpunished without permanent degradation and the tearing apart of the fabric of society—which unfortunately seems to be part of a broader trend to destroy our Constitution and America as we know it.
Here's the unspoken reality. Jews don’t have a problem with Palestinians per se; it’s Palestinians who have a problem with Jews. It is only the intolerance of Radical Islam that perpetuates endless conflict, so they can’t be trusted to coexist, nor do they even want to coexist with Jews (or any other faiths, for that matter). This blind intolerance is the entire crux of the matter. Multiculturalism doesn’t sit well with Palestinians. They have rejected all proposed two-state solutions throughout modern history. But as I learned from my mother, who was a classic liberal (e.g., free speech, civil liberty, tolerance of other faiths and cultures, the Golden Rule), the only thing I can’t tolerate is intolerance. Hamas glorifies martyrdom over life & liberty while adhering to the most repressive sharia law, with the explicit goal of liberating Palestine of all non-believers (“infidels”) and ultimately creating a worldwide Islamic Caliphate. So, the young radicals in our universities (trained by the professors who were or learned from the 1960s revolutionaries) are just willing dupes, supporting Hamas instead of the free, tolerant, and welcoming Israeli society.
There are certain inarguable, morally clear tenets of a functional society—like murder and rape are bad, children must be protected from predators, the Rule of Law is essential, and a country’s citizens must be protected from foreign invaders. Likewise, it is clear Israel has the right to exist in its ancestral homeland (which was also reclaimed legally through contractual purchases and international partitioning). At worst, Israel should share the land with Arabs who also consider it their holy land. But the Arabs do not want to share the land in any way, and the Far Left believes Israel should not defend its citizens from the savagery of Hamas—indeed, they believe Jews should immediately vacate the land so that Palestinians can be free to live there unbothered by infidels (i.e., “From the river to the sea, Palestine shall be free”). For a free society like ours to support such a repressive, hateful culture in any way is incomprehensible.
Unfortunately, the Palestinian people have chosen a leadership that is taking them down the same path and destined for the same fate as Nazi Germany and Imperialist Japan in World War II. When you demand all or nothing and then overstep in a barbaric way, e.g., the 10/7 massacre (on my birthday), you reap what you sow—and might end up with nothing. Yes, the destruction of Gaza and its death toll is upsetting, but it would all be over tomorrow if Hamas would simply surrender, release all hostages, repent, agree to a peaceful two-state coexistence, and then allow the civilized world to help Palestinians rebuild a prosperous future for its people as productive members of a diverse global community, just as we did for Germany and Japan following WWII—and those nations are thriving today with two of the largest economies in the world as members of the G7. If the protestors want to truly make a difference for the Palestinians, they should be vociferously protesting against the murderous Hamas leadership, who callously use their own people as humans shields and cannon fodder to gain international sympathy, and insist they be brought to justice.
Although I obviously have strong feelings about this, I am an open-minded person eager to consider alternative viewpoints—but they must be rational arguments, which I haven’t yet heard on this topic from anyone on the other side. Please let me know if you have one.
On a personal note, I was not raised religious, nor have I ever been very religious. But I have been having something of a spiritual awakening as I witness the gradual secularization of Western society that is fostering an “anything goes” mentality, indulgence of all things shocking and erotic, and normalization of even the most disturbing human proclivities, such that the Judeo-Christian-based moral compass that once unified us is steadily eroding away. The normally silent majority of people of goodwill need to speak out more forcefully with whatever platform you have. Just say no to the mob. They can’t cancel us all…or there won’t be any of us “oppressors” left to fund the government entitlements they live on.
Back to topic of investing, while they are still free to download, I invite you to examine our new product Sabrient Scorecards—one for individual stocks and one for ETFs. Each includes our Top 30 lists for each of a variety of our potent quantitative scores. Notably, we have a new version in the pipeline to help investors and advisors with stock search, fundamental screening, idea generation, risk monitoring, and confirmation, as well as portfolio construction for four specific investing styles: Growth, Value, Dividend, and Small Cap investing. (More to come on this in the near future, in concert with the launch of David Brown’s new book.) These sheets are posted weekly in Excel format and show how your stocks and ETFs score in our various alpha factors…or for identifying the top-ranked stocks and ETFs for each alpha factor (or for weighted combinations of the factors). Please check them out and share your feedback with me!

Latest Sector Rankings:
Relative sector rankings are based on our proprietary SectorCast model, which builds a composite profile of each of over 1,000 equity ETFs based on bottom-up aggregate scoring of the constituent stocks. The Outlook Score is a Growth at a Reasonable Price (GARP) model that employs a forward-looking, fundamentals-based multifactor algorithm considering forward valuation, historical and projected earnings growth, the dynamics of Wall Street analysts’ consensus earnings estimates and recent revisions (up or down), quality and sustainability of reported earnings, and various return ratios. It helps us predict relative performance over the next 3-6 months.
In addition, SectorCast computes a Bull Score and Bear Score for each ETF based on recent price behavior of the constituent stocks on particularly strong and weak market days. A high Bull score indicates that stocks within the ETF recently have tended toward relative outperformance when the market is strong, while a high Bear score indicates that stocks within the ETF have tended to hold up relatively well (i.e., safe havens) when the market is weak. Outlook score is forward-looking while Bull and Bear are backward-looking.
As a group, these three scores can be helpful for positioning a portfolio for a given set of anticipated market conditions. Of course, each ETF holds a unique portfolio of stocks and position weights, so the sectors represented will score differently depending upon which set of ETFs is used. We use the iShares that represent the ten major U.S. business sectors: Financials (IYF), Technology (IYW), Industrials (IYJ), Healthcare (IYH), Consumer Staples (IYK), Consumer Discretionary (IYC), Energy (IYE), Basic Materials (IYM), Telecommunications (IYZ), and Utilities (IDU). Whereas the Select Sector SPDRs only contain stocks from the S&P 500 large cap index, I prefer the iShares for their larger universe and broader diversity.
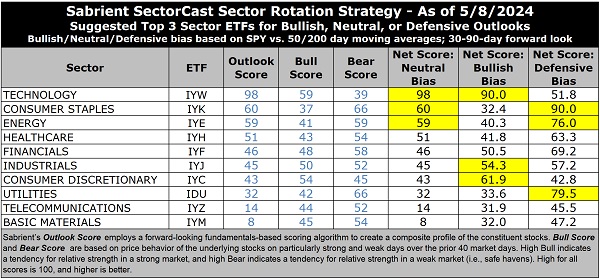
This month, I am displaying the full sector rotation table for your viewing pleasure. The latest fundamentals-based Outlook rankings display what I would call a neutral bias given that only one of the top five have Bull scores above 50 and there is mix of cyclicals and non-cyclicals at the top. Despite a high forward P/E of 27.5x, Technology (IYW) remains by far the top ranked sector with a near-perfect Outlook score of 98, given it scores strongly in almost every factor (expect forward P/E), with strong forward EPS growth estimates (18.8%), a relatively low (attractive) forward PEG (ratio of forward P/E to EPS growth) of 1.46, consistently positive earnings revisions from the Wall Street analyst community, the best return ratios, and the best insider sentiment (open market buying).
Then, there’s a big drop-off to the next three who are bunched together: Consumer Staples (IYK) with an Outlook score of 60, Energy (IYE) at 59, and Healthcare (IYH) at 51. Financials (IYF) rounds out the top 5 with a score of 46, followed closely by Industrials (IYJ) and Consumer Discretionary (IYC), which are all cyclical sectors. Notably, Energy and Financials display the lowest forward P/Es at 12.5x and 13.6x, respectively, and Financials has the lowest forward PEG of 1.17.
Basic Materials (IYM) is back at the bottom (as its growth expectations have been cut), along with defensive sectors Telecom (IYZ) and Utilities (IDU).
Keep in mind, the Outlook Rank does not include timing, momentum, or relative strength factors, but rather reflects the consensus fundamental expectations at a given point in time for individual stocks, aggregated by sector.
ETF Trading Ideas:
Our rules-based Sector Rotation model, which appropriately weights Outlook, Bull, and Bear scores in accordance with the overall market’s prevailing trend (bullish, neutral, or defensive), has regained its bullish bias as the market rally resumes. It was bullish from early November until the market pullback in mid-April when it shifted to neutral (for about 3 weeks) on the S&P 500’s confirmed close below its 50-day moving average. But with this past Monday’s strong close back above the 50-day, the model moved back to bullish.
Today, the model suggests holding Technology (IYW), Consumer Discretionary (IYC), and Industrials (IYJ), in that order. (Note: In this model, we consider the bias to be bullish from a rules-based trend-following standpoint when SPY is above both its 50-day and 200-day simple moving averages, but neutral if it is between those SMAs while searching for direction, and defensive if below both SMAs.)
If you prefer a neutral bias, the Sector Rotation model suggests holding Technology, Consumer Staples (IYK), and Energy (IYE). Or, if you prefer to take a defensive stance on the market, the model suggests holding Consumer Staples, Utilities (IDU), and Energy, in that order.
An assortment of other interesting ETFs that are scoring well in our latest rankings include: Innovator IBD Breakout Opportunities (BOUT), Invesco Next Gen Media and Gaming (GGME), CastleArk Large Growth (CARK), Invesco Dorsey Wright Consumer Cyclicals Momentum (PEZ), Global X Social Media (SOCL), Fidelity Disruptive Communications (FDCF), Hartford Large Cap Growth (HFGO), Invesco Building & Construction (PKB), AdvisorShares Gerber Kawasaki (GK), BNY Mellon Innovators (BKIV), Pacer US Small Cap Cash Cows Growth Leaders (CAFG), Invesco S&P 500 Pure Growth (RPG), First Trust Multi-Manager Large Growth (MMLG), Segall Bryant & Hamill Select Equity (USSE), PGIM Jennison Better Future (PJBF), Inspire Fidelis Multi Factor (FDLS), iShares Expanded Tech Sector (IGM), Global X Clean Water (AQWA), ERShares Entrepreneurs (ENTR), WisdomTree US Quality Growth (QGRW), Invesco S&P SmallCap 600 Pure Growth (RZG), First Trust Natural Gas (FCG), and First Trust Bloomberg R&D Leaders (RND). All score in the top decile (90-100) of Outlook scores.
As always, I welcome your thoughts on this article! Please email me anytime. Any and all feedback is appreciated! In particular, please tell me what sections you find the most valuable—commentary, SectorCast scores, or ETF trading ideas / sector rotation model. Also, please let me know of your interest in:
1. a Sabrient index for ETF investing (we offer a 10-index Quality Index Series)
2. the new Sabrient Scorecards with our full rankings of stocks and ETFs
3. having me speak at your event (topics include the economy and stock market, the energy sector, China’s economic situation, and career success secrets for new grads and young professionals)
IMPORTANT NOTE: I post this information periodically as a free look inside some of our institutional research and as a source of some trading ideas for your own further investigation. It is not intended to be traded directly as a rules-based strategy in a real money portfolio. I am simply showing what a sector rotation model might suggest if a given portfolio was due for a rebalance, and I do not update the information on a regular schedule or on technical triggers. There are many ways for a client to trade such a strategy, including monthly or quarterly rebalancing, perhaps with interim adjustments to the bullish/neutral/defensive bias when warranted, but not necessarily on the days that I happen to post this article. The enhanced strategy seeks higher returns by employing individual stocks (or stock options) that are also highly ranked, but this introduces greater risks and volatility. I do not track performance of the ideas mentioned here as a managed portfolio.
Disclosure: At the time of this writing, of the securities mentioned, the author held positions in SPY, QQQ, TLT, gold, and various cryptocurrencies.
Disclaimer: Opinions expressed are the author’s alone and do not necessarily reflect the views of Sabrient. This newsletter is published solely for informational purposes and is not to be construed as advice or a recommendation to specific individuals. Individuals should take into account their personal financial circumstances in acting on any opinions, commentary, rankings, or stock selections provided by Sabrient Systems. Sabrient makes no representations that the techniques used in its rankings or analysis will result in or guarantee profits in trading. Trading involves risk, including possible loss of principal and other losses, and past performance is no indication of future results.