Sector Detector: Patient bulls finally get a new entry point, thanks to inflation fears
Now that’s what I’m talking about. I have been discussing the overbought technical conditions of the S&P 500 for some time and the need for a pullback to test bullish support levels. And as many commentators have suggested, the more time between pullbacks, the more severe is the action when it finally arrives. Bears had become very hungry after a prolonged hibernation. This week offered up a nasty pullback. But fear not, because in my view it was just what the doctor ordered for the bulls to recruit new troops in order to have a chance at breaking through some ominous resistance levels.
In this weekly update, I give my view of the current market environment, offer a technical analysis of the S&P 500 chart, review our weekly fundamentals-based SectorCast rankings of the ten U.S. business sectors, and then offer up some actionable trading ideas, including a sector rotation strategy using ETFs and an enhanced version using top-ranked stocks from the top-ranked sectors.
Market overview:
Once Fed Chairwoman Yellen mentioned a little something about inflation, bulls got spooked, and of course a little fear at overbought levels can snowball in short order. The stock market is a discounting mechanism in that the theoretical fair value in a discounted cash flow model is the sum of future earnings discounted back to a present value. So, if inflation starts to creep up, there would be pressure on the Federal Reserve to increase the discount rate, which would make it harder to support elevated multiples. Moreover, it would make corporate borrowing for stock buybacks or capital investment less attractive. Thus, the kneejerk reaction. This further underscores the need for economic expansion and rising corporate earnings (as well as rising revenues) to support valuations. So far, earnings season has been pretty good, and of course Q2 GDP smoked all predictions by clocking in at a robust +4%, while the dismal Q1 rate was revised upward.
Wage inflation is the necessary precursor to price inflation, and reports showed that U.S. labor costs in Q2 recorded their biggest gain in more than five years. Argentina defaulting on its sovereign debt and increasingly severe sanctions on Russia didn’t help investor psyche, either. On Friday, unemployment ticked up to 6.2% (even though many observers thought it might drop below 6%), most likely due to an increase in the labor participation rate (i.e., more people trying once again to find a job as the economic conditions improve). Furthermore, the Fed has shifted its focus from simply the unemployment rate to a range of labor market indicators. So, the FOMC is unlikely to start raising rates any time soon. PIMCO founder and bond expert Bill Gross opined that we in the midst of “a global marketplace that is deflating and de-levering to a certain extent. It’s not Lehman Brothers of 2008…It appears the only safe haven is the front end of the U.S. yield curve.”
After nearly three years without a 10% peak-to-trough correction, hungry bears have been itching to pounce. And although investors have become immune to most of the daily worries about the global economy and potential Black Swan events, the reality is that it has been eight years since the Fed last raised rates, so an increasingly imminent change in policy has become the major focus and source of investor angst. At the moment, the first rate hike isn’t expected until mid-2015, but it could come sooner should inflation rise faster than the Fed anticipates.
Still, the 10-year U.S. Treasury yield didn’t flinch, closing Friday at a still-low 2.49%. Scott Minerd of Guggenheim has pointed out that international demand for U.S. Treasuries should remain strong when compared to alternatives like 10-year Japanese government bonds yielding around 0.50% or German 10-year bunds yielding just over 1%, which is a historic low and the Treasury/bund spread is near all-time highs. A further decline in the 10-year Treasury yield is possible even without Fed buying.
The CBOE Market Volatility Index (VIX), a.k.a. fear gauge, closed last Friday at 17.03, which finally broke its 3.5-month streak of closing below 15. Should we be surprised after such a long period of complacency? Not really. According to Brian Stutland of Equity Armor Investments (a Sabrient strategic partner), July normally sees the biggest increase in VIX. If VIX can fall back below 15, bulls should be in good shape.
In my view, this much-needed pullback and technical consolidation is offering entry points for some of our favorite stocks that are like the proverbial baby being thrown out with the bathwater. NXP Semiconductors (NXPI) and ARRIS Group (ARRS) are examples of high-quality growth stocks still trading at a reasonable price that had become momentum darlings, but then got hit unnecessarily hard when those momentum traders found an excuse to protect trading profits despite attractive earnings reports. In the case of ARRS, their usual beat-and-raise quarterly report simply indicated a tiny lack of visibility for Q4 followed by a robust 2015, yet they got knocked down by -14% on Friday. So, the current market weakness should be taken as a buying opportunity for quality companies, as well as for previously neglected companies like Marathon Petroleum (MPC) that reported stellar earnings and got a big boost even during the market weakness.
SPY chart review:
The SPDR S&P 500 Trust (SPY) closed last Friday at 192.50, after slicing through its 50-day simple moving average like it wasn’t even there and giving back two months’ worth of gains in a couple of days. In fact, the SPY suffered its worst weekly loss in over two years. The 20-day SMA and the lower line of the mini rising channel finally stopped providing short-term support after doing so multiple times since the beginning of June. Now SPY it looking for support at the 100-day SMA, but there are plenty more levels of strong support below. And despite the sudden and scary pullback, it is still right smack dab in the middle of the long-standing bullish rising channel. The 100-day SMA is approaching 192, and the 200-day is converging with the lower line of the larger rising bullish channel, around 186. In between, prior levels of resistance-turned-support lie at 190 and 187.5. Oscillators RSI, MACD, and Slow Stochastic have all cycled down quite quickly into oversold territory and could stabilize here. On the top side, the upper line of the rising channel now intersects with psychologically ominous resistance at 200, and I think a test will come. With a little more technical consolidation and successful testing of these nearby support levels, the next move higher -- culminating in that test of resistance -- could easily commence at any time.
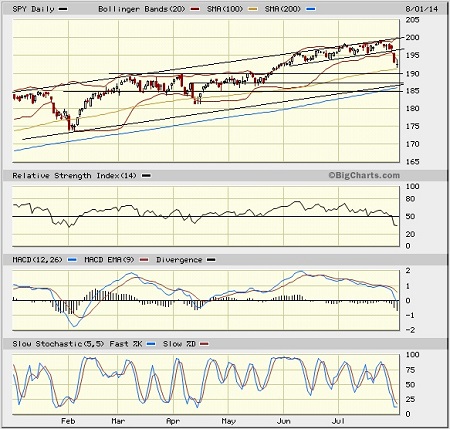
The Russell 2000 small cap index is now well below its important 200-day SMA and looking quite weak. But perhaps the large caps can show sufficient strength to pull the small caps along for the ride. At some point, if the bulls are going to get it going in a big way, the small caps will have to show some relative strength.
Latest sector rankings:
Relative sector rankings are based on our proprietary SectorCast model, which builds a composite profile of each equity ETF based on bottom-up aggregate scoring of the constituent stocks. The Outlook Score employs a forward-looking, fundamentals-based multifactor algorithm considering forward valuation, historical and projected earnings growth, the dynamics of Wall Street analysts’ consensus earnings estimates and recent revisions (up or down), quality and sustainability of reported earnings (forensic accounting), and various return ratios. It helps us predict relative performance over the next 1-3 months.
In addition, SectorCast computes a Bull Score and Bear Score for each ETF based on recent price behavior of the constituent stocks on particularly strong and weak market days. High Bull score indicates that stocks within the ETF recently have tended toward relative outperformance when the market is strong, while a high Bear score indicates that stocks within the ETF have tended to hold up relatively well (i.e., safe havens) when the market is weak.
Outlook score is forward-looking while Bull and Bear are backward-looking. As a group, these three scores can be helpful for positioning a portfolio for a given set of anticipated market conditions. Of course, each ETF holds a unique portfolio of stocks and position weights, so the sectors represented will score differently depending upon which set of ETFs is used. We use the iShares that represent the ten major U.S. business sectors: Financial (IYF), Technology (IYW), Industrial (IYJ), Healthcare (IYH), Consumer Goods (IYK), Consumer Services (IYC), Energy (IYE), Basic Materials (IYM), Telecommunications (IYZ), and Utilities (IDU). Whereas the Select Sector SPDRs only contain stocks from the S&P 500, I prefer the iShares for their larger universe and broader diversity. Fidelity also offers a group of sector ETFs with an even larger number of constituents in each.
Here are some of my observations on this week’s scores:
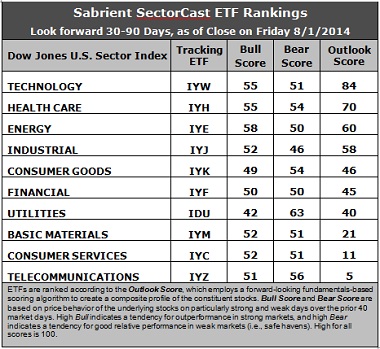
1. Technology holds the top spot with an Outlook score of 84. The sector displays solid scores across most factors in the model, including solid Wall Street analyst sentiment (net upward revisions to earnings estimates), a good forward long-term growth rate, and strong return ratios. Only the forward P/E is below average (Financial and Energy have the lowest forward P/Es). Healthcare remains in the second spot this week with a score of 70 as the sector continues to display the strongest (and still improving) sell-side analyst sentiment (upward revisions), a good forward long-term growth rate, and reasonable return ratios. Energy has taken the third spot from Industrial, but their scores remain very close and both continue to display improving sentiment from Wall Street. Consumer Goods/Staples rounds out the top five.
2. Telecom stays in the cellar this week with an Outlook score of 5, as the sector has generally low scores on most factors in the model. Consumer Services/Discretionary returns to the bottom two in its weekly duel with Basic Materials, showing a score of 11, despite a strong forward long-term growth rate. Consumer Services and Materials have been saddled with the most downward revisions to analyst earnings estimates.
3. Looking at the Bull scores, there has been some notable changes, which one might expect with elevated market volatility as investor preferences become more clearly defined. Energy has suddenly surged to the lead with strong score of 58, while Utilities remains the clear laggard at 42. The top-bottom spread is 16 points, reflecting average sector correlations on particularly strong market days. It is generally desirable in a healthy market to see lower correlations and a top-bottom spread of at least 20 points, which indicates that investors have clear preferences in the stocks they want to hold, rather than the all-boats-lifted-in-a-rising-tide mentality that dominated 2013.
4. Looking at the Bear scores, Utilities is the clear leader with a solid (but falling) score of 63, which means that stocks within this sector have been the preferred safe havens on weak market days. Industrial now displays the lowest score of 46. The top-bottom spread is 17 points, reflecting average sector correlations on particularly weak market days. Again, it is generally desirable in a healthy market to see low correlations and a top-bottom spread of at least 20 points.
5. Technology displays the best all-weather combination of Outlook/Bull/Bear scores, while Telecom and Consumer Services/Discretionary are the worst. Looking at just the Bull/Bear combination, Healthcare is the leader, followed by Energy, indicating superior relative performance (on average) in extreme market conditions (whether bullish or bearish). Telecom is no longer the lowest after showing some relative strength this week, and now Industrial shows the worst Bull/Bear combo score, followed by Financial, indicating general investor avoidance during extreme conditions in these sectors.
6. Overall, this week’s fundamentals-based Outlook rankings again look slightly to the bullish side of neutral to me, mainly because the top four Outlook scores also display the strongest Bull scores.
These Outlook scores represent the view that the Technology and Healthcare sectors are relatively undervalued, while Telecom and Consumer Services/Discretionary may be relatively overvalued based on our 1-3 month forward look.
Stock and ETF Ideas:
Our Sector Rotation model, which appropriately weights Outlook, Bull, and Bear scores in accordance with the overall market’s prevailing trend (bullish, neutral, or bearish), suggests holding Technology, Healthcare, and Energy (in that order) in the prevailing neutral climate. (Note: In this model, we consider the bias to have moved to neutral from a rules-based standpoint because SPY has fallen below its 50-day simple moving average while remaining above its 200-day SMA.)
Other highly-ranked ETFs from the Technology, Healthcare, and Energy sectors include PowerShares Dynamic Semiconductors Portfolio (PSI), Market Vectors Biotech ETF (BBH), and Market Vectors Oil Services ETF (OIH).
For an enhanced sector portfolio that enlists top-ranked stocks (instead of ETFs) from within Technology, Healthcare, and Energy, some long ideas include Google (GOOGL), Western Digital (WDC), Pharmacyclics (PCYC), Jazz Pharmaceuticals (JAZZ), Tesoro Logistics LP (TLLP), and CVR Energy (CVI). All are highly ranked in the Sabrient Ratings Algorithm and also score within the top two quintiles (lowest accounting-related risk) of our Earnings Quality Rank (a.k.a., EQR), a pure accounting-based risk assessment signal based on the forensic accounting expertise of our subsidiary Gradient Analytics. We have found it quite valuable for helping to avoid performance-offsetting meltdowns in our model portfolios.
However, if you think the market will bounce soon and you prefer to maintain a bullish market bias, the Sector Rotation model suggests holding Technology, Energy, and Healthcare (in that order). But if you have a bearish outlook on the market, the model suggests holding Utilities, Healthcare, and Technology (in that order).
Disclosure: Author has no positions in stocks or ETFs mentioned.
Disclaimer: This newsletter is published solely for informational purposes and is not to be construed as advice or a recommendation to specific individuals. Individuals should take into account their personal financial circumstances in acting on any rankings or stock selections provided by Sabrient. Sabrient makes no representations that the techniques used in its rankings or selections will result in or guarantee profits in trading. Trading involves risk, including possible loss of principal and other losses, and past performance is no indication of future results.