Sector Detector: Searching for solid support in the face of global headwinds
Uncertainty about the health of the global economy led investors to flee U.S. equities during Q3, primarily driven by worries about China's growth prospects and the Federal Reserve’s decision to not raise rates. Sure, there are plenty of real and perceived headwinds, but on balance it seems that a recession here at home is not in the cards. And when you consider sentiment and the technical picture, it appears that a continuation of Friday’s bounce is in store. The question remains as to whether the seasonally strong Q4 will be able to propel the bulls through levels of resistance that have built up.
In this weekly update, I give my view of the current market environment, offer a technical analysis of the S&P 500 chart, review our weekly fundamentals-based SectorCast rankings of the ten U.S. business sectors, and then offer up some actionable trading ideas, including a sector rotation strategy using ETFs and an enhanced version using top-ranked stocks from the top-ranked sectors.
Market overview:
On a total return basis, the S&P 500 large caps fell -6% during Q3, and mid- and small-cap stocks also struggled as the S&P 400 and the S&P 600 fell -8% and -9% during the quarter, respectively. Defensive strategies outperformed, and defensive sector Utilities held up the best, while Energy and Basic Materials struggled in the face of falling commodity prices.
Global headwinds are evident, particularly in China, but even our domestic data shows weakness. ISM manufacturing report last week was barely above 50, and New Orders and Backlogs are quite weak. And then the monthly employment report disappointed. Looking at the imminent Q3 earnings reports from among S&P 500 companies, estimated earnings are expected to fall -4.7% quarter-over-quarter (the first decline since 3Q2009), while revenues are expected to fall -2.8% from last year (which would be the third quarter in a row with declines). The best reports are expected to come from Consumer Discretionary, Telecom, and Healthcare.
The numbers are growing among those forecasting either a recession or a bear market, or both. For example, Doubleline Capital’s Jeffrey Gundlach thinks risk assets like stocks and junk bonds are quite vulnerable to the downside right now.
But on the other hand, household incomes and purchasing power are up. Median household income (adjusted for inflation) grew in August to a post-recession high of nearly $56k. And jobless claims are at the lowest level since 1973 as layoffs are few and far between. Auto sales are accelerating toward record levels, hitting an annualized rate of 18.2 million in September, which is near record levels, and the average new-car price paid is about $31k. Global monetary policy remains accommodative -- including in the U.S. -- and it will remain so even if the Fed starts raising the fed funds rate. Banks are well capitalized. Corporate coffers are flush with cash. Homebuilders are doing well, with rising sales in both residential and commercial properties.
Nevertheless, with the focus on jobs numbers and inflation, fed funds futures are forecasting only a 31% chance of a quarter-point rate hike in December. The 10-year yield closed Friday at 1.99%. Put in context, its 52-week range is 1.65-2.49%. The iShares 20+ Year Treasury Bond ETF (TLT), rose more than 5% during Q3.
Even with recent bouts of market weakness, volatility has not been rising much. The CBOE Market Volatility Index (VIX), a.k.a. fear gauge, closed Friday at 20.94, which is barely above the 20 panic threshold. Some institutional portfolio managers see this as an indication of a continuation to the stock rally.
To be sure, bulls will need to muster the troops, bolster bullish conviction, and get some increased volume going in order to take stocks higher.
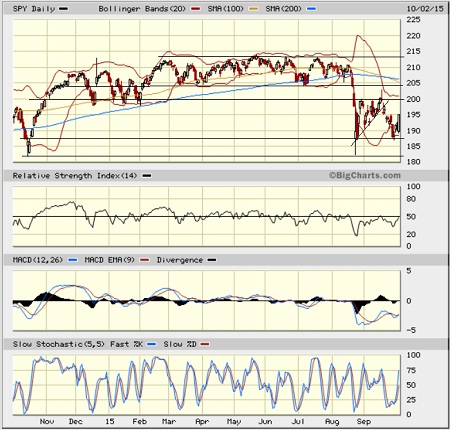
SPY chart review:
The SPDR S&P 500 Trust (SPY) closed Friday at 195. Of course, SPY remains well below its 200-day simple moving average, and the dreaded death cross remains intact (the 50-day SMA crossed down through 200-day in early September). But after some needed backing-and-filling and testing of support around 187, Friday’s trading gave us a bullish engulfing candlestick, and indeed Monday has brought a strong continuation to the upside. The 200 price level (corresponding to 2,000 on the S&P 500) was tested for resistance three times, and it is likely we will soon see another retest. If bulls can break through, the 204 level (former support line for the long sideways consolidation from February through late-August) is the next level of tough resistance. Oscillators RSI, MACD, and Slow Stochastic are pointing up bullishly. If SPY can’t break these resistance levels, we might see another retest of support at the August intraday low near 182. But in any case, I suspect the bulls will find a way to take this market higher by year end. Overall, the chart is shaping up a lot like 1998 and 2011.
Latest sector rankings:
Relative sector rankings are based on our proprietary SectorCast model, which builds a composite profile of each equity ETF based on bottom-up aggregate scoring of the constituent stocks. The Outlook Score employs a forward-looking, fundamentals-based multifactor algorithm considering forward valuation, historical and projected earnings growth, the dynamics of Wall Street analysts’ consensus earnings estimates and recent revisions (up or down), quality and sustainability of reported earnings (forensic accounting), and various return ratios. It helps us predict relative performance over the next 1-3 months.
In addition, SectorCast computes a Bull Score and Bear Score for each ETF based on recent price behavior of the constituent stocks on particularly strong and weak market days. High Bull score indicates that stocks within the ETF recently have tended toward relative outperformance when the market is strong, while a high Bear score indicates that stocks within the ETF have tended to hold up relatively well (i.e., safe havens) when the market is weak.
Outlook score is forward-looking while Bull and Bear are backward-looking. As a group, these three scores can be helpful for positioning a portfolio for a given set of anticipated market conditions. Of course, each ETF holds a unique portfolio of stocks and position weights, so the sectors represented will score differently depending upon which set of ETFs is used. We use the iShares that represent the ten major U.S. business sectors: Financial (IYF), Technology (IYW), Industrial (IYJ), Healthcare (IYH), Consumer Goods (IYK), Consumer Services (IYC), Energy (IYE), Basic Materials (IYM), Telecommunications (IYZ), and Utilities (IDU). Whereas the Select Sector SPDRs only contain stocks from the S&P 500, I prefer the iShares for their larger universe and broader diversity. Fidelity also offers a group of sector ETFs with an even larger number of constituents in each.
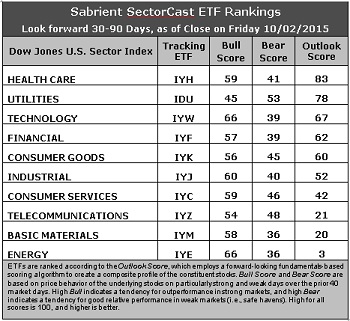
Here are some of my observations on this week’s scores:
1. Healthcare remains in the top spot this week with an Outlook score of 83, as the pullback in prices has boosted the forward P/E to a little over 16x (down from 17x). Also, the sector shows net positive sentiment among Wall Street analysts (net revisions to earnings estimates). Even though the overall trend continues to be skewed toward reductions to forward estimates, a lack of cuts, even without a strong upside bias, earns a sector a good relative score. Forward long-term growth rate and return ratios are also solid. Utilities has moved into second ahead of Technology holds the second spot with a score of 78 on the strength of the most positive sentiment among both Wall Street analysts and insiders (open market buying), as well as a reasonable forward P/E. Technology, Financial, and Consumer Goods (Staples/Noncyclical) round out the top five, followed by Industrial and Consumer Services (Discretionary/Cyclical). Financial continues to display the lowest forward P/E (less than 14x).
2. Energy remains at the bottom with an Outlook score of 3 as the sector scores among the worst in all factors of the GARP model across the board. In particular, the sector still shows an increasingly negative forward long-term growth rate and low return ratios, as well as the highest forward P/E (over 23x). (However, note that the refining & marketing segment remains an area of strength within the sector, with some having forward P/Es under 10x.) Basic Materials takes the other spot in the bottom two with an Outlook score of 20 (slightly worse than Telecom at 21) despite a low forward P/E (under 15x).
3. Looking at the Bull scores, Energy and Technology share the top score of 66, while Utilities is the lowest at 45. The top-bottom spread has widened to 21 points, which reflects low sector correlations on particularly strong market days, which is good. It is generally desirable in a healthy market to see low correlations reflected in a top-bottom spread of at least 20 points, which indicates that investors have clear preferences in the stocks they want to hold (rather than broad risk-on behavior).
4. Looking at the Bear scores, Utilities displays the top score of 53, which means that stocks within this sector have been the preferred safe havens (relatively speaking) on weak market days. However, this score is down substantially from 73 several weeks ago. Basic Materials and Energy score the lowest at 36, as investors flee these sectors during market weakness. The top-bottom spread is 17 points, which reflects relatively low sector correlations on particularly weak market days, which is good. Ideally, certain sectors will hold up relatively well while others are selling off (rather than broad risk-off behavior), so it is generally desirable in a healthy market to see low correlations reflected in a top-bottom spread of at least 20 points.
5. Healthcare displays the best all-around combination of Outlook/Bull/Bear scores, while Energy is the worst. Looking at just the Bull/Bear combination, Technology and Consumer Services (Discretionary/Cyclical) are the best, although Consumer Services displays the better Bull/Bear balance, indicating superior relative performance (on average) in extreme market conditions (whether bullish or bearish), while Basic Materials is the worst.
6. After giving signs of growing bullishness two weeks ago, this week’s fundamentals-based Outlook rankings appear to have a neutral bias again, with defensive sectors Utilities and Consumer Goods (Staples/Noncyclical) in the top five, along with all-weather Healthcare and economically-sensitive Technology and Financial. Notably, our Net Revisors score, which reflects the outlook among Wall Street analysts, continues to show very little in the way of positive earnings revisions, which is worrisome. Keep in mind, the Outlook Rank does not include timing, momentum, or relative strength factors, but rather is a reflection of the fundamental expectations of individual stocks aggregated by sector.
Stock and ETF Ideas:
Our Sector Rotation model, which appropriately weights Outlook, Bull, and Bear scores in accordance with the overall market’s prevailing trend (bullish, neutral, or defensive), has reflected a defensive bias since August 20 and suggests holding Utilities, Consumer Goods (Staples/Noncyclical), and Healthcare, in that order. (Note: In this model, we consider the bias to be defensive from a rules-based trend-following standpoint when SPY is below both its 50-day and 200-day simple moving averages.)
Other highly-ranked ETFs in SectorCast from the Utilities, Consumer Goods (Staples/Noncyclical), and Healthcare sectors include PowerShares S&P SmallCap Utilities ETF (PSCU), PowerShares S&P Samll Cap Consumer Staples Portfolio (PSCC), and Health Care Select Sector SPDR Fund (XLV).
For an enhanced sector portfolio that enlists some top-ranked stocks (instead of ETFs) from within the top-ranked sectors, some long ideas from Utilities, Consumer Goods (Staples/Noncyclical), and Healthcare sectors include Southwest Gas Corp (SWX), New Jersey Resources Corp (NJR), Cal-Maine Foods (CALM), Snyder’s-Lance Inc (LNCE), Edwards Lifesciences (EW), and Cigna Corp (CI). All are highly ranked in the Sabrient Ratings Algorithm.
If you prefer to take a bullish bias, the Sector Rotation model suggests holding Technology, Healthcare, and Industrial, in that order. But if you prefer a neutral stance on the market, the model suggests holding Healthcare, Utilities, and Technology, in that order.
IMPORTANT NOTE: I post this information each week as a free look inside some of our institutional research and as a source of some trading ideas for your own further investigation. It is not intended to be traded directly as a rules-based strategy in a real money portfolio. I am simply showing what a sector rotation model might suggest if a given portfolio was due for a rebalance, and I may or may not update the information each week. There are many ways for a client to trade such a strategy, including monthly or quarterly rebalancing, perhaps with interim adjustments to the bullish/neutral/defensive bias when warranted -- but not necessarily on the days that I happen to post this weekly article. The enhanced strategy seeks higher returns by employing individual stocks (or stock options) that are also highly ranked, but this introduces greater risks and volatility. I do not track performance of the ETF and stock ideas mentioned here as a managed portfolio.
Disclosure: Author has no positions in stocks or ETFs mentioned.
Disclaimer: This newsletter is published solely for informational purposes and is not to be construed as advice or a recommendation to specific individuals. Individuals should take into account their personal financial circumstances in acting on any rankings or stock selections provided by Sabrient. Sabrient makes no representations that the techniques used in its rankings or selections will result in or guarantee profits in trading. Trading involves risk, including possible loss of principal and other losses, and past performance is no indication of future results.