Sabrient Baker's Dozen Performance: 2009 –2012
| Since January 2009 we have published an annual Baker's Dozen portfolio, a list of 13 top-ranked stocks exhibited "growth at a reasonable price"—GARP—that we believed would perform well during the year. The stocks, published at the beginning of the year, were among the highest ranked stocks in Sabrient's database, represented a cross-section of industries, and were meant to be held for the full 12 months. Since that first year the Baker's Dozen has outperformed the S&P 500 Index by an average of +12.9% per year—in up markets (2012 and 2009), sideways markets (2010), and turbulent markets (2011). The complete portfolios, with the annual performance, are shown below. Performance is summarized at the right, along with links to download the full reports. |
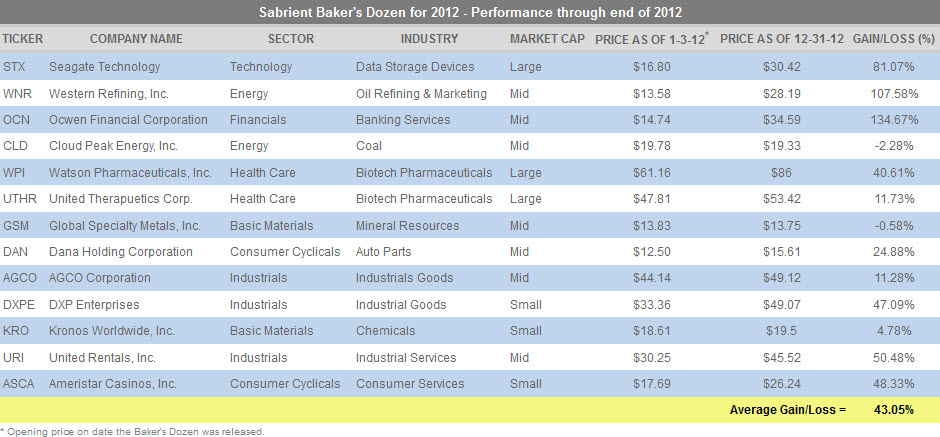
Current Portfolio – Baker's Dozen 2013 Past Reports: Scroll down to see portfolios and performance; click link to see the actual Baker's Dozen Report for that year. Baker's Dozen 2012 +43.05% Baker's Dozen 2011 + 7.28% Baker's Dozen 2010 +21.25% Baker's Dozen 2009 +35.50% |
| Sabrient Baker's Dozen for 2011 - Performance | |||||||
|---|---|---|---|---|---|---|---|
| TICKER | COMPANY NAME | SECTOR | INDUSTRY | MARKET CAP | PRICE ON 12-31-10* | PRICE AS OF 12/30/11 | GAIN/LOSS (%) |
| JBL | Jabil Circuit, Inc. | Mid | Technology | Electronics | $19.78 | $19.66 | -0.61% |
| MKSI | MKS Instruments, Inc. | Mid | Technology | Semiconductors & Components | $24.06 | $27.82 | 15.63% |
| GME | GameStop Corp. | Mid | Consumer Services | Retailing | $22.88 | $24.13 | 5.46% |
| ABG | Asbury Automotive Group, LTD | Small | Consumer Durables | Automotive Manufacturing | $18.48 | $21.56 | 16.67% |
| GIII | G-III Apparel Group, LTD | Small | Consumer Non-Durables | Clothing | $35.15 | $24.91 | -29.13% |
| SFD | Smithfield Foods, Inc. | Mid | Consumer Non-Durables | Food Processors | $20.63 | $24.91 | 20.75% |
| HS | Healthspring, Inc. | Mid | Healthcare | Undesignated Healthcare | $26.53 | $54.54 | 105.58% |
| MRO | Marathon Oil Corporation | Large | Energy | Oil | $22.01 | $29.27 | 32.99% |
| TSL | Trina Solar, LTD (ADR) | Mid | Energy | Alternative Energy | $23.42 | $6.68 | -71.48% |
| KMT | Kennametal, Inc. | Mid | Basic Industries | Precious Metals | $38.95 | $36.52 | -6.24% |
| EMN | Eastman Chemical Company | Large | Basic Industries | Chemicals | $41.04 | $39.06 | -4.82% |
| VIV | Vivo Participacoes, S.A | Large | Public Utilities | Telephone Utilities | $21.69 | $27.33 | 26.00% |
| AEL | American Equity Investment Life Holding Co. | Small | Finance | Insurance | $12.41 | $10.40 | -16.20% |
| Average Gain/Loss = | 7.28% | ||||||
| Sabrient Baker's Dozen for 2010 - Performance | ||||||
|---|---|---|---|---|---|---|
| TICKER | COMPANY NAME | SECTOR | INDUSTRY | PRICE ON 12-31-09 | PRICE AS OF 12/31/10 | GAIN/LOSS (%) |
| JRCC | James River Coal Co. | Energy | Coal | $18.49 | $25.53 | 38.07% |
| SNP | China Petroleum & Chemical Corp. | Energy | Oil & Gas | $88.07 | $95.69 | 8.65% |
| ANW | Aegean Marine Petroleum Network Inc. | Industrials | Transportation Infrastructure | $27.48 | $10.43 | -62.05% |
| JOYG | Joy Global, Inc. | Industrials | Machinery | $51.57 | $86.75 | 68.22% |
| ALK | Alaska Air Group, Inc. | Industrials | Airlines | $34.46 | $56.69 | 64.51% |
| CACC | Credit Acceptance Corp. | Financials | Consumer Finance | $42.10 | $62.77 | 49.10% |
| TRH | Transatlantic Holdings | Financials | Insurance | $52.11 | $51.62 | -0.94% |
| HUM | Humana Inc. | Healthcare | Healthcare Providers | $43.89 | $54.74 | 24.72% |
| SPH | Suburban Propane Partners LP | Utilities | Gas Utilities | $47.08 | $56.09 | 19.14% |
| TEO | Telecom Argentina S.A. | Telecom | Diversified Telecom Services | $16.82 | $24.89 | 47.98% |
| CRMT | America's Car-Mart Inc. | Consumer Discretionary | Specialty Retail | $26.33 | $27.08 | 2.85% |
| CORE | Core-Mark Holding Company, Inc. | Consumer Staples | Food & Staples Retailing | $32.96 | $35.59 | 7.98% |
| STEC | STEC, Inc. | Information Technology | Computers & Peripherals | $16.34 | $17.65 | 8.02% |
| Average Gain/Loss = | 21.25% | |||||
| Sabrient Baker's Dozen for 2009 - Performance | ||||||
|---|---|---|---|---|---|---|
| TICKER | COMPANY NAME | SECTOR | INDUSTRY | PRICE ON 12-31-10* | PRICE AS OF 12/30/11 | GAIN/LOSS (%) |
| DRC | Dresser-Rand Group Inc. | | Energy Equipment & Services | $17.25 | $31.61 | 83.25% | |
| AMG | Affiliated Managers Group Inc. | Financials | Capital Markets | $41.92 | $67.35 | 60.66% |
| DFG | Delphi Financial Group | Financials | Insurance | $18.44 | $22.37 | 21.31% |
| CMO | Capstead Mortgage Corp. | Financials | Real Estate Investment Trusts | $10.77 | $13.65 | 26.74% |
| CBST | Cubist Pharmaceuticals Inc. | Health Care | Biotechnology | $24.16 | $18.97 | -21.48% |
| AAWW | Atlas Air Worldwide Holdings Inc. | Industrials | Air Freight & Logistics | $18.90 | $37.25 | 97.09% |
| FWLT | Foster Wheeler | Industrials | Construction & Engineering | $23.38 | $29.44 | 25.92% |
| JOYG | Joy Global | Industrials | Machinery | $22.89 | $51.57 | 125.29% |
| AKAM | Akamai Technologies | Info Technology | Internet Software & Services | $15.09 | $25.34 | 67.93% |
| LDK | LDK Solar | Info Technology | Semiconductors & Equipment | $13.12 | $7.01 | -46.57% |
| IPHS | Innophos Holdings | Materials | Chemicals | $19.81 | $22.98 | 16.00% |
| CMP | Compass Minerals | Materials | Metals & Mining | $58.66 | $67.19 | 14.54% |
| CHL | China Mobile | Telcom | Wireless Telecom Services | $50.85 | $46.43 | -8.69% |
| Average Gain/Loss = | 35.5% | |||||