Sector Detector: Lackluster earnings reports put eager bulls back into waiting mode
Even with many of the global issues pushed off the front page, eager bulls found yet another reason to keep the troops in the barracks. The only newsworthy items are related to corporate earnings reports, which have been mixed at best, interspersed with the occasional spectacular report -- primarily from mega-caps like Google (GOOGL), Facebook (FB), or Amazon (AMZN). Some of the bulls have taken their chips off the table until after Labor Day, while others have merely scaled back to scalping some trades. Either way, stocks appear destined to thrash about for the rest of the summer.
In this weekly update, I give my view of the current market environment, offer a technical analysis of the S&P 500 chart, review our weekly fundamentals-based SectorCast rankings of the ten U.S. business sectors, and then offer up some actionable trading ideas, including a sector rotation strategy using ETFs and an enhanced version using top-ranked stocks from the top-ranked sectors.
Market overview:
Earnings season is off and running, and yes, some of the reports have been startlingly strong. Beyond the blowout numbers from mega-caps like Google, Facebook, and Amazon, we have heard the occasional terrific report from firms like Sabrient-favorite Valeant Pharmaceuticals (VRX). On the flip side, IBM (IBM), United Technologies (UTX) and Verizon (VZ) have disappointed. In any case, leadership has been narrowing, and market breadth is about the worst in the past 15 years.
Healthcare has been by far the best performing sector again this year, but Financials are starting to perk up. And looking forward, there is optimism that banks will do well in an environment of rising rates and a steepening yield curve.
Of course, given the strength of the US dollar, commodities across the board are in glut mode, with much weeping and gnashing of teeth in the Energy and Basic Materials sectors. Nevertheless, refiners of petroleum products are doing quite well, thank you, and enjoying strong operating margins. The “crack spread,” i.e., the difference between the cost paid for crude oil versus the price received for refined product has been very attractive. Sabrient favorites in the space include Tesoro (TSO), Valero Energy (VLO), and Marathon Petroleum (MPC).
Other than earnings, the other big news story is China’s stock market, which took a big -8% hit on Monday, its worst selloff in eight years, which led regulators to announce they will begin buying shares as a way to stabilize the market.
Of course, the Fed’s plan for making their first move with the fed funds rate is still a matter of interest, but it is certainly unclear as to when that might occur (despite the Fed’s desire to not surprise the markets with such actions). I myself have long thought it might not occur until next year, but recently I gave more credence to the possibility of a move this fall. The Fed seems to be signaling September, and most economists seem to think that’s the highest likelihood. But according to ConvergEx, the CME Fed Funds futures is indicating lower than 50% likelihood until December, and in fact, inflation and GDP growth are both indicative of a fragile economy that the Fed is unlikely to want to burden.
Bill Gross recently said that the Fed needs to just go ahead and raise the fed funds rate essentially to prove that the economy doesn’t really rely upon low rates to function. Hmmm. We shall see. And for his own part, Jeffrey Gundlach has predicted that a move won’t occur this year, and moreover, he thinks that the 10-year Treasury yield will soon fall again toward the 2% level. Note that the 10-year yield closed Friday at 2.27%, while the 30-year yield was at 2.97%.
The CBOE Market Volatility Index (VIX), a.k.a. fear gauge, closed last Friday at 13.74, but then on Monday it spiked above 16, which is back above the 15 fear threshold but still well below the 20 panic threshold that has held as resistance through the summer. In fact, S&P recently reported that with the exception of gold and oil, volatility is generally down across asset classes, and implied volatility in every equity market is below its 200-day simple moving average.
SPY chart review:
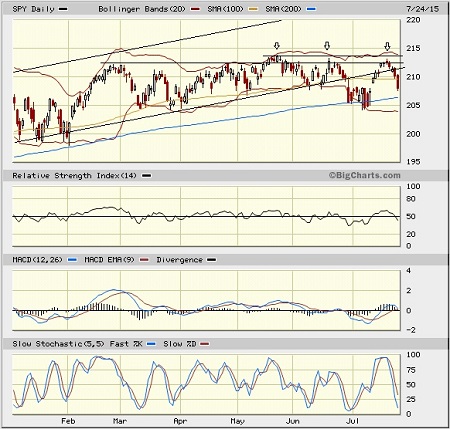
The SPDR S&P 500 Trust (SPY) closed last week at 208, but then fell on Monday to close at 206.79, where it is again probing historically solid support at the important 200-day simple moving average. As I suspected it would, the long-standing uptrend line was easily recaptured (after a brief hesitation), but recent news events once again brought the bears out in enough force to push price down once again. In effect, SPY succumbed to a triple top formation as shown (and in fact the Russell 2000 small cap index actually displays a more ominous head-and-shoulders pattern). Oscillators RSI, MACD, and Slow Stochastic are all pointed downward with more room to run to the downside. Major support is right here at current levels corresponding to the critical 200-day SMA (which is still rising bullishly, by the way), followed by earlier-in-year support at 205, then round-number support at the 200 price level.
Latest sector rankings:
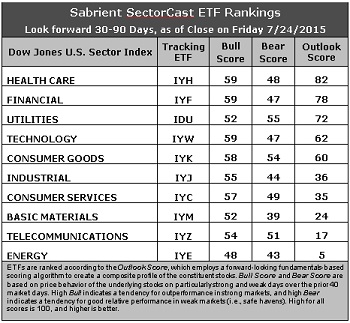
Relative sector rankings are based on our proprietary SectorCast model, which builds a composite profile of each equity ETF based on bottom-up aggregate scoring of the constituent stocks. The Outlook Score employs a forward-looking, fundamentals-based multifactor algorithm considering forward valuation, historical and projected earnings growth, the dynamics of Wall Street analysts’ consensus earnings estimates and recent revisions (up or down), quality and sustainability of reported earnings (forensic accounting), and various return ratios. It helps us predict relative performance over the next 1-3 months.
In addition, SectorCast computes a Bull Score and Bear Score for each ETF based on recent price behavior of the constituent stocks on particularly strong and weak market days. High Bull score indicates that stocks within the ETF recently have tended toward relative outperformance when the market is strong, while a high Bear score indicates that stocks within the ETF have tended to hold up relatively well (i.e., safe havens) when the market is weak.
Outlook score is forward-looking while Bull and Bear are backward-looking. As a group, these three scores can be helpful for positioning a portfolio for a given set of anticipated market conditions. Of course, each ETF holds a unique portfolio of stocks and position weights, so the sectors represented will score differently depending upon which set of ETFs is used. We use the iShares that represent the ten major U.S. business sectors: Financial (IYF), Technology (IYW), Industrial (IYJ), Healthcare (IYH), Consumer Goods (IYK), Consumer Services (IYC), Energy (IYE), Basic Materials (IYM), Telecommunications (IYZ), and Utilities (IDU). Whereas the Select Sector SPDRs only contain stocks from the S&P 500, I prefer the iShares for their larger universe and broader diversity. Fidelity also offers a group of sector ETFs with an even larger number of constituents in each.
Here are some of my observations on this week’s scores:
1. Healthcare has returned to the top spot with an Outlook score of 82, primarily due to favorable sentiment among Wall Street analysts (net upward revisions to earnings estimates) and a market-topping forward long-term growth rate. However, its forward P/E remains pricey. Financial takes second with a score of 78, primarily due to its low forward P/E. Utilities falls to third place with a score of 72, followed by Technology and Consumer Goods (Staples/Noncyclical). All five score above 60, and then there is a gap down to Industrial at 36 and Consumer Services (Discretionary/Cyclical) at 35. Thus, we have a two-tier ranking.
2. Energy remains at the bottom with an Outlook score of 5, while Telecom again takes the second spot in the bottom two with a 17. Both sectors score poorly in most factors of the GARP model across the board, although Telecom has enjoyed recent upgrades to earnings estimates.
3. Looking at the Bull scores, Healthcare, Financial, and Technology all share the top score of 59. Energy has the lowest Bull score of 48 and is the only one below 50. The top-bottom spread has narrowed to only 11 points, reflecting high sector correlations on particularly strong market days (i.e., broad risk-on buying). It is generally desirable in a healthy market to see low correlations reflected in a top-bottom spread of at least 20 points, which indicates that investors have clear preferences in the stocks they want to hold.
4. Looking at the Bear scores, Utilities displays the top score of 55, followed by Consumer Goods (Staples/Noncyclical), which means that stocks within these sectors have been the preferred safe havens (relatively speaking) on weak market days. Basic Materials scores the lowest at 39. The top-bottom spread is 16 points, which reflects moderate sector correlations on particularly weak market days. Ideally, certain sectors will hold up relatively well while others are selling off, so it is generally desirable in a healthy market to see low correlations reflected in a top-bottom spread of at least 20 points.
5. Healthcare displays the best all-around combination of Outlook/Bull/Bear scores, followed by Financial, while Energy is clearly the worst. Looking at just the Bull/Bear combination, Consumer Goods (Staples/Noncyclical) is the best, followed by Healthcare and Utilities, indicating superior relative performance (on average) in extreme market conditions (whether bullish or bearish), while Energy and Materials are the worst.
6. Overall, this week’s fundamentals-based Outlook rankings continue to look mostly neutral, with Utilities and Consumer Goods (Staples/Noncyclical) in the top five, well ahead of Consumer Services (Discretionary/Cyclical), Industrial, and Basic Materials. Keep in mind, the Outlook Rank does not include timing or momentum factors, but rather is a reflection of the fundamental expectations of individual stocks aggregated by sector.
Stock and ETF Ideas:
Our Sector Rotation model, which appropriately weights Outlook, Bull, and Bear scores in accordance with the overall market’s prevailing trend (bullish, neutral, or defensive), now reflects a neutral bias and suggests holding Healthcare, Financial, and Utilities in that order. (Note: In this model, we consider the bias to be neutral from a rules-based trend-following standpoint when SPY is below its 50-day but still above its 200-day simple moving average.)
Other highly-ranked ETFs in SectorCast from the Healthcare, Financial, and Utilities sectors include iShares Global Healthcare ETF (IXJ), PowerShares KBW Bank Portfolio (KBWB), and Guggenheim Invest S&P 500 Equal Weight Utilities ETF (RYU).
For an enhanced sector portfolio that enlists some top-ranked stocks (instead of ETFs) from within the top-ranked sectors, some long ideas from Healthcare, Financial, and Utilities sectors include Becton, Dickinson & Co (BDX), Valeant Pharmaceuticals (VRX), The Travelers Companies (TRV), SunTrust (STI), The AES Corp (AES), and Level 3 Communications (LVLT). All are highly ranked in the Sabrient Ratings Algorithm.
If you prefer to play a bounce and maintain a bullish bias, the Sector Rotation model suggests holding Healthcare, Financial, and Technology, in that order. But if you prefer a defensive stance on the market, the model suggests holding Utilities, Consumer Goods (Staples/Noncyclical), and Healthcare, in that order.
IMPORTANT NOTE: I post this information each week as a free look inside some of our institutional research and as a source of some trading ideas for your own further investigation. It is not intended to be traded directly as a rules-based strategy in a real money portfolio. I am simply showing what a sector rotation model might suggest if a given portfolio was due for a rebalance, and I may or may not update the information each week. There are many ways for a client to trade such a strategy, including monthly or quarterly rebalancing, perhaps with interim adjustments to the bullish/neutral/defensive bias when warranted -- but not necessarily on the days that I happen to post this weekly article. The enhanced strategy seeks higher returns by employing individual stocks (or stock options) that are also highly ranked, but this introduces greater risks and volatility. I do not track performance of the ETF and stock ideas mentioned here as a managed portfolio.
Disclosure: Author has no positions in stocks or ETFs mentioned.
Disclaimer: This newsletter is published solely for informational purposes and is not to be construed as advice or a recommendation to specific individuals. Individuals should take into account their personal financial circumstances in acting on any rankings or stock selections provided by Sabrient. Sabrient makes no representations that the techniques used in its rankings or selections will result in or guarantee profits in trading. Trading involves risk, including possible loss of principal and other losses, and past performance is no indication of future results.