Welcome!
If you've landed on this page, you are likely looking for the sample Scorecard mentioned in the final chapter of David Brown's book, Moon Rocks to Power Stocks: Proven Stock Picking Method Revealed by NASA Scientist Turned Portfolio Manager.
You've come to the right place!
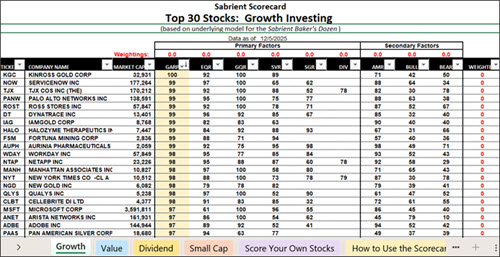
Created in Excel spreadsheet format, the Sabrient Scorecard for Stocks displays working lists of 30 top-ranked stocks for each of four investing strategies—Growth, Value, Dividend, and Small Cap. To find the top-ranked stocks, Sabrient follows the same algorithms used in the sample simulations described in the book.
For each stock, the Scorecard displays scores for 9 complex factors that David uses and allows you to perform your own factor weighting, sorting, evaluation, and selection process. In addition, there is a “Score Your Own Stocks” tab where you can enter tickers of your choosing to see how they stack up on the 9 complex factors.
Updated weekly, a subscription costs $20.00/month (or $200/year) and includes a bonus weekly ETF Scorecard.
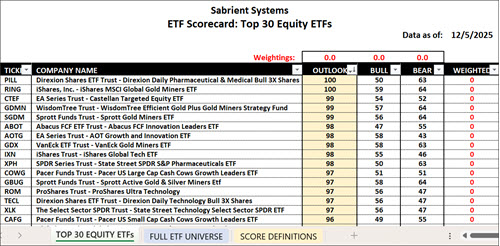
The ETF Scorecard, shown below, presents the 30 top-ranked equity ETFs using three factors:
- The Outlook score reveals the ETF's fundamental outlook based on GARP (growth at a reasonable price).
- The Bull score shows its relative strength during strong markets.
- The Bear score shows the ETF's strength during weak markets.
Our ecommerce site is currently transitioning to a new system. If you're interested in subscription, please email Sandra Bentley at Sandra@Sabrient.com, and she will notify you when it is available for subscriptions.