• Asset Managers

    Sabrient offers quantitative, qualitative, and hybrid solutions for alpha generation and risk management.

    Asset Managers

  • Wealth Managers & Financial Advisors

    Sabrient tools, research, and investment products enhance the investing experience for retail customers of brokerage firms, professional advisors, and private wealth managers.

    Wealth Managers

  • Fund Issuers

    We create niche and macroeconomic index strategies for providers of ETFs and mutual funds.

    Fund Issuers

  • Sector Detector

    Market analysis, technical analysis of the S&P 500, and SectorCast ETF rankings, written by Scott Martindale.
     

    Sector Detector

  • Individuals Investors

    We offer research, rankings, and tools on equities and ETFs for individual investors.

    Individuals

Sabrient Launches New QES Quality Index Series

June 24, 2026:  Sabrient Systems has launched the Sabrient QES Quality Index Series (QES stands for “Quantitative Equity Solutions”). The 6 most timely of these indexes are listed below. Each employs a 100% rules-based strategy to rank the relevant universe and select stocks according to Sabrient's proprietary quantitative factors, reconstituted quarterly and rebalanced to equal weights.

1. Sabrient QES High-Quality Energy Index (SBRHQE)
2. Sabrient QES High-Quality Healthcare Index (SBRHQH)
3. Sabrient QES High-Quality Value Index (SBRHQV)
4. Sabrient QES High-Quality SMID Growth Index (SBRQSM)
5. Sabrient QES High-Quality Growth and Income Index (SBRQGI)
6. Sabrient QES High-Quality Defensive Equity Index (SBRQDE)

For more information, click here.


Moon Rocks to Power Stocks

David Brown’s latest book, Moon Rocks to Power Stocks: Proven Stock Picking Method Revealed by NASA Scientist Turned Portfolio Managertells you more about our process-driven, active-selection methodology. The book teaches how to methodically and strategically build wealth in the stock market for four distinct investing styles—Growth, Value, Dividend, and Small Cap.

Along with the book purchase ($4.95) you also get two Bonus Reports on the history and new opportunities in: 1) Energy and 2) Space Exploration, including our top stock picks for each—all in PDF format.

To access the Sabrient Stocks and ETF scorecards directly visit: https://www.moonrockstopowerstocks.com/sabrient-scorecard. These investor tools provide access to our Top 30 stocks each week for the Growth, Value, Dividend, and Small Cap investing styles, along with our proprietary scores to facilitate idea generation and portfolio monitoring.


Scott Martindale


  by Scott Martindale
  CEO, Sabrient Systems LLC


Quick note: Sabrient’s new Q3 2026 Baker’s Dozen Portfolio will launch on Monday 7/20 as a 15-month portfolio with a mid-cap bias and a diverse group of 13 stocks across 8 business sectors, including several under-the-radar names. Notably, the next-to-terminate Q2 2025 Baker’s Dozen shows a gross total return of +54.7% from its inception date of 4/17/25 through 7/10/26, vs. +45.6% for SPY. Until 7/17, the Q2 2026 portfolio remains in primary market for new investment. Its top performers so far are Seagate Technologies (STX), Roku (ROKU), and AbbVie (ABBV).

Overview

During Q2 2026, the S&P 500 and Nasdaq Composite indexes posted their best quarter since the pandemic recovery in 2020, rising +14.9% and +21.4%, respectively, driven by AI-related chip stocks, as the resilient bull market powers on. And encouragingly, market breadth expanded nicely as the Russell 2000 small cap index was up +21.4% (following a flat +0.9% Q1), giving it its best H1 since 1991 (+22.6%) as investors sought to broaden their exposure into growing companies poised to benefit from the One Big Beautiful Bill Act’s (OBBBA) tax policies, deregulation, and incentives.

After ChatGPT arrived in November 2022, the market was all about AI-dominant Big Tech, creating hyperscale, and spending unprecedented capex (consuming all the hyperscalers’ massive cash flow, plus some new debt) that drove a 150% gain in the Nasdaq over the ensuing 3.5+ years (annualizing around 30%/yr). But so far this year, the “S&P 493” have vastly outperformed the MAG7 (which peaked on 5/14 and then sold off 15% by 6/26 before bouncing), and investors have invited small caps—and other “trickle down” industries benefiting from massive AI capex—to join the party, despite the event-driven oil price shock, inflation spike, and rising Treasury yields. But Treasury yields are likely being driven more by the hawkish Fed talk than from concerns about structural inflation, and although the coast isn’t entirely clear of macro hurdles, it would be highly unusual for this broadening advance to spell the end of the bull market.

In my full commentary below, I discuss:

1. The trend in consumer sentiment vs. stock prices
2. AI capex and power demand
3. Fundamental tailwinds and the impact on China
4. The “SaaSpocalyse” and what happens next
5. Global liquidity concerns
6. Status and outlook for GDP, inflation, jobs, and productivity
7. My final comments section on stanching the insidious rise of socialism in this country
8. Sabrient’s sector rankings, positioning of our sector rotation model, and some top-ranked ETF ideas

Investor preferences even within Big Tech are definitely rotating. Suddenly, Apple (AAPL) has caught up with Alphabet (GOOGL) as the top performing MAG7 stocks YTD. Apple is expanding its relationship with Broadcom (AVGO) in a $30 billion chipmaking deal to produce more than 15 billion chips in the US, including expansion of Broadcom’s Fort Collins, CO facility. There are now 13 stocks in the $1 trillion market cap club—the MAG7 plus tech sector comrades Taiwan Semi (TSM), Broadcom (AVGO), SpaceX (SPCX), and Micron (MU), along with financial Berkshire Hathaway (BRK-B) and healthcare name Lilly & Co (LLY).

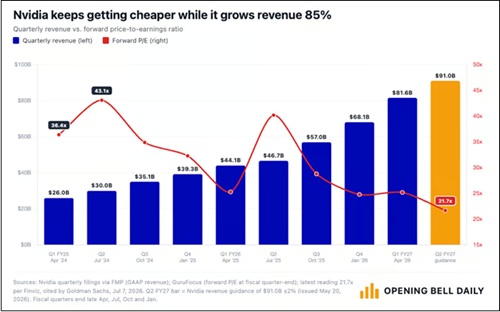
Meanwhile, previous investor darling NVIDIA (NVDA) is now trading at its lowest multiple since 2019. Despite posting an 85% YoY increase in revenue, hitting a whopping $81.6 billion last quarter, share price has been flat such that its forward P/E at around 22x is on par with the broad S&P 500’s composite forward P/E. Compare that to its 5-year average of 72x. The chart below is from Phil Rosen of Opening Bell Daily.

NVIDIA growth trend

After pulling back nearly 20% from its all-time high on 5/14, NVIDIA has recovered some ground and is up about +13% YTD, but rival Advanced Micro (AMD) is up +160% and Intel (INTC) is up +200% over the same timeframe, with forward P/Es around 75x and 125x, respectively. More broadly, according to Morgan Stanley, the P/E premium for the MAG7 versus the other S&P 493 has compressed from above 30% to roughly 10%. I suppose investors don’t see how it can continue to achieve such amazing growth and huge margins, which are attracting more competition in the space. Regardless, analysts continue to raise estimates, and NVIDIA should remain a growth juggernaut for the foreseeable future—particularly with hyperscaler capex (much of which buys NVIDIA products) projected to reach $1 trillion in 2027.

Incredibly, although NVIDIA lost around $1 trillion in market cap during its May-June correction, it is now back above $5 trillion in market cap and is the world’s largest company—on par with Germany’s entire nominal GDP, which is the third-largest economy in the world behind the US and China. NVIDIA represents about 8.5% of the S&P 500 index market cap, and it is larger than: 1) the entire Russell 2000 small cap index ($3.5 trillion), 2) 6 of the world’s top 10 stock exchanges (including UK, France, Italy, India, and Spain); 3) 6 of the 11 sectors of the S&P 500 individually; and 4) the combined market cap of the S&P 500’s Materials, Real Estate, and Utilities sectors.

Broadening beyond the market’s biggest stocks is well in motion. Both the Russell 2000 small cap index (+20% YTD) and the Dow Jones Transportation Average (+18% YTD) have had their best start to a year since 1991. Financials, Healthcare, and Industrials all displayed outperformance versus the broad S&P 500 during June. Corporate profitability has been solid across industries, reflecting resilient demand, disciplined cost management, technological innovation, and sustainable productivity gains—not to mention the trillions of dollars in capex for the gradual onshoring/reshoring of manufacturing, much of it already underway. Net corporate income now accounts for 12.4% of GDP.

As I write about regularly, the outlook for inflation continues to improve, particularly given the many underlying global disinflationary trends. This week brings the June CPI/PPI numbers, which I expect will be lower—although the resumption this month in hostilities in Iran and the resultant jump in oil and gasoline prices might signal some inflationary pressures for the July metrics and cause investors (and the Fed) to hold off on any celebration. Notably, seven OPEC+ countries (Saudi Arabia, Russia, Iraq, Kuwait, Kazakhstan, Algeria, and Oman) agreed to increase oil production by a combined 188,000 barrels per day starting in August. But beyond that announcement, supply chains have rapidly diversified in response to the Strait of Hormuz bottleneck—and what the International Energy Agency (IEA) has called “the largest supply disruption in history”—such that it is no longer strangling the global economy, as I discussed in my April post. Indeed, this was long overdue as Iran has not been a reliable observer of the “right of transit passage” in narrow international straits under the UN Convention on the Law of the Sea (UNCLOS) in 47 years.

In my full commentary below, I discuss the divergence between poor consumer sentiment versus strong advisor sentiment and a rising stock market, as well as the shift in focus from both the federal government and institutional investors into hard assets and infrastructure. Moreover, through the end of this decade and likely beyond, I expect to see smaller government and less low-ROI government spending in favor of more high-ROI capital allocation from an unleashed private sector as the primary engine of organic economic growth through fiscal support like favorable tax policy, deregulation, and other supply-side incentives for reshoring/onshoring to increase productive capacity.

This should lead to strong real GDP growth, a peace dividend, rising productivity and a resumption in other disinflationary trends that bring back inflation under 2.5%, and a new “hands-off” Federal Reserve under new chairman Kevin Warsh that aims for less market intervention and does not fear that robust economic growth (aka “overheated” or “above trend”) fuels inflation. Instead, Warsh believes as I do that inflation in general is driven by excessive monetary expansion and deficit spending (including massive spending bills, “helicopter money,” and QE), rather than by a strong and productive private economy.

As such, I still think the S&P 500 might hit 8,000 by year end, although I also think gold, silver, copper, and bitcoin remain long-term accumulation plays, even though they might see further near-term headwinds (e.g., war, a hawkish Fed, and a strong dollar). Given the market broadening beyond the Big Tech titans, and assuming the Fed does not become overly hawkish, we continue to see opportunities in active stock selection, small caps, and bond-alternative dividend payers.

Indeed, Sabrient’s Baker’s Dozen, Forward Looking Value, Small Cap Growth, and Dividend portfolios have been largely outperforming their benchmarks. Our latest Q2 2026 Baker’s Dozen Portfolio launched on 4/17 as a 15-month portfolio with a mid-cap bias and a diverse group of 13 stocks across eight business sectors. It remains in primary market until Friday 7/17, and then the new Q3 2026 Baker’s Dozen launches on Monday 7/20. And, as a reminder, our Earnings Quality Rank (EQR) is licensed as a quality prescreen to the actively managed, low-beta First Trust Long-Short ETF (FTLS), which now has over $2.4 billion in AUM.

Sabrient employs a variety of fundamental financial factors in our quantitative models and portfolio selection process. Sabrient Scorecards for Stocks and ETFs are investor tools that provide access to several of our proprietary models for idea generation and portfolio monitoring. To learn more, I invite you to visit https://MoonRocksToPowerStocks.com where you can download founder David Brown’s latest book (an Amazon international bestseller) and 2 bonus reports (on investing in the Future of Energy and Space Exploration)—all in PDF format—and start subscribing to the Scorecards, which make David’s process easy for idea generation and portfolio monitoring. They include our Top 30 stocks each week for 4 distinct investing strategies—Growth, Value, Dividend, and Small Cap. To go straight to the Scorecard subscription, go to: https://www.moonrockstopowerstocks.com/sabrient-scorecard

Here is a link to this post in printable PDF format. As always, I’d love to hear from you! Please feel free to email me your thoughts on this article or if you’d like me to speak on any of these topics at your event!  Read on….

Scott Martindale


  by Scott Martindale
  CEO, Sabrient Systems LLC


Today, I’d like to reprint a couple of brief excerpts you might have missed from my lengthy June Sector Detector post on 1) the public backlash to AI and 2) how the growing demand for electricity to power datacenters is being addressed in the face of NIMBYism.

And then in my Final Comments section, I share an inspiring message in honor of America’s 250th anniversary from The Rational Optimist Society on Substack, which believes human progress and innovation—most of which originated in the USA over those 250 years—consistently improve living standards for all.

Happy Independence Day!

Read on….

smartindale / Tag: AI, datacenter, data center, power generation, electricity, natural gas, nuclear, CVX, MSFT, SPCX, PL / 0 Comments

Scott Martindale


  by Scott Martindale
  CEO, Sabrient Systems LLC


This is a brief update to my June post, incorporating today’s Personal Consumption Expenditures (PCE) inflation readings for the month of May.

PCE came in at +4.07% YoY, PPI was up +6.42%, and May CPI came in at +4.17%. As illustrated by the upper chart below, this abrupt surge would be frightening if it were indicative of a structural problem in the global economy. However, we all know this is mostly event-driven due to disruptions to supply chains and the spike in oil, gas, and fertilizer prices from the Iran conflict and blockade of the Strait of Hormuz (with only 2–5 ships/day passing through the strait compared to 70 under normal conditions). As these supply chain pressures have begun to ease, crude oil has fallen from $108/bbl in mid-May to $72/bbl (WTI August futures) today.

So, when you exclude food and energy prices, Core PCE and Core CPI have managed to stay somewhat under control at +3.41% and +2.82%, respectively. Even more encouraging, looking at the lower chart showing 3-month rolling annualized averages, although headline PPI and CPI annualized trends are startlingly high, the core consumer inflation numbers are actually much lower. The annualized 3-month trends show Core PCE of +3.41%, Core CPI +2.82%, and “Trimmed Mean PCE” (new Fed chair Kevin Warsh’s preferred metric) +2.78%.  Click here to read on....

smartindale / Tag: inflation, GSCPI, CPI, PPI, PCE, Trimmed Mean PCE, Fed policy, Crude Oil, Truflation / 0 Comments

Scott Martindale


  by Scott Martindale
  CEO, Sabrient Systems LLC


Quick note: Sabrient’s new Small Cap Growth 52 Portfolio just launched on 6/17 as a 15-month portfolio holding 43 stocks across a range of sectors. It offers an alpha-seeking alternative to the broad small-cap indexes. Notably SCG 46 is the next to terminate on 7/22, and it currently shows a gross total return of +81% vs. +48% for its benchmark S&P SmallCap 600 Growth (SLYG), as well as 61% for Russell 2000 Small Caps (IWM), and +43% for S&P 500 (SPY), as of 6/22.

Overview

The resilient bull market continues to be powered by a compelling combination of technological innovation, robust corporate earnings, resilient consumer spending (despite energy and supply-driven inflationary pressures), and investor optimism around productivity-driven economic growth, despite ongoing macro uncertainties (there’s always something). Notably, the April rally off the market correction was broad-based, then May saw a marked narrowing with Tech the clear leader while most other sectors struggling (as bond yields surged, which hurts interest-rate sensitive industries), and now June has the market resuming its broadening efforts, as evidenced by price action (including a new high for the Russell 2000 small caps) and a convergence in forward P/E multiples (e.g., cap-weight S&P 500 falling, equal-weight S&P 500 and Russell 2000 small caps rising).

In my full commentary below, I discuss:

1. Relative valuations and the SpaceX-led parade of mega-IPOs on tap
2. GDP, inflation, jobs, and productivity
3. Fed policy in the new Kevin Warsh chairmanship
4. AI backlash, the realities, and how to address it
5. Datacenter power demand and the NIMBY problem
6. My final comments section on government versus private sector capital allocation and ROI
7. Sabrient’s sector rankings, positioning of our sector rotation model, and some top-ranked ETF ideas

As I discussed in my May post, valuations in the broad market indexes have been falling even as the market has surged, as earnings surged at an even faster rate. The equal-weight indexes have outperformed their cap-weight brethren, most notably in the Tech sector, with the MAG-7 badly underperforming the aggregate of everyone else in the sector. Who are the new leaders? Those benefiting from all the hyperscalers’ capex, including names like Sandisk (SNDK), Western Digital (WDC), Seagate Technology (STX), Micron (MU), Broadcom (AVGO), Dell (DELL), Vertiv (VRT), Quanta Services (PWR), EMCOR (EME), Arista Networks (ANET), Bloom Energy (BE), Comfort Systems (FIX), and Sterling Infrastructure (STRL)—many of which have been holdings in Sabrient’s quarterly Baker’s Dozen portfolios.

With the splashy IPO debut of Elon Musk’s SpaceX (SPCX), there are now 12 companies in the $1 trillion market cap club as of 6/19 [including lone non-Tech name Berkshire Hathaway (BRK-B]. And given the rest of the mega-IPO lineup expected this year, some commentators are suggesting a new Big Tech-leadership acronym, such as “MANGOS”—Meta, Anthropic, NVIDIA, Google, OpenAI, and SpaceX. Or the “AI Big 10” that adds Micron, AMD, and Broadcom to the existing MAG-7.

Many of the main headwinds of H1 seem to be finding resolution. The Iran conflict is apparently winding down, and oil price has tumbled from around $105/bbl at its May peak to below $75/bbl (front-month futures contract for WTI on NYMEX), which soon will be reflected in inflation metrics. Consumer spending and retail sales have held up despite falling real wage growth, and now the extremely poor consumer and investor sentiment metrics are showing nascent signs of improvement—although still far from the euphoria or “irrational exuberance” of the dot-com era. Also, the huge SpaceX IPO hit the market without any notable damage.

Overall, I still think fundamental tailwinds outweigh headwinds as investors position for continued AI progress, robust capex for AI, reshoring, and re-industrialization, looser Fed monetary policy, resurgence in global liquidity growth, and One Big Beautifull Bill Act (OBBBA) policies fully kicking in with its pro-growth policies like tax reform, deregulation, smaller government, pro-energy protocols, and broad support for the private sector to retake its rightful place as the primary engine of growth via re-privatization, reshoring, and re-industrialization, with much more efficient capital allocation and ROI than government.

Furthermore, this should continue to attract foreign capital into the US (“shadow liquidity,” much of which is not counted in M2), cut the debt and deficit-to-GDP ratio, and unleash organic private sector growth. Today’s valuations are reasonable, particularly given rising corporate earnings forecasts (now at +23% YoY for CY2026), but future stock valuations likely will be driven more by rising earnings and ROI than by AI hope-driven multiple expansion, particularly given the lingering macro uncertainties and the risk of higher interest rates.

In addition, aside from the oil and supply-driven disruptions that have temporarily goosed inflation metrics, many disinflationary trends are still in place, including the secular implementation of AI and automation, rising productivity, falling shelter costs, the deflationary impulse from a struggling China, a stable/rising dollar (up nearly 5% YTD), and slow M2 growth (about 4.7% vs. last year and 3.5% annualized over the past 3 years, vs. 6.0% pre-pandemic average since 1960). So, as supply chains are repaired and rerouted (as I discussed in my April post) and as oil prices and inflation recede, we could see some multiple expansion—to perhaps as high as 24x on the S&P 500 (after the recent contraction to below 22x on a next-12-months basis)—which would further support stocks. Indeed, the market seems to be setting up the next up leg. Every dip has been a buying opportunity. According to InvesTech Research, “Margin Debt as a percentage of nominal GDP shot up 9% in May, reaching a new all-time high.”

Q1 earnings reporting season was stellar, with robust YoY earnings growth, margins, and productivity, plus rising forward guidance and analyst earnings forecasts. Blended EPS growth across sectors was up 28% in Q1, led by Tech sector at 54%. Revenue growth was 11%, led by Tech at 16%. Profit margins were 15%, led by Tech at 29%. But because EPS growth has exceeded price performance, the P/E multiple has shrunk. The S&P 500 started the year at 6,845 and closed last week at 7,500. The latest Wall Street consensus for S&P 500 operating EPS is about $339 for 2026 (implied P/E of 22.1x based on $7,500 price) and $392 for 2027 (forward P/E of 19.1x on current price). Both are roughly 10% higher than at the start of the year. An official resolution to the Iran conflict and supply shock could allow for some multiple expansion, perhaps pushing the forward P/E to 24x—which implies the S&P 500 Index hitting 8,000 by year-end 2026 and potentially 9,300 by year-end 2027. Are these realistic targets? Not out of the question, in my view, although bouts of volatility along the way surely should be expected—perhaps severe pullbacks as price stretches from moving averages (like a rubberband).

As the S&P 500’s concentration in Big Tech has grown, its dividend yield has compressed to below 1.0%—reminiscent of the late-1990s and well below its multi-decade average around 1.7%—mainly because those high-growth Big Tech companies that dominate the cap-weight index don’t need to pay dividends to attract investors. Instead, investors are willing to pay up for strong growth and high margins, increasingly discounting a world in which AI becomes deeply embedded in business operations in a long-term secular investment cycle rather than short-term cyclical trend. And this is in spite of the elevated benchmark 10-year Treasury yield around 4.5%, which normally would suppress valuation multiples (on a discounted cash flow basis). Although Big Tech is largely immune to interest rate volatility, the smaller companies—into which the market is seeking to broaden—are not.

Furthermore, many uncertainties remain. Investors are concerned about the worrisome inflation prints, Fed policy under the new chairmanship, and the concise-but-vague MOU with Iran. Moreover, the long stretch of years in which demand for US stocks has far outstripped supply (“scarcity”) seems to be suddenly reversing. The line-up of mega-IPOs this year, pre-IPO shares coming out of lock-up, and Big Tech’s shift from using its massive cash flow for share buybacks to supplementing cash with new share issuances to instead fund historic levels of AI-related capex for datacenters, advanced compute hardware (chips, memory, servers), networking, and power infrastructure. According to Michael Gayed, the four largest hyperscalers (Meta, Alphabet, Microsoft, Amazon) spent $416 billion on capex in 2025 and have projected 2026 capex of $725 billion.
 
Concurrently, there is concern about Big Tech earnings quality and circular financing (e.g., NVIDIA investing in its customers who in turn buy NVIDIA’s GPUs), not to mention speculation on how soon all this massive AI spend will pay off (i.e., ROI) and what happens if and when the capex firehose dials down or shuts off. However, as the engraving in every convex passenger-side car mirror reminds us, “Objects in the mirror may be closer than they appear,” which certainly seems to be the case with AI as fundamentals are evolving much faster and impacting workflows much sooner than most anyone expected.

As for the Fed’s increasingly hawkish stance and rising odds of a rate hike (like the ECB just instituted), my view is that a hike won’t reduce the oil or food prices that are driving up the inflation metrics unless it induces an economic recession, which is not what the Fed or anyone wants to see. Assuming the Iran conflict is indeed coming to an end, inflation and interest rates likely have topped, with disinflationary structural trends resuming control and bonds catching a bid.

I remain of the belief that interest rate-sensitive segments of the economy, including housing, homebuyers, small businesses, and lower-income consumers, are already struggling with current financing and mortgage rates, offset only by the locked-in low interest rates from 2020-21, in a K-shaped economy, with higher income people doing well and spending, while lower income is being squeezed. For instance, higher income households have not reduced their driving habits at all, while most others have, and teenagers are having a hard time finding summer jobs due to all the older workers who have re-entered the workplace to supplement their retirement income. Moreover, the still-solid GDP growth metrics have been overly reliant on the combination of the AI race and its massive infrastructure spending, financed mostly on Big Tech cash flow than debt, plus unsustainable levels of fiscal deficit spending—i.e., around $1.9 trillion or 5.8% federal deficit-to-GDP, which includes $1 trillion in interest payments on 100% publicly held federal debt-to-GDP (and 123% total debt-to-GDP).

Notably, if you look solely at the primary deficit (excluding interest on debt), the ratio to GDP is 2.6% (20.1% spending minus 17.5% total revenue), which exceeds the 50-year historical average of 1.7% primary deficit-to-GDP ratio. If any of this spending slows, recessionary conditions might follow. In other words, we need all segments of the economy to flourish, and that can be supported by lower rates. And by the way, elevated inflation helps “inflate away” the debt as long as growth in real (after-inflation) GDP is positive (preferably strongly positive, like 2.5% or more) and exceeds growth in deficit spending, and interest rates remain contained (including any financial repression or yield curve control).

Having a hyper-financialized global economy means that rising rates could cripple debt-addicted businesses, governments (including our own federal government), and the housing market (which is critical for a healthy consumer). Sure, mortgage rates have been much higher in the past, but home prices today are based on a lower baseline of post-GFC easing and low rates. And given recent strengthening of the dollar, some emerging market economies with dollar-denominated debt may be forced into default. In other words, today’s global financial system simply can’t handle higher US interest rates.

Given the market broadening beyond the Big Tech titans, and assuming the Fed does not become overly hawkish, we continue to see opportunities in active stock selection, small caps, and bond-alternative dividend payers. Indeed, Sabrient’s Baker’s Dozen, Forward Looking Value, Small Cap Growth, and Dividend portfolios have been largely outperforming their benchmarks. Our latest Q2 2026 Baker’s Dozen Portfolio launched on 4/17 as a 15-month portfolio with a mid-cap bias and a diverse group of 13 stocks across eight business sectors. After two months, it is already off to a good start, up +9.5% vs. +5.1% for SPY and +3.6% for equal-weight S&P 500 (RSP), as of 6/22. Notably, last year’s Q1 2025 Baker’s Dozen terminated on 4/20 with a gross total return of +46.7% vs. +20.3% for SPY, and the next-to-terminate Q2 2025 portfolio is up +61% vs. +43% for SPY and +32% for RSP. And, as a reminder, our Earnings Quality Rank (EQR) is licensed to the actively managed, low-beta First Trust Long-Short ETF (FTLS) as a quality prescreen. FTLS now has $2.4 billion in AUM.

Sabrient employs a variety of fundamental financial factors in our quantitative models and portfolio selection process. Sabrient Scorecards for Stocks and ETFs are investor tools that provide access to several of our proprietary models for idea generation and portfolio monitoring. To learn more, I invite you to visit https://MoonRocksToPowerStocks.com where you can download founder David Brown’s latest book (an Amazon international bestseller) and 2 bonus reports (on investing in the Future of Energy and Space Exploration)—all in PDF format—and start subscribing to the Scorecards, which make David’s process easy for idea generation and portfolio monitoring. They include our Top 30 stocks each week for 4 distinct investing strategies—Growth, Value, Dividend, and Small Cap. To go straight to the Scorecard subscription, go to: https://www.moonrockstopowerstocks.com/sabrient-scorecard

Here is a link to the post in printable PDF format. As always, I’d love to hear from you! Please feel free to email me your thoughts on this article or if you’d like me to speak on any of these topics at your event!  Click here to continue reading my full commentary....

Scott Martindale


  by Scott Martindale
  CEO, Sabrient Systems LLC


With another graduation season upon us, I am publishing an updated and expanded version of my top career success tips—primarily targeted to new college graduates and young professionals, but really any young person entering the workforce. Whether you are just starting the interview process, or have your first job lined up, or are already underway in your career, there are certain behaviors, habits, attitudes, and actions you must know to succeed in today’s workplace. Even mid-career professionals, particularly those who are feeling a bit stuck in their careers, may benefit from what I have to share.

Over the course of more than 40 years of experience, observation, reading, reflection, and thousands of conversations, meetings, presentations, negotiations, and interactions while working within various organizations large and small, ranging from one of the largest multinational corporations to solo independent consulting to a small, entrepreneurial business, and in workplace situations ranging from corporate headquarters, to field operations locations, to virtual (home) offices, I have boiled it down to my top 12 tips for career success.

Of course, this is far from an exhaustive list. And I’m certainly not claiming to have leveraged them all to maximally benefit my own career (far from it). In fact, I wish I could go back in time and implement them more fully. My career surely would have progressed so much smoother. Believe me, I’ve made my share of mistakes—in career moves and interpersonal relationships, holding back when I should have gone for it, saying yes when I should have said no (or vice-versa), or inappropriately hitting reply-all (ugh).

Success habits are like any other type of skill—such as carpentry, surgery, chess, golf, public speaking, or writing—they can be learned, practiced, and improved. Adopting these behaviors also will enhance your appeal with employers, clients, and coworkers. They can even help you in your personal interactions like dating, community involvement, golf foursomes, and family life.

Getting by on the knowledge you learned in school or an internship is simply not enough to truly excel in the modern workplace, particularly given today’s mix of onsite, remote, and hybrid situations that make it even tougher to learn these critical concepts without fully experiencing the daily workplace interactions, politics, mentorships (whether formal or informal), and role-modeling of yore. That’s why it’s so important for you, the new graduate or young professional, to start your career with the right mindset, behaviors, and habits.

Many of these 12 tips likely are not what you heard at your graduation address. Hopefully, they can help jumpstart and smooth your path to career success. So, please share this article with all the recent graduates and young professionals in your life. Without further ado, here they are:

  1. Don’t burn bridges

  2. “Seek first to understand, then to be understood” (re: Steven Covey)

  3. Be a problem solver, not a problem creator

  4. Embrace a can-do spirit

  5. Operate with an owner’s mentality

  6. Never stop learning and growing

  7. Build your personal brand

  8. Become a skilled networker

  9. Find your moral compass

10. Practicality trumps passion (at first)

11. Take calculated, asymmetric risks (and be prepared to pivot)

12. Determine your own definition of success

Let’s dive into each of them….Click here

smartindale / Tag: career success tips, jobs, graduation, economy, skills, learning, networking / / 0 Comments

Scott Martindale

 
  by Scott Martindale
  CEO, Sabrient Systems LLC


Quick note 1: Sabrient’s new Dividend 56 Portfolio just launched on 5/6 as a 24-month portfolio holding 46 dividend-paying stocks across a range of market caps and sectors. It employs a Growth & Income strategy, offering a bond-like current dividend yield of 3.36% while seeking capital appreciation potential. Notably, the next-to-terminate Dividend 48 ends on 5/22 and currently shows a gross total return of +55% vs. +26% for S&P 500 High Dividend ETF (SPYD) and +44% for S&P 500 (SPY), as of 5/15.

Quick note 2: Sabrient employs a variety of fundamental financial factors in our quantitative models and portfolio selection process. Sabrient Scorecards for Stocks and ETFs are investor tools that provide access to several of our proprietary models for idea generation and portfolio monitoring. I invite you as well to visit https://MoonRocksToPowerStocks.com to immediately download founder David Brown’s latest book (an Amazon international bestseller) and 2 bonus reports (on investing in the Future of Energy and Space Exploration)—all in PDF format.

Overview

The market has been in parabolic mode—and it’s all about earnings, pricing power, and ROI (current and forward) rather than multiple expansion (or hope and prayers). As Bespoke Investment Group observed last week, following a 70% gain just since 3/31 the PHLX Semiconductor Index (SOX) was trading 36% above its 50-day moving average for only the third time in the past 30 years, with the other two occurring during the dot-com bubble. Moreover, the Nasdaq 100 (QQQ) was trading 15% above its 50-day moving average for the first time since 2009 (coming out of the GFC). However, today’s enthusiasm differs from prior speculative technology cycles in several ways. For instance, revenue growth tied to AI infrastructure has been tangible and substantial, particularly with datacenter businesses that fulfill the insatiable compute demand by housing high-density servers, GPUs, and networking equipment that act as the infrastructure backbone for cloud computing and AI training workloads. In other words, the rally is not being driven solely by narrative momentum like the dot-com boom—it is also driven by accelerating revenue generation and real cash flow and earnings.

Indeed, Q1 corporate earnings season has been particularly strong, beating even the most optimistic forecasts and providing big increases in forward guidance. Approximately 84% of S&P 500 companies have exceeded analyst profit expectations, representing the highest beat rate since 2021, according to FactSet. Large-cap companies, especially within Technology and Communications Services, continue to demonstrate operating leverage and strong margin resilience despite elevated interest rates and lingering inflationary pressures. According to DataTrek, “US Big Tech (ex-Nvidia) generated $183.4 bn in cash flow in Q1 2026 and spent $183.7 bn on CapEx and strategic investments….” We are entering a productivity boom, which is driving an historic earnings boom. Forward estimates are growing faster than they did in the mid-90s or late dot-com bubble years—and without having economic recovery comps to artificially boost them.

FactSet data shows that for Q1, with 89% of companies having reported, the S&P 500 in aggregate is showing a YoY earnings growth rate of +27.7% (the highest since +32.0% in Q4 2021). The sectors seeing the biggest increases are Information Technology (+50.7%); Communication Services (+48.8%); and Materials (+43.2%), while Healthcare trails with a negative growth rate of -3.1% (the only one negative). As for revenue growth, the aggregate is +11.4% YoY (the highest since +13.9% in Q2 2022), led by InfoTech at +29.2% and Comm Services at +15.0%. Moreover, analysts have increased their S&P 500 earnings estimate for CY2026 to $333.25—implying a P/E of 22.2x based on the closing price on 5/15. Thus the CY2026 EPS forecast suggests +21.3% YoY growth over CY2025 (vs. +17.1% expected as of 3/31, before the latest reports and guidance came out), and Tech is now indicating +38.7% YoY EPS growth (vs. +23.4% expected on 3/31).

Furthermore, according to FactSet, Q1 2026 net profit margin for the S&P 500 (aggregated bottom-up) is tracking toward a record high (since data began publication in 2009) of 13.9% vs. the 5-year average of 12.3%, as illustrated in the chart below from Phil Rosen of Open Bell Daily. Notably, 6 of the 11 sectors are tracking above their 5-year average. And looking ahead, net margin is expected to climb to 14.6% by Q3. According to DataTrek Research, ““Earnings growth drives the narrative around price/earnings ratios, but it is trends in structural profitability that actually change investors' perceptions of underlying value…. Index valuations are increasing as a result, a natural if underappreciated outcome related to these improvements…and supports the argument for a ‘recession proof’ US economy.”

Net profit margins history chart

The Buffett Indicator (total US stock market cap divided by GDP) has reached 230% of GDP, far beyond even the 2000 dot-com bubble. And yet because of extraordinary earnings reports and optimistic forward guidance, P/E multiples are actually falling. For example, the next-12-months forward P/E for the Technology Select Sector SPDR (XLK) is 27.6x, down from its peak above 31 last October. Meanwhile, the S&P 500 trades at only 22.0x, down from 23.5x in October.

As for inflation and interest rates, I continue to believe the Fed is missing the mark and should be more accommodative. Incoming Fed chair Kevin Warsh will confront an FOMC that largely believes monetary policy should be tighter, with higher fed funds rate in the face of rising inflation readings. However, as I explain in my full commentary below, the latest inflationary surge is an event-driven supply shock—i.e., supply chain disruptions in the Strait of Hormuz and the resulting oil price spike (illustrated by the surging Global Supply Chain Pressure Index)—rather than structural (i.e., an overheated economy and excess consumer demand), many interest-rate-sensitive segments of the economy are still struggling. I believe that the fed funds rate should be 3.0% and that the 10-year Treasury note yield will eventually retreat back down to around 4.0%.

In my full commentary below, I discuss stock patterns and valuations, the AI-driven earnings boom, the 4-layer AI “stack” and its major players, GDP, productivity, inflation, liquidity, and Fed policy. And in my Final Comments section I discuss why the Iran oil supply shock is a reason to better diversify oil supply routes and pursue nuclear energy—not give license to ramp up solar, wind, and batteries. Then I close with my usual update on Sabrient’s sector rankings, positioning of our sector rotation model, and some top-ranked ETF ideas.

Despite narrow market breadth, Big Tech remains a must-own for its amazing growth and safe haven sentiment among investors. Still, 2026 should continue to be a good year for active stock selection, small caps, and bond-alternative dividend payers (particularly since the dividend yield on the S&P 500 is down to just 1.03%). Indeed, Sabrient’s Baker’s Dozen, Forward Looking Value, Small Cap Growth, and Dividend portfolios have been largely outperforming their benchmarks. Each is packaged and distributed as a unit investment trust (UIT) by First Trust Portfolios (https://ftportfolios.com).

By the way, our new Q2 2026 Baker’s Dozen Portfolio just launched on 4/17 as a 15-month portfolio with a mid-cap bias and a diverse group of 13 stocks across 8 business sectors (InfoTech, Financials, Industrials, Healthcare, Consumer, Comm Services, Energy, and Materials). Notably, last year’s Q1 2025 Baker’s Dozen terminated on 4/20 with a gross total return of +46.7% (vs. +20.3% for SPY), and the next-to-terminate Q2 2025 portfolio is up +56% vs +42% for SPY (as of 5/15). And, as a reminder, our Earnings Quality Rank (EQR) is licensed to the actively managed, low-beta First Trust Long-Short ETF (FTLS) as a quality prescreen. It has over $2.3 billion in AUM.

Sabrient’s models and selection process seek high-quality companies with strong growth trends and expectations. Specifically, it identifies stocks that are fundamentally strong with a history of consistent, reliable, resilient, durable, and accelerating sales and earnings growth, positive revisions to Wall Street analysts’ consensus estimates, a history of meeting/beating estimates, rising profit margins and free cash flow, high capital efficiency (e.g., ROI), solid earnings quality and conservative accounting practices, a strong balance sheet, low debt burden, competitive advantage, a wide moat, and a reasonable valuation compared to its peers and its own history.

These are the factors Sabrient employs in our quantitative models and “quantamental” portfolio selection process. You can learn how to access several of our proprietary models for idea generation and portfolio monitoring through Sabrient Scorecards, as well as download Sabrient founder David Brown’s latest book (an Amazon international bestseller), by visiting this link: Moon Rocks to Power Stocks

Here is a link to this post in printable PDF format, where you also can find my latest Baker’s Dozen presentation slide deck. As always, I’d love to hear from you! Please feel free to email me your thoughts on this article or if you’d like me to speak on any of these topics at your event!  Read on….

No front page content has been created yet.

New Dividend UIT Launched November 6

November 6, 2025:  The 54th Sabrient Dividend UIT Portfolio (FSEIDX) was launched by First Trust Portfolios on November 6, 2025. This UIT seeks companies with above-average total return through a combination of dividend income and capital appreciation. The stocks are selected through an investment strategy process developed by Sabrient. The portfolio will terminate November 5, 2027. For more information, a prospectus, or a fact sheet, please visit First Trust Portfolios