Sector Detector: Optimism about tax reform gooses bullish sentiment
 By Scott Martindale
President, Sabrient Systems LLC
Another day, another new high in stocks. Some observers understandably think this is a sign of excessive complacency and a bad omen of an imminent major correction, as valuations continue to escalate without the normal pullbacks that keep the momentum traders under control and “shake out the weak holders,” as they say. But markets don’t necessarily need to sell off to correct such inefficiencies. Often, leadership just needs to rotate into other neglected segments, and that is precisely what has been happening since the mid-August pullback. Witness the recent leadership in small caps, transports, retailers, airlines, homebuilders, and value stocks, as opposed to the mega-cap technology-sector growth stocks that have been driving the market most of the year.
Yes, the cap-weighted Dow Industrials and S&P 500 have both notched their eighth straight positive quarter, and the Nasdaq achieved its fifth straight, and all of them are dominated by mega-cap stocks. And the new highs have just kept coming during the first week of October. But it’s the stunning strength in small caps that is most encouraging, as this indicates a healthy broadening of the market, in which investors “pick their spots” rather than just blindly ride the mega caps. Rising global GDP, strong economic reports, solid corporate earnings reports, and the real possibility of tax reform have all helped goose bullish sentiment.
Those of you who have read my articles or attended my live presentations on the road know that I have been positive on small caps and that the momentum trade so far this year and high valuations among the mega cap Tech stocks likely would become self-limiting, leading to a passing of the baton to other market segments that still display attractive multiples, particularly those that would benefit the most from any sort of new fiscal stimulus (including tax and regulatory reform), like small caps. Moreover, I believe that with a still-accommodative Federal Reserve moving cautiously on interest rates, and with strong global demand for US Treasuries and corporate bonds, the low-yield environment is likely to persist for the foreseeable future.
In this periodic update, I give my view of the current market environment, offer a technical analysis of the S&P 500 chart, review Sabrient’s latest fundamentals-based SectorCast rankings of the ten U.S. business sectors, and then offer up some actionable ETF trading ideas. In summary, our sector rankings still look bullish, while the sector rotation model also maintains its bullish bias, and the overall climate continues to look favorable for risk assets like equities. Although October historically has been a month that can bring a shock to the market, it also is on average one of the strongest months for stocks, and of course Q4 is seasonally a bullish period. Read on...
Market overview:
September proved to be another solid month despite its reputation as the weakest month of the year. The S&P 500 rose almost +4% during the month, while the Dow Industrials rose almost +5%, and NASDAQ rose 5.8%. Most major indexes have achieved a new all-time high. As of Friday’s close, the SPDR S&P 500 Trust (SPY) is +13.8% YTD, while the suddenly-strong Russell 2000 small cap index is +11.3%, essentially all of which has occurred just since the market turned and began to broaden on August 21. Meanwhile, after lagging for most of the year, S&P 500 Value greatly outperformed S&P 500 Growth during September, further demonstrating an expectation that solid economic fundamentals will persist. Among sectors, using the 10 US sector iShares, the top-performer YTD through Friday is Technology, up +26.6%, followed by Healthcare at +21.1%, boosted by a sudden resurgence over the past couple of weeks in the biotech segment, while Energy is the worst at -10.6%, followed by Telecom at -9.0%. The small-cap-dominated SPDR S&P Biotech ETF (XBI) was up +13% during Q3 alone and is now up nearly +50% YTD.
From a factor standpoint, S&P Dow Jones Indices has reported that during 3Q, High Beta, Growth, and Momentum factors all performed well, while Equal Weight underperformed. However, the last several weeks of the quarter saw the trend shift more toward Value and Equal Weight.
The CBOE Market Volatility Index (VIX), aka fear gauge, closed Friday at 9.65 and actually hit an all-time record closing low of 9.19 on Thursday. As a reminder, there hasn’t been a significant stock market correction since February 2016. Even during August’s brief bout of heightened volatility, VIX spiked above the 15 fear level but only peaked at 17.28, and never came close to the 20 panic level. I will continue to warn that although complacency can persist for a long time, the VIX is an oscillator, so it will eventually spike again – although some are now saying that once a metric becomes a trading vehicle (as VIX has), it uses its usefulness as a metric. I suspect that given the growing use of VIX futures, options, and ETFs, along with other active volatility strategies employed by big-money institutions, the VIX sees a lot of manipulation these days.
Moreover, the S&P 500 has not yet shocked investors this year with a 2% single-day move (in either direction), which is highly unusual. In fact, the last time a full year went by without having a 2% single-day move was 2005. Instead of selling off, the market has simply rotated into other segments.
Just when talking heads had pretty much written off any sort of tax reform any time soon, September saw a surprise Republican proposal that resurrected the so-called “Trump Trade,” including value oriented sectors and industries like industrials and banks, as well as small-cap domestic-oriented companies that could benefit most from tax reform. Energy stocks have rallied, partly on higher oil prices, but also because they stand to benefit from typically high effective tax rates, as do financials, utilities, and consumer staples companies. And from a cash repatriation standpoint, consider that as of its Q2 filing, Apple (AAPL) was holding a whopping $246 billion in cash with foreign subsidiaries, which represents the equivalent of 29% of its total market capitalization. Small caps, without typically having overseas tax havens, tend to pay higher effective tax rates, so they also should enjoy extra benefit from tax cuts. Although a tax bill still has a long ways to go and plenty of hurdles to cross, the mood on the street has been celebratory – so Congress had better not disappoint (yet again).
Retailers overall have bounced nicely, as well, particularly the dollar stores, mainly because they don’t have to compete head-to-head with the likes of Amazon.com (AMZN), like so many other retailers must. The weaker US dollar, which has been benefiting large-cap multinationals most of the year, has been making an attempt to strengthen, which also favors small caps.
Corporate earnings reports have been solid. 1H2017 saw 10% year-over-year EPS growth. Moreover, Q2 reports resulted in 70% of S&P 500 companies beating on sales estimates. And looking ahead, the consensus forecast for 2018 is anticipating another 10-12% earnings growth (or even more if we see corporate tax cuts enacted), which would imply an EPS for the S&P 500 of at least $147/share for next year and a forward P/E of 17.35x, based on Friday’s closing price for the index. This implies an earnings yield of 5.8%, which is quite healthy compared with today’s 10-year Treasury yield of 2.37%.
The economic data continues to look good, including unemployment, consumer sentiment, manufacturing, services, construction spending, retail sales, and vehicle sales. The job report on Friday showed a 4.2% unemployment rate, which is the lowest in over 16 years. Monthly auto sales reported the strongest annualized rate since 2005. U.S. factory activity rose to the highest level in 13 years. PMI Services beat expectations once again. ISM manufacturing and non-manufacturing indices both rose to their highest levels since 2004 and has been on a 13-month winning streak. The trade deficit fell as exports rose while imports fell. Real gross domestic product (GDP) rose at an annual rate of 3.1%, up from 1.2% in the second quarter, and the Atlanta Fed’s GDPNow model predicts Q3 to come in at 2.5% (as of Friday).
The Fed has already initiated a slow, cautious unwinding of its massive balance sheet of Treasuries and asset-backed securities – even while other major central banks like the BOJ and ECB continue with their QE. Still, the Fed has been quite clear that it will be vigilant about an undesirable flattening of the yield curve. (On a side note, it is truly amazing when you consider how much power the unelected position of Federal Reserve Chairman wields over the US and global economies, and by extension national elections and even global markets.) CME fed funds futures now place the odds of the next rate hike coming at the December meeting at 89% and only 1.4% odds of seeing two more rate hikes this year. The Fed has already begun unwinding its $4.5 trillion balance sheet as planned, which appears to have helped offset the downward pressure on long-term rates from global demand for the safety and yield of US Treasuries, at least for the moment, as the 10-year Treasury closed Friday at 2.37%. As it stands today, with the 2-year at 1.50%, the closely-watched 2-10 spread is now 87 bps, which is still well under the 100 bps threshold of “normalcy” and the 101 bps on Election Day, not to mention the relatively steep 136 bps spread achieved after the November election.
The strong economic data, rising corporate earnings, a still-accommodative Fed, low interest rates, an upsloping yield curve, and persistent caution (especially among institutions and hedge funds) suggest no recession on the horizon and a favorable climate for equities. To me, the biggest threats to stocks would be an outside shock, such as a military conflict with North Korea or a bursting of China’s credit bubble (including a massive devaluation of the yuan). China has become the most impactful country on global GDP growth and capital markets. However, despite a strong 1H2017 for China’s growth, its government has now deemed it necessary to tighten credit conditions, including higher interest rates and tighter capital controls, which will surely reduce economic growth to some extent, but rapidly rising debt-to-GDP has forced its hand.
Despite the strong economic reports and the possibility of tax reform, some investors were suddenly spooked on Friday by the surprising 2.9% spike in average hourly wages, which seems to indicate some actual wage inflation – the big laggard throughout our slow (aka “plow horse”) economic recovery that has held back CPI, much to the Fed’s chagrin, as they have helplessly watched years of ZIRP and QE do little more than drive asset price inflation – which has primarily benefited the wealthy.
There is no denying that the expanding wealth from rising asset prices is not being shared across the board. Average household income continues to languish while labor participation rates are low and 43 million Americans are on food stamps. The Fed’s (and other central banks’) monetary policies have facilitated rising asset prices while wages for the vast majority of workers have stagnated, with the logical outcomes of income inequality and a rapidly expanding wealth gap. The economic theories followed by the unelected FOMC would suggest that full employment leads to wage inflation as businesses compete for scarce workers. But in reality, most of the capital just sits in bank reserves with little multiplier impact, although some has been employed by corporate chieftains who have preferred to use the “cheap money” to simply buy back shares for a short-term boost rather than invest long term in capex. Complementary fiscal stimulus from our elected legislature might serve to create higher growth rates by finally clearing up the uncertainty around the new “rules of game” for capital investment, coaxing capital from the clutches of conservative corporate leaders.
Today, the wealthiest 1% of the populace now controls 39% of the wealth, which is an all-time high, according to the Fed’s Survey of Consumer Finances (SCF). With so many people of more modest means and various races and backgrounds finding themselves left out, they have looked for someone to blame, leading to divisiveness, nationalism, populism, and, yes, calls for socialism. I continue to be shocked and saddened by the growing numbers of millennials that have gravitated toward the socialist ideals of Big Government paternalism and the demonization of business, rather than embrace what made this country great in the first place – the Libertarian ideals of freedom, entrepreneurism, and self-reliance.
I meet many new immigrants in my travels who are industrious and choose to embrace these American ideals that attracted them to his country (often coming from truly oppressive situations). Many I have met work multiple jobs (e.g., Uber, restaurants, hotels, etc.) while going to school at night. They usually are amazed at the anger or apathy of so many Americans on the lower social rungs who hope only for a new government program. All economic systems can be subject to corruption, but the good thing about capitalism is that it can succeed and provide opportunity even if imperfect. For example, rather than rely on yet another bloated government bureaucracy to “fix” a forgotten, blighted, crime-ridden inner city, a recent article in Fortune magazine described what private enterprise is doing for places across the globe – such as in Detroit, where JPMorgan Chase (JPM) is orchestrating efforts to support “small-business development, job-skills training, and neighborhood revitalization, and deploying a ‘service corps’ of advisers….”
I also feel compelled to mention how annoying it can be to me personally that whenever something tragic or controversial happens in this country, the press puts a mic in front of the usual parade of music, TV, and movie celebrities to provide their (typically ultra-liberal) moral guidance, including the likes of Beyonce, Katy, Jimmy K., Rosie, LeBron, Meryl, Ellen, et al. I’m sorry, but I know so many smart, educated, well-read professionals, who may be doctors, lawyers, teachers, engineers, contractors, accountants, money managers, or business owners (both liberals or conservatives), whose insights I find so much more thoughtful and insightful than the shrill and single-minded show-biz crowd who toe the “Hollywood line.” Please spare me.
In my view, the immutable reality of the human condition, as demonstrated during the devastating hurricanes that recently invaded our shores, is that when we are put in distress without an all-powerful government there to save us, we always find a way to either bootstrap our way through it, or to band together to help one another survive it. But when we rely on government to alleviate our ills, it tends to make us weak, lazy, unproductive, and helpless. Instead, those with foresight and ambition will demand greater freedoms and fewer constraints on business formation and capital investment. After all, in a nation and world with growing populations, the only way to expand opportunities for greater individual wealth is to grow the economy faster than the population is growing. But forcing “fairness” through “soak the rich” wealth redistribution, expanding Big Government entitlements, and increasing business regulation is a path to economic stagnation and even greater misery in a worsening death spiral.
As I often discuss in this article, we must focus on the underlying cause of our sluggish growth and lack of attractive career opportunities rather than the symptoms. It is much like the doctor who only prescribes drugs to offset a patient’s poor health rather than demand the critical lifestyle changes in diet and exercise that would allow the patient to not only survive but strengthen and thrive. Freeing up capital to stimulate real economic growth creates more opportunities leading to broader prosperity, which is a far better way of curing societal ills than tying up capital in Big Government programs and social engineering. In a hyper-competitive global economy, rather than try to legislate fairness and opportunity, the better approach is to unleash the marketplace and entrepreneurism, which breeds those outcomes by economic necessity.
SPY chart review:
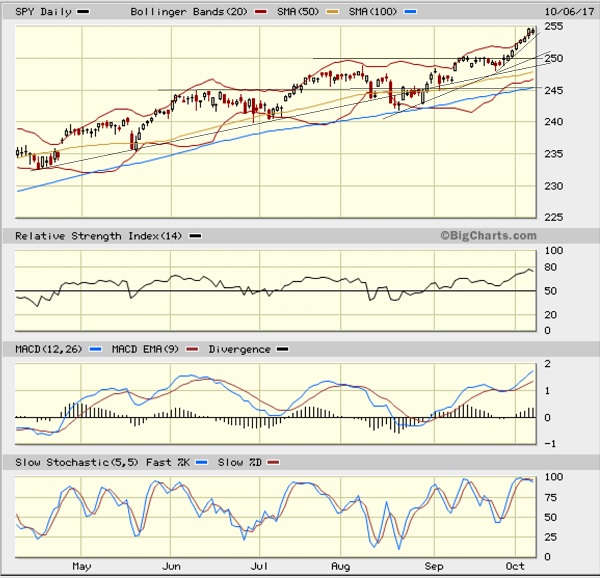
The SPDR S&P 500 ETF (SPY) closed Friday at 254.37 and managed to gather the necessary level of bullish conviction for a convincing breakout above the 250 level (corresponding to 2,500 on the S&P 500). In my previous article in early September, I commented that the technical picture looked healthy, especially if recent relative strength in risk-on market segments like small caps, biotechs, and retail can continue. And indeed, the healthy broadening action during the month, including leadership from those risk-on areas, resulted in a breakout on elevated volume. Now SPY is taking a breather to consolidate those gains on flat volume (and falling volume for Nasdaq and Russell 2000), which will allow the big divergence above the moving averages to close. Oscillators RSI, MACD, and Slow Stochastic are all overbought and looking to cycle back down. The 50-day SMA has been providing pretty solid support all year, with the 100-day coming into play to help out in August, and lately it has been the 20-day SMA, which is approaching 251. Support levels include various rising uptrend lines, the breakout levels at 250 and 245, the 50-day SMA at 248, the 100-day at 245, and the critical 200-day SMA (approaching 240). Note that the SPY hasn’t tested its 200-day SMA since the election. I expect the bullish sentiment and technical breakout to hold, unless some nasty news sends investors running for cover.
Latest sector rankings:
Relative sector rankings are based on our proprietary SectorCast model, which builds a composite profile of each of over 600 equity ETFs based on bottom-up aggregate scoring of the constituent stocks. The Outlook Score employs a forward-looking, fundamentals-based multifactor algorithm considering forward valuation, historical and projected earnings growth, the dynamics of Wall Street analysts’ consensus earnings estimates and recent revisions (up or down), quality and sustainability of reported earnings, and various return ratios. It helps us predict relative performance over the next 1-3 months.
In addition, SectorCast computes a Bull Score and Bear Score for each ETF based on recent price behavior of the constituent stocks on particularly strong and weak market days. High Bull score indicates that stocks within the ETF recently have tended toward relative outperformance when the market is strong, while a high Bear score indicates that stocks within the ETF have tended to hold up relatively well (i.e., safe havens) when the market is weak.
Outlook score is forward-looking while Bull and Bear are backward-looking. As a group, these three scores can be helpful for positioning a portfolio for a given set of anticipated market conditions. Of course, each ETF holds a unique portfolio of stocks and position weights, so the sectors represented will score differently depending upon which set of ETFs is used. We use the iShares that represent the ten major U.S. business sectors: Financial (IYF), Technology (IYW), Industrial (IYJ), Healthcare (IYH), Consumer Goods (IYK), Consumer Services (IYC), Energy (IYE), Basic Materials (IYM), Telecommunications (IYZ), and Utilities (IDU). Whereas the Select Sector SPDRs only contain stocks from the S&P 500, I prefer the iShares for their larger universe and broader diversity.
Here are some of my observations on this week’s scores:
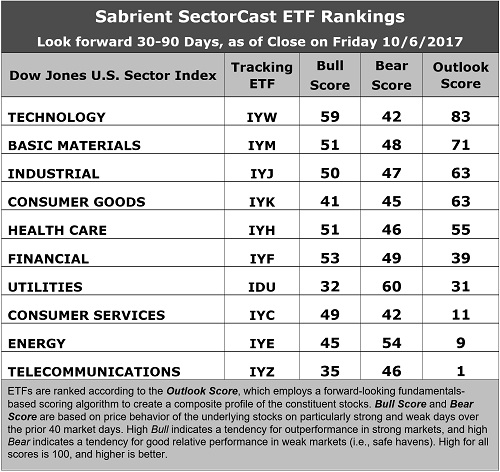
1. Technology maintains its hold of the top spot with an Outlook score of 83, followed by Basic Materials with a score of 71. Tech displays a strong projected EPS year-over-year growth rate of 15.1%, solid Wall Street sell-side analyst sentiment (i.e., net positive revisions to EPS estimates), the highest return ratios, and a low forward PEG of 1.20 (ratio of forward P/E to forward EPS growth rate). Basic Materials takes the second spot and boasts strong sentiment from both sell-side analysts and insiders, along with solid return ratios. Rounding out the top five are Industrial, Consumer Goods (Staples/Noncyclicals), and Healthcare, which all score 55 or above, which is impressive. Then there is a gap down to Financial at 39. With the market’s recent strength, mostly driven by an expectation of tax cuts that can improve EPS, the forward P/Es have risen significantly across the board.
2. Telecom and Energy continue to be the bottom dwellers with Outlook scores of 1 and 9, respectively. Both display generally weak scores across the board, including the highest forward P/Es (around 28x). However, Energy notably displays by far the best projected EPS year-over-year growth rate of 28.6%, and the lowest forward PEG of 0.98.
3. Looking at the Bull scores, Technology boasts the top score of 59 and continues to lead market rallies, followed by Financial at 53, as both have displayed relative strength on strong market days, while Utilities is the lowest at 32, followed by Telecom at 35. The top-bottom spread is 27 points, which reflects quite low sector correlations on strong market days, which is favorable for stock picking. It is desirable in a healthy market to see low correlations reflected in a top-bottom spread of at least 20 points, which indicates that investors have clear preferences in the market segments and stocks they want to hold (rather than broad risk-on behavior).
4. Looking at the Bear scores, we find Utilities at the top with a score of 60, followed by Energy at 54, which means that stocks within these sectors have been the preferred safe havens lately on weak market days. Energy might come as a bit of a surprise. Technology and Consumer Services (Discretionary/Cyclicals) share the lowest score of 42, followed by Consumer Discretionary (Services/Cyclicals), as investors have fled during market weakness. The top-bottom spread is 18 points, which reflects low sector correlations on weak market days, which is favorable for stock picking. Ideally, certain sectors will hold up relatively well while others are selling off (rather than broad risk-off behavior), so it is desirable in a healthy market to see low correlations reflected in a top-bottom spread of at least 20 points.
5. Technology displays by far the best all-around combination of Outlook/Bull/Bear scores, while Telecom is by far the worst. Looking at just the Bull/Bear combination, Financial is the best, followed by Technology, indicating superior relative performance (on average) in extreme market conditions (whether bullish or bearish), while Telecom scores the worst, as investors have generally avoided the sector recently.
6. This week’s fundamentals-based Outlook rankings still reflect a generally bullish bias, given that five of the top six sectors are economically-sensitive or all-weather (Technology, Materials, Industrial, Healthcare, Financial), and the scores reflect solid conviction. Keep in mind, the Outlook Rank does not include timing, momentum, or relative strength factors, but rather reflects the consensus fundamental expectations at a given point in time for individual stocks, aggregated by sector.
ETF Trading Ideas:
Our Sector Rotation model, which appropriately weights Outlook, Bull, and Bear scores in accordance with the overall market’s prevailing trend (bullish, neutral, or defensive), displays a bullish bias and suggests holding Technology (IYW), Basic Materials (IYM), and Industrial (IYJ), in that order. (Note: In this model, we consider the bias to be bullish from a rules-based trend-following standpoint when SPY is above both its 50-day and 200-day simple moving averages.)
Besides iShares’ IYW, IYM, and IYH, other highly-ranked ETFs in our SectorCast model (which scores nearly 700 US-listed equity ETFs) from the Technology, Materials, Healthcare sectors include iShares Edge MSCI Multifactor Technology (TSHF), First Trust Materials AlphaDEX Fund (FXZ), and PowerShares Dynamic Building & Construction Portfolio (PKB).
If you prefer a neutral bias, the Sector Rotation model suggests holding Technology, Basic Materials, and Consumer Goods (Staples/Noncyclical), in that order. On the other hand, if you are more comfortable with a defensive stance on the market, the model suggests holding Utilities, Basic Materials, and Energy (surprise!), in that order.
An assortment of other interesting ETFs that are scoring well in our latest rankings (having an Outlook score of 90 or above) include iShares US Home Construction (ITB), PowerShares Dynamic Pharmaceuticals Portfolio (PJP), First Trust NASDAQ-100 Tech Sector Index Fund (QTEC), VanEck Mortgage REIT Income (MORT), Arrow QVM Equity Factor (QVM), AlphaMark Actively Managed Small Cap (SMCP), Guggenheim Invest S&P 500 Equal Weight Technology (RYT), Deep Value ETF (DVP), PowerShares KBW High Dividend Yield Financial Portfolio (KBWD), WBI Tactical SMV Shares (WBIB), Direxion iBillionaire Index (IBLN), Pacer Global Cash Cows Dividend (GCOW), and Direxion All Cap Insider Sentiment Shares (KNOW – which tracks a Sabrient index).
IMPORTANT NOTE: I post this information periodically as a free look inside some of our institutional research and as a source of some trading ideas for your own further investigation. It is not intended to be traded directly as a rules-based strategy in a real money portfolio. I am simply showing what a sector rotation model might suggest if a given portfolio was due for a rebalance, and I may or may not update the information on a regular schedule. There are many ways for a client to trade such a strategy, including monthly or quarterly rebalancing, perhaps with interim adjustments to the bullish/neutral/defensive bias when warranted, but not necessarily on the days that I happen to post this article. The enhanced strategy seeks higher returns by employing individual stocks (or stock options) that are also highly ranked, but this introduces greater risks and volatility. I do not track performance of the ideas mentioned here as a managed portfolio.
Disclosure: The author has no positions in stocks or ETFs mentioned.
Disclaimer: This newsletter is published solely for informational purposes and is not to be construed as advice or a recommendation to specific individuals. Individuals should take into account their personal financial circumstances in acting on any opinions, commentary, rankings, or stock selections provided by Sabrient Systems or its wholly-owned subsidiary Gradient Analytics. Sabrient makes no representations that the techniques used in its rankings or analysis will result in or guarantee profits in trading. Trading involves risk, including possible loss of principal and other losses, and past performance is no indication of future results.