July inflation metrics may not be as worrisome as they seem

by Scott Martindale
CEO, Sabrient Systems LLC
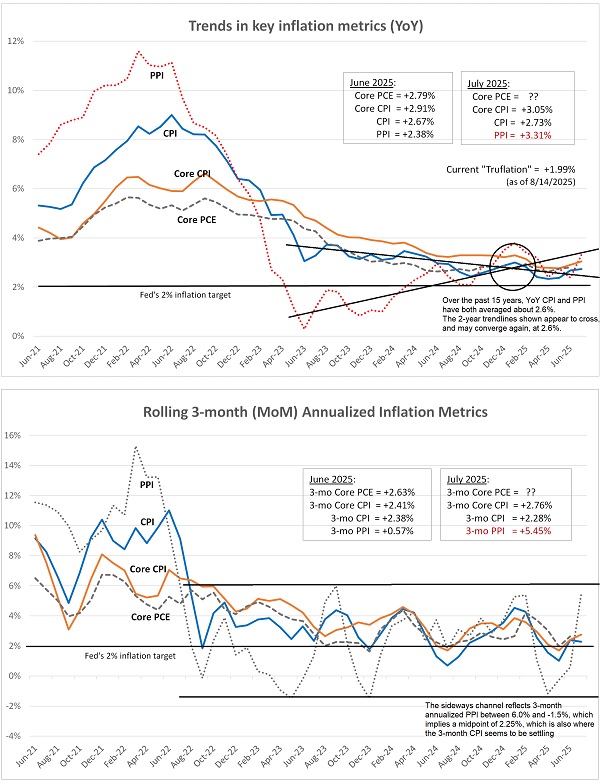
Allow me to offer my insights into this week's CPI and PPI reports for July. CPI came in modest as expected, at 2.73% YoY, 0.20% MoM, and past 3 months annualized trend of 2.28%, which set the market on fire as a green light for the Fed to cut rates. But then today, PPI came in ultra-hot at 3.31% YoY, 0.9% MoM, and past 3 months annualized trend of a scorching 5.45%, which the market didn't like very much, especially the rate-sensitive small caps.
However, perhaps all is not so scary as it may seem. In the charts below, you can see that PPI tends to have greater volatility and a wider range. But over the past 15 years, both CPI and PPI have averaged right around 2.6% YoY. In the top chart of YoY numbers, I have drawn 2-year trendlines (PPI trending up and CPI trending down). They appear to cross at about 2.6% and may be destined to converge there.
In the lower chart, I show rolling 3-month annualized numbers to give a better read on the current trend. You can see that over the past 2 years, PPI seems to be in a wide range between 6.0% and -1.5%, which implies a midpoint of 2.25%. This is also where the 3-month CPI fluctuations appear to be settling.
So, both charts suggest to me that inflation seems to be destined to settle somewhere in the 2.25–2.50% range. A corroborating metric is the real-time blockchain-based Truflation metric, updated daily, which has fluctuated between 1.60–2.27% YoY over the past 3 months and currently sits at 1.99%.
Disclaimer: Opinions expressed are the author’s alone and do not necessarily reflect the views of Sabrient. This report is published solely for informational purposes only. It is neither a solicitation to buy nor an offer to sell securities. It is not intended as investment advice and should not be used as the sole basis for any investment decision. Individuals should consider their personal financial circumstances in acting on any opinions, commentary, rankings, or stock selections provided by Sabrient Systems. Sabrient makes no representations that the techniques used in its rankings or analyses will result in profits. Trading involves risk, including possible loss of principal and other losses, and past performance is no guarantee of future results. Investment returns will fluctuate, and principal value may either rise or fall. Sabrient disclaims liability for damages of any sort (including lost profits) arising from the use of or inability to use its rankings or analyses. Information contained herein reflects our judgment or interpretation at the time of publication and is subject to change without notice.
Copyright © 2025 Sabrient Systems, LLC. All rights reserved.