Sector Detector: Bulls keep their powder dry as presidential debates begin
 With all the recent central bank actions (e.g., the Fed’s unlimited QE3, the ECB’s Outright Monetary Transactions, and the Bank of Japan’s ongoing initiatives), the expectation of infinite liquidity is now baked into stock prices. So, further movement will have to come from new catalysts, like good old-fashioned earnings growth.
However, Wall Street’s earnings projections have steadily dropped since the beginning of the year, and they are now forecasted to be negative for the third quarter—indeed the worst quarterly performance since 4Q2008. Lately, many big firms have been guiding lower earnings during the pre-announcement season. Although odds are that it would be taken by bulls as a welcome buying opportunity, a deluge of weak earnings reports could lead to some selling.
Even Fed Chairman Bernanke opined that fiscal policy has to become more proactive to help push the economy forward. Gee, ya think? On Wednesday night as I write this, the presidential debate season kicked off in grand style, and I think Romney made a compelling case for a change in fiscal policy.
Here are a few of my general observations after Wednesday’s first debate. First, I was heartened to see that for a change we actually have two candidates who are competent, articulate, and passionate, yet mutually respectful. Nevertheless, gridlock in the Federal government might render essentially irrelevant the presidential election results, and that is the topic of this month’s The MacroReport by Sabrient and MacroRisk Analytics: http://www.macroreportinteractive.com
Second, it’s a lot easier for an incumbent to shine in a debate when the country is doing well than when things are still rough. Four years ago, Obama was smooth, confident, and on the attack. This time he was on the defensive. Although he was still poised, confident, and presidential overall, he seemed almost fatigued to have to be going through all this re-election stuff, uncomfortable with political posturing and unwilling to counterpunch.
Romney eagerly played the role of attack dog. He was strong and well-prepared, spry and energetic like a college student running for class president. His constant smirk was a little off-putting, as was his propensity to talk too much, but I think it simply reflects his passion for the challenge. Romney’s main weakness was his lack of details on how he pays for his (“secret”) plans or replaces existing legislation.
The President was particularly vulnerable in that he has failed to stimulate job growth while ballooning the deficit, rather than cut it in half as originally promised. His regular excuse is that he inherited a crashing economy, but of course he knew that going in when the promises were made. Regulation has become notably more burdensome, and Romney kept harping on what a job-killer this has been. Also, Obama often talks about how his policies are similar to Bill Clinton’s, so they should produce the same thriving economy and debt reduction. But of course, Clinton was fortunate enough to reign during the golden years of world peace, unprecedented capital spending on technology (in preparation for Y2K), and the dawn of the Internet Age and e-commerce—it would have been hard to fail during such a time.
All in all, Romney got off to a good start on his “Hunt for Red October,” i.e., the challenge of changing the swing states from Democrat blue to Republican red during this critical month.
Almost all sectors (other than Energy and Materials) remain near their recent highs, demonstrating the strong correlations among equities. However, as ConvergEx pointed out recently, this might spell the end of the macro-driven asset performance and high equity correlation of the past five years and usher in the return of the art of stock-picking. If so, it will be a welcome change for many frustrated analysts, traders, and portfolio managers, not to mention quant modelers.
Exactly one year ago, the market staved off a significant breakdown of support and the threat of yet another massive October selloff by staging a huge reversal in the last 45 minutes of trading resulting in a 4% intraday move for the S&P 500, from down 2% to up 2%. It turned out to be the start of an impressive 32% one-year rally.
During the past year, Financial (IYF) and Consumer Services (IYC) have been the leaders, up 40%, as banks capitalize on yield spreads and consumer debt as risen, with Healthcare (IYH) close behind at 36%, followed by Technology (IYW) at 32%—carried mostly by incredible performance from mega-caps Apple (AAPL) and Google (GOOG), up 79% and 54%, respectively. AAPL sold off quite a bit recently after its iPhone 5 problems came to light, but late in the day on Tuesday it bounced strongly off support at its 50-day simple moving average. Not surprisingly given the bullish environment, defensive sectors Consumer Goods (IYK) and Utilities (IDU) were the laggards at 22% and 13%, respectively.
The S&P 500 SPDR Trust (SPY) closed Wednesday at 145.09. It has been trading within a bullish rising channel since the rally started at the beginning of June, including a brief “false breakout” after the Fed’s QE3 announcement. Price remains in the middle of that rising channel, hugging the 20-day simple moving average, but still above the 50-, 100- and 200-day SMAs. The 200 is fast closing in on the 100-day. Price seems to have found a higher line of support within a tighter trading channel. It also seems to be forming a neutral symmetrical triangle while the Bollinger Bands rapidly converge, which is like a coiled spring getting ready to break in one direction or the other. It just needs a new catalyst.
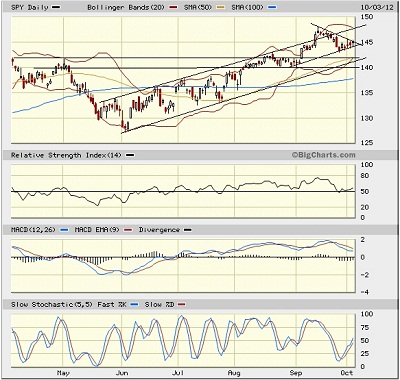
There is a lot of strong support below current levels, including the previous triple-top resistance-turned-support at 142, the rising 50-day SMA at about the same level, the bottom line of the rising channel just below, and then prior strong support at 140. Then there is the 100-day SMA near 138 and finally the rising 200-day SMA. Oscillators like RSI, MACD, and Slow Stochastic are all turning up bullishly. But of course they can turn on a dime.
The CBOE Market Volatility Index (VIX), a.k.a. “fear gauge,” closed Wednesday at 15.43. This is still quite low and generally bullish for stocks.
Now the big question is, what comes next? Well, I can tell you that lots of things remain on the side of the bulls: “The trend is your friend”… “Don’t fight the Fed” … Seasonally strong time of year … Persistently low VIX … Increasing institutional volume … Strong contrarian indicator in high levels of bearish sentiment as reported by the American Association of Individual Investors (AAII) … Infinite liquidity with no signs of inflation … A weak U.S. dollar that helps boost earnings for the major multinationals … Low borrowing rates and historically high levels of corporate cash for buybacks, dividends, and acquisitions … Historically high risk premium for stocks vs. bonds….
And of course, stocks usually precede the direction of the economy. With infinite liquidity baked into prices, they just need a new catalyst.
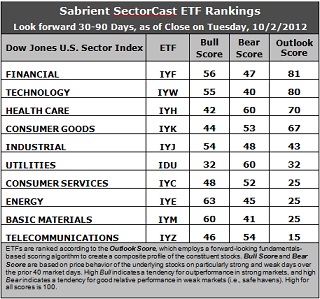
Latest rankings: The table ranks each of the ten U.S. industrial sector iShares (ETFs) by Sabrient’s proprietary Outlook Score, which employs a forward-looking, fundamentals-based, quantitative algorithm to create a bottom-up composite profile of the constituent stocks within the ETF. In addition, the table also shows Sabrient’s proprietary Bull Score and Bear Score for each ETF.
High Bull score indicates that stocks within the ETF have tended recently toward relative outperformance during particularly strong market periods, while a high Bear score indicates that stocks within the ETF have tended to hold up relatively well during particularly weak market periods. Bull and Bear are backward-looking indicators of recent sentiment trend.
As a group, these three scores can be quite helpful for positioning a portfolio for a given set of anticipated market conditions.
Observations:
1. Financial (IYF) has risen to the top spot with an Outlook score of 81, followed closely by Technology (IYW) at 80.. Stocks within IYF got a big boost from Wall Street’s analysts this week as earnings estimates for banks were raised while estimates for Tech stocks were lowered. IYW still displays an impressive combination of low forward P/Es, strong projected long-term growth, and solid return ratios. Healthcare (IYH) remains in the third spot with an improved score of 70.
2. Telecom (IYZ) stays at the bottom of the Outlook rankings with an Outlook score of 15. Stocks within the sector are burdened by the highest forward P/Es and the worst return ratios, plus net downgrades from Wall Street. Utilities (IDU) rises out of the bottom two this week as Basic Materials (IYM), Energy (IYE), and Consumer Services (IYC) tie for second worst with a 25.
3. Overall, I would categorize the rankings as neutral, with defensive sectors like Consumer Goods and Healthcare in the top five and Utilities rising to sixth, while economically-sensitive sectors like Consumer Services and Basic Materials sit in the bottom five.
4. Looking at the Bull scores, Energy (IYE) is the leader on strong market days, scoring 63, followed closely by Basic Materials (IYM). Utilities (IDU) is still by far the weakest on strong days, scoring 32. In other words, Energy stocks have tended to perform the best when the market is rallying, while Utilities stocks have lagged.
5. Looking at the Bear scores, Healthcare (IYH) and Utilities (IDU) are the investor safe havens on weak market days, scoring 60. Surprisingly, Technology (IYW) has been abandoned the most by investors during recent market weakness, as reflected by its low Bear score of 40, followed closely by Materials (IYM). In other words, Tech stocks have tended to sell off the most when the market is pulling back, while Utilities and Healthcare stocks have held up the best.
6. Overall, Financial (IYF) now shows the best all-weather combination of Outlook/Bull/Bear scores. Adding up the three scores gives a total of 184. Telecom (IYZ) is the worst at 115. As for Bull/Bear combination, Energy (IYE) remains the best at 108, while Utilities (IDU) is the worst with a dismal 92.
These scores represent the view that the Financial and Technology sectors may be relatively undervalued overall, while Telecom and Materials sectors may be relatively overvalued based on our 1-3 month forward look.
Top-ranked stocks within IYW and IYF include American National Insurance (ANAT), MasterCard (MA), Cognizant Technology Solutions (CTSH), and Cerner Corp (CERN).
Disclosure: Author has no positions in stocks or ETFs mentioned.
About SectorCast: Rankings are based on Sabrient’s SectorCast model, which builds a composite profile of each equity ETF based on bottom-up aggregate scoring of the constituent stocks. The Outlook Score employs a fundamentals-based multi-factor approach considering forward valuation, earnings growth prospects, Wall Street analysts’ consensus revisions, accounting practices, and various return ratios. It has tested to be highly predictive for identifying the best (most undervalued) and worst (most overvalued) sectors, with a 1-3 month forward look.
Bull Score and Bear Score are based on the price behavior of the underlying stocks on particularly strong and weak days during the prior 40 market days. They reflect investor sentiment toward the stocks (on a relative basis) as either aggressive plays or safe havens. So, a high Bull score indicates that stocks within the ETF have tended recently toward relative outperformance during particularly strong market periods, while a high Bear score indicates that stocks within the ETF have tended to hold up relatively well during particularly weak market periods.
Thus, ETFs with high Bull scores generally perform better when the market is hot, ETFs with high Bear scores generally perform better when the market is weak, and ETFs with high Outlook scores generally perform well over time in various market conditions.
Of course, each ETF has a unique set of constituent stocks, so the sectors represented will score differently depending upon which set of ETFs is used. For Sector Detector, I use ten iShares ETFs representing the major U.S. business sectors.
About Trading Strategies: There are various ways to trade these rankings. First, you might run a sector rotation strategy in which you buy long the top 2-4 ETFs from SectorCast-ETF, rebalancing either on a fixed schedule (e.g., monthly or quarterly) or when the rankings change significantly. Another alternative is to enhance a position in the SPDR Trust exchange-traded fund (SPY) depending upon your market bias. If you are bullish on the broad market, you can go long the SPY and enhance it with additional long positions in the top-ranked sector ETFs. Conversely, if you are bearish and short (or buy puts on) the SPY, you could also consider shorting the two lowest-ranked sector ETFs to enhance your short bias.
However, if you prefer not to bet on market direction, you could try a market-neutral, long/short trade—that is, go long (or buy call options on) the top-ranked ETFs and short (or buy put options on) the lowest-ranked ETFs. And here’s a more aggressive strategy to consider: You might trade some of the highest and lowest ranked stocks from within those top and bottom-ranked ETFs.