Sector Detector: Central banks take center stage as stocks seek a catalyst
 Volume remains low as the bulls continue to await Wall Street’s return from late summer vacations...and a firm plan from the central banks. (I think many portfolio managers must be spending their days in the stands at the U.S. Open tennis tournament.) The S&P 500 closed out August with a third straight monthly gain. The major indexes continue to hold their psychologically important support levels of Dow 13,000, Nasdaq 3,000, S&P 500 1400, and Russell 2000 800.
Healthcare stocks continue to be strong. The iShares Dow Jones U.S. Healthcare Sector Index Fund (IYH) hit another all-time high on Wednesday. Also at an all-time high is the iShares Dow Jones U.S. Consumer Services Index Fund (IYC).
As we wind down the 2Q2012 earnings reports, S&P 500 companies appear to be averaging only 0.9% growth. Of the 10 major U.S. sectors, Industrial showed the strongest second quarter growth rate of 13.4%. Next strongest was Technology at 6.8%. Holding back the averages were Materials at -16.2% and Energy at -12.0%—both of which are still improvements from their third quarter performance.
The big news on Wednesday was ECB President Mario Draghi’s bond-buying proposal. It reportedly includes unlimited purchases of short-dated (up to 3-year maturity) government debt that will be “sterilized” to dampen concerns about printing euros. To sterilize the bond purchases, the ECB removes elsewhere from the system the same amount of money that it spends, ensuring the program has a neutral impact on the money supply. With the ECB’s deposit rate at zero and European banking system awash in excess liquidity, experts believe that an enhanced bond program should be workable. Draghi will announce whether his plan has been approved on Thursday.
Friday brings the much-anticipated August jobs report. New claims for unemployment have been rising lately, so it’s unlikely to show much improvement. Then, we’ll see what the FOMC has to say at their next meeting on September 12-13.
Another piece of news was the disconcerting report from the U.S. Treasury that the total public outstanding debt has now passed the $16 trillion mark, which amounts to over $136,000 per household and over $50,000 per U.S. citizen—which is more government debt per person than Portugal, Italy, Spain, or Greece. We're spending about $200 billion per year on interest payments now.
The GOP and Democratic National Conventions have both served to solidify support among their key bases but apparently have yet to sway many minds in the middle. Both sides have been espousing platitudes about the American Dream and scare tactics about the future under the other party. Regarding the economy, Republicans promote a Libertarian view of unshackling businesses from undue regulation so they can thrive and become a job-generation machine, while Dems push a populist view about the need for governmental oversight and guidance of business (a.k.a., “cooperation”) to protect the little guy from a “rigged system” and to ensure that there is longer-term planning for education, jobs, healthcare, and a broad safety net, beyond the myopia of quarterly corporate earnings reports.
In the Republican view, government is the problem. In the Democratic view, government is the savior. Just look at the faces in the audience during the Democratic Convention. They idolize Bill Clinton and Barack Obama like rock stars…protectors…heroes to be worshipped. On the other hand, Republicans view their candidates as practitioners…managers…ship captains who have been hired to keep the country on the right course. In any case, we must await the debates to hear more substance about their respective programs. Then perhaps the independents and undecideds will be able to take a side.
Looking at the S&P 500 SPDR Trust (SPY) chart, it closed Wednesday at 140.91. The 140 level has been serving as strong support for the past 4 weeks—ever since breaking through this psychological resistance level on August 7. SPY has been trading within a bullish rising channel for over 3 months, and many market observers still say we are way overdue for at least a minor correction. SPY has been contending with strong technical resistance from the April-May closing highs near 142. The bullish ascending triangle I thought might be forming last week seems to have failed, but price still remains within the established rising channel, but also within a shorter-term sideways channel between 140 and 142. Price has fallen slightly below its 20-day simple moving average, but still sits bullishly above the 50-, 100- and 200-day SMAs.
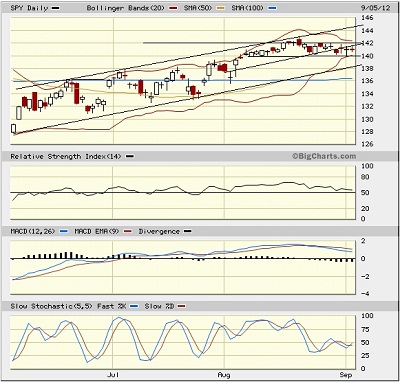
If markets try to correct, there are several interim support levels, including current support at 140, the rising 50-day SMA and the bottom of the larger rising channel just above 138, the 100-day SMA near 136, and then the 200-day SMA near 134. The oscillators like RSI, MACD, and Slow Stochastic are mostly neutral, but might be signaling they are ready to turn upwards.
The VIX (CBOE Market Volatility Index—a.k.a. “fear gauge”) has fallen back a bit from its recent rise, closing Wednesday at 17.74. Most of its oscillators have turned down from overbought, which is bullish for stocks.
Here’s one more bullish signal. FactSet reported that the 50 largest hedge funds increased their equity exposure by 3% during 2Q2012, and 45 of the 50 showed a net increase in equity assets.
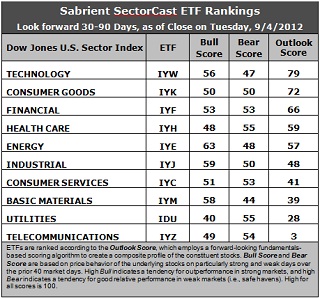
Latest rankings: The table ranks each of the ten U.S. industrial sector iShares (ETFs) by Sabrient’s proprietary Outlook Score, which employs a forward-looking, fundamentals-based, quantitative algorithm to create a bottom-up composite profile of the constituent stocks within the ETF. In addition, the table also shows Sabrient’s proprietary Bull Score and Bear Score for each ETF.
High Bull score indicates that stocks within the ETF have tended recently toward relative outperformance during particularly strong market periods, while a high Bear score indicates that stocks within the ETF have tended to hold up relatively well during particularly weak market periods. Bull and Bear are backward-looking indicators of recent sentiment trend.
As a group, these three scores can be quite helpful for positioning a portfolio for a given set of anticipated market conditions.
Observations:
1. Outlook scores are little changed from last week. Technology (IYW) remains in the top spot with a score of 79. Stocks within IYW are displaying relatively low forward P/Es, strong projected long-term growth, and solid return ratios. However, the analysts have been reducing forward earnings estimates overall. Consumer Goods (IYK) continues to hold the second spot with a 72, as stocks within the sector maintain their relative support from Wall Street analysts. Financial (IYF), Healthcare (IYH), and Energy (IYE) round out the top five.
2. Telecom (IYZ) stays at the bottom of the Outlook rankings this week with an anemic Outlook score of 3. Stocks within the sector are hobbled by the highest forward P/E and the worst return ratios, and a lack of Wall Street support. Utilities (IDU) remains in the bottom two with a score of 28. It continues to be hampered by a high forward P/E and the worst projected long-term growth rate.
3. Overall, I would continue to categorize the rankings as neutral, with conservative sectors like Consumer Goods and Healthcare in the top 5, joining economically-sensitive sectors like Technology and Financial.
4. Looking at the Bull scores, Energy (IYE) is the clear leader on strong market days, scoring 63. Utilities (IDU) is still by far the weakest on strong days, scoring 40. In other words, Energy stocks have tended to perform the best when the market is rallying, while Utilities stocks have lagged.
5. Looking at the Bear scores, Utilities (IDU) has been gradually losing its hold as the investor favorite “safe haven” on weak market days. It is now tied for the lead with a 55, along with Healthcare (IYH). Basic Materials (IYM) has been abandoned (relatively speaking) by investors during market weakness, as reflected by its low Bear score of 44. In other words, Materials stocks have tended to sell off the most when the market is pulling back, while Utilities and Healthcare stocks have held up the best.
6. Overall, Technology (IYW) again shows the best all-weather combination of Outlook/Bull/Bear scores. Adding up the three scores gives a total of 182. Telecom (IYZ) is the worst at 106. As for Bull/Bear combination, Energy (IYE) is the best at 111, while Utilities (IDU) is by far the worst at 95.
These scores represent the view that the Technology and Consumer Goods sectors may be relatively undervalued overall, while Telecom and Utilities sectors may be relatively overvalued based on our 1-3 month forward look.
Top-ranked stocks within IYW and IYK include athenahealth (ATHN), VMware (VMW), The Middleby Corp (MIDD), and Under Armour (UA).
Disclosure: Author has no positions in stocks or ETFs mentioned.
About SectorCast: Rankings are based on Sabrient’s SectorCast model, which builds a composite profile of each equity ETF based on bottom-up aggregate scoring of the constituent stocks. The Outlook Score employs a fundamentals-based multi-factor approach considering forward valuation, earnings growth prospects, Wall Street analysts’ consensus revisions, accounting practices, and various return ratios. It has tested to be highly predictive for identifying the best (most undervalued) and worst (most overvalued) sectors, with a 1-3 month forward look.
Bull Score and Bear Score are based on the price behavior of the underlying stocks on particularly strong and weak days during the prior 40 market days. They reflect investor sentiment toward the stocks (on a relative basis) as either aggressive plays or safe havens. So, a high Bull score indicates that stocks within the ETF have tended recently toward relative outperformance during particularly strong market periods, while a high Bear score indicates that stocks within the ETF have tended to hold up relatively well during particularly weak market periods.
Thus, ETFs with high Bull scores generally perform better when the market is hot, ETFs with high Bear scores generally perform better when the market is weak, and ETFs with high Outlook scores generally perform well over time in various market conditions.
Of course, each ETF has a unique set of constituent stocks, so the sectors represented will score differently depending upon which set of ETFs is used. For Sector Detector, I use ten iShares ETFs representing the major U.S. business sectors.
About Trading Strategies: There are various ways to trade these rankings. First, you might run a sector rotation strategy in which you buy long the top 2-4 ETFs from SectorCast-ETF, rebalancing either on a fixed schedule (e.g., monthly or quarterly) or when the rankings change significantly. Another alternative is to enhance a position in the SPDR Trust exchange-traded fund (SPY) depending upon your market bias. If you are bullish on the broad market, you can go long the SPY and enhance it with additional long positions in the top-ranked sector ETFs. Conversely, if you are bearish and short (or buy puts on) the SPY, you could also consider shorting the two lowest-ranked sector ETFs to enhance your short bias.
However, if you prefer not to bet on market direction, you could try a market-neutral, long/short trade—that is, go long (or buy call options on) the top-ranked ETFs and short (or buy put options on) the lowest-ranked ETFs. And here’s a more aggressive strategy to consider: You might trade some of the highest and lowest ranked stocks from within those top and bottom-ranked ETFs.