Sector Detector: Patient bulls are getting their buyng opportunity
 Stock investors are protecting gains and holding off on deploying cash as concerns abound about central banks, including the Federal Reserve, tapering off on their stimulus programs, i.e., money printing. Low-interest policies and quantitative easing have been the driving force for economic recovery while pushing return-hungry investors into equities by default. And now worries are resurfacing that China’s growth is slowing -- and threatening to derail global economic recovery. Thursday trading in Asia is seeing shares making new 2013 lows.
The Utilities sector continues to take it on the chin after dividend-hungry investors took valuations a little too high while interest rates crept up. The iShares US Utilities Sector ETF (IDU) has fallen nearly 9% from its peak over the past six weeks. Capital has rotated into the cyclical sectors, which by nature are higher beta and more volatile, and indeed we are seeing higher market volatility.
But U.S. stocks still have a lot going for them, and new bulls who have patiently awaited a larger pullback before putting their money to work are being rewarded for their patience. Stock valuations are still good, assuming the economy keeps improving and corporate earnings continue to hold up.
Although U.S. stocks remain within a 6-month uptrend, emerging markets and China have not fared so well, and their charts look downright scary. Just pull up a chart of the iShares MSCI Emerging Markets Index Fund (EEM). Some commentators are worried about a contagion of global worry impacting U.S. equities, as well, but I expect many global investors who are pulling money from emerging markets ultimately will redeploy their equity capital into the U.S. Plus, the markets are benefiting from the fuel of plentiful corporate cash for buybacks and acquisitions.
In new M&A activity, Cooper Tire & Rubber (CTB) jumped more than 40% on Wednesday after agreeing to be acquired by Apollo Tyres for about $2.5 billion in cash. And then in the afterhours, shares of Safeway Inc (SWY) jumped 30% when Empire Company Ltd (Sobeys) of Canada announced an unsolicited offer to acquire Safeway's Canadian assets for $5.7 billion in cash, which was more than the whole market cap of SWY before the announcement, even though it includes only about 200 of their 1600 stores. A great deal for SWY shareholders. Safeway will use the cash to pay down $2 billion in debt, buy back stock, and invest in new opportunities, which is all good.
Looking at the chart of the SPDR S&P 500 Trust (SPY), it closed Wednesday at 161.75, which is just about where it was last Wednesday. The technical consolidation continues, and I have drawn a neutral symmetrical triangle, which I expect will ultimately turn out to be a continuation pattern for the rising channel that has been in place since November. The oscillators are continuing to churn around during this consolidation, and could go either way from here. The 50-day simple moving average (SMA) converged with the lower line of the rising channel, and along with psychological support at 160 (corresponding with 1600 on the S&P 500 Index), offered strong support last week as I suspected it would, although the big bounce has been turned back for the moment.
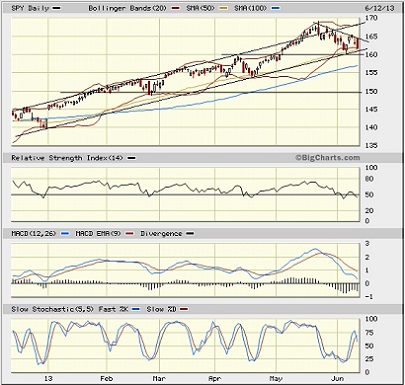
If a breakout above this symmetrical triangle occurs, the market might continue its rise through the summer. But if the triangle fails, and then 160 fails, too, then the 100-day SMA will be hard-pressed to stem the tide, and the critical 200-day SMA could be in play down near 150, which should be considered “support of last resort.”
The CBOE Market Volatility Index (VIX), a.k.a. “fear gauge,” closed Wednesday at 18.59. Since the beginning of June, it has stayed above resistance-turned-support at 15, but it still has not closed one day above the important 20 level during 2013.
Latest rankings: The table ranks each of the ten U.S. business sector iShares ETFs by Sabrient's proprietary Outlook Score, which employs a forward-looking, fundamentals-based, quantitative algorithm to create a bottom-up composite profile of the constituent stocks within the ETF. The multi-factor model considers forward valuation, historical earnings trends, earnings growth prospects, the dynamics of Wall Street analysts' consensus estimates, accounting practices and earnings quality, and various return ratios. In addition, the table also shows Sabrient's proprietary Bull Score and Bear Score for each ETF.
High Bull score indicates that stocks within the ETF have tended recently toward relative outperformance during particularly strong market periods, while a high Bear score indicates that stocks within the ETF have tended to hold up relatively well during particularly weak market periods. Bull and Bear are backward-looking indicators of recent sentiment trend.
As a group, these three scores can be quite helpful for positioning a portfolio for a given set of anticipated market conditions.
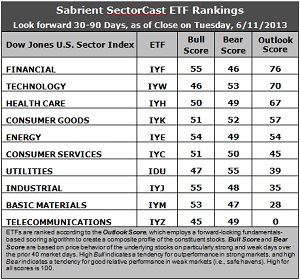
Observations:
1. Financial (IYF) stays in the top spot with an Outlook score of 76. Stocks within IYF display by far the strongest sentiment among insiders and Wall Street analysts (net revisions to earnings estimates), as well as a low forward P/E. Technology (IYW) remains second with a score of 70. Stocks within IYW display a low forward P/E, a solid long-term projected growth rate, and the best return ratios.
2. Telecom (IYZ) stays in the cellar with an Outlook score of 0. It is weak across the board with a high forward P/E, low long-term projected growth, horrid return ratios, and negative sentiment among insiders and sell-side analysts. It is joined in the bottom two again this week by Basic Materials (IYM) at 28.
3. Financial (IYF) has further solidified its support from Wall Street, while Telecom (IYZ) and Materials (IYM) are getting net downward revisions. I would say that this week’s fundamentals-based rankings are still on the bullish side of neutral, given that IYF and IYW are still at the top, but it is evident that uncertainty is prevalent. Defensive sector Consumer Goods (IYK) keeps the same score but Utilities (IDU) slipped further as sell-side analysts have not been raising estimates. It would be more bullish to see improving scores in Consumer Services (IYC), Industrial (IYJ) and Materials (IYM).
4. Looking at the Bull scores, IYF and IYJ have been the leaders on particularly strong market days, scoring 55, while IYZ scores the lowest at 45. Surprisingly, IYW has fallen further to 46. The narrow top-bottom spread of 10 points continues to indicate high sector correlation on strongly bullish days.
5. Looking at the Bear scores, Utilities (IDU) has regained its status as the favorite “safe haven” on weak market days, scoring 55, but IYW has been holding up, too. Financial (IYF) remains the weakling during extreme market weakness as reflected in its low Bear score of 46. The top-bottom spread is narrow at only 9 points, which indicates much lower correlation on weak market days than we were seeing earlier in the year.
6. Overall, Financial (IYF) shows the best all-weather combination of Outlook/Bull/Bear scores. Adding up the three scores gives a total of 177. Telecom (IYM) is the worst at 94. Looking at just the Bull/Bear combination, Consumer Goods (IYK) and Energy (IYE) display the highest score of 103, while Telecom (IYZ) scores the lowest at 94.
These Outlook scores continue to represent the view that Financial and Technology sectors may be relatively undervalued, while Telecom and Basic Materials sectors may be relatively overvalued based on our 1-3 month forward look.
Some top-ranked stocks within IYF and IYW include Portfolio Recovery Associates (PRAA), Ameriprise Financial (AMP), Apple (AAPL), and Cerner (CERN).
Disclosure: Author has no positions in stocks or ETFs mentioned.
About SectorCast: Rankings are based on Sabrient’s SectorCast model, which builds a composite profile of each equity ETF based on bottom-up aggregate scoring of the constituent stocks. The Outlook Score employs a fundamentals-based multi-factor approach considering forward valuation, earnings growth prospects, Wall Street analysts’ consensus revisions, accounting practices, and various return ratios. It has tested to be highly predictive for identifying the best (most undervalued) and worst (most overvalued) sectors, with a 1-3 month forward look.
Bull Score and Bear Score are based on the price behavior of the underlying stocks on particularly strong and weak days during the prior 40 market days. They reflect investor sentiment toward the stocks (on a relative basis) as either aggressive plays or safe havens. So, a high Bull score indicates that stocks within the ETF have tended recently toward relative outperformance during particularly strong market periods, while a high Bear score indicates that stocks within the ETF have tended to hold up relatively well during particularly weak market periods.
Thus, ETFs with high Bull scores generally perform better when the market is hot, ETFs with high Bear scores generally perform better when the market is weak, and ETFs with high Outlook scores generally perform well over time in various market conditions.
Of course, each ETF has a unique set of constituent stocks, so the sectors represented will score differently depending upon which set of ETFs is used. For Sector Detector, I use ten iShares ETFs representing the major U.S. business sectors.
About Trading Strategies: There are various ways to trade these rankings. First, you might run a sector rotation strategy in which you buy long the top 2-4 ETFs from SectorCast-ETF, rebalancing either on a fixed schedule (e.g., monthly or quarterly) or when the rankings change significantly. Another alternative is to enhance a position in the SPDR Trust exchange-traded fund (SPY) depending upon your market bias. If you are bullish on the broad market, you can go long the SPY and enhance it with additional long positions in the top-ranked sector ETFs. Conversely, if you are bearish and short (or buy puts on) the SPY, you could also consider shorting the two lowest-ranked sector ETFs to enhance your short bias.
However, if you prefer not to bet on market direction, you could try a market-neutral, long/short trade—that is, go long (or buy call options on) the top-ranked ETFs and short (or buy put options on) the lowest-ranked ETFs. And here’s a more aggressive strategy to consider: You might trade some of the highest and lowest ranked stocks from within those top and bottom-ranked ETFs.