Sector Detector: SectorCast rankings take a neutral slant as market hits new highs
 After a requisite knee-jerk selloff, stock market bulls shook off Russia’s military action in Ukraine and Crimea as just another buying opportunity. Even adding the Russian Bear to their arsenal couldn’t give bears the upper hand for long. The S&P 500 large cap index set yet another all-time intraday high and closed at a new record high on Friday. Also, the Russell 2000 small cap index set new record intraday and closing highs last week north of 1200. However, the technical condition is getting overbought, and Sabrient’s SectorCast rankings have moved from bullish to a more neutral bias.
The eagerly-awaited jobs report on Friday showed greater jobs creation than expected in February, and January's figure was revised higher, as well. Friday was the S&P 500's fifth record closing high in the past seven sessions. But rather than rally into the close, traders preferred to stay cautious into the weekend given the unstable state of affairs in Ukraine.
Of course, Ukraine is the story du jour and the latest brick in investors’ “wall of worry.” The country now faces a critical crossroads. It has a long and dizzying history of governments and allegiances that is hard for us Westerners to follow or understand. But today, it seems that if the pro-Western majority and new leadership in Kiev are determined to join the European Union, they will face intense pressure to allow Russia to annex the Eastern regions and Crimea. After all, the borders of Ukraine were drawn casually and almost arbitrarily in 1954 when it was all part of the Soviet Union, and these regions today are predominately pro-Russian. But if it is more important to Kiev to keep the borders intact, then it seems the country would need to remain neutral and independent. In spite of the recent escalation in military “exercises” on both sides, investors (at the moment) seem to be of the mind that a broader international war is unlikely.
Among the ten U.S. business sectors, the performance leaders last week were Financial, Basic Materials, and Industrial, which is typical bullish behavior. The S&P 500 is now up over +170% since the March 2009 V-bottom recovery.
Whether or not the Fed slows its tapering plan, global investors seem willing to seek the relative safety of U.S. Treasuries given the new regional hot spots of political unrest. And at the same time, stocks are still fairly valued and perhaps even slightly undervalued given the combination of low interest rates, a weak U.S. dollar, and a lack of sufficient liquidity and attractiveness in investment alternatives.
So, with capital flowing into both U.S. Treasuries and equities, we are seeing the 10-year Treasury yield remain low even as stocks hit new highs. This is creating the double-barreled power of lower mortgage rates (to goose the housing market) and a growing “wealth effect” from rising housing and stock prices, thus encouraging consumer spending, which accounts for more than 70% of U.S. GDP.
The CBOE Market Volatility Index (VIX), a.k.a. “fear gauge,” closed Friday at 14.11 after dropping below 14 during the week. The low level of fear right now is somewhat surprisingly given the situation in Ukraine.
Overall, although the market might be ready to take a breather at the current level and perhaps even pull back a bit, the path of least resistance for the foreseeable future is still up.
SPY chart review:
The SPDR S&P 500 Trust (SPY) closed Friday at a new high of 188.26. It successfully averted a dreaded triple-top sell signal by breaking through tough resistance at 185 last Friday, and then successfully testing resistance-turned-support and bullish conviction. The 20-day simple moving average has strongly crossed up through the 50-day SMA. However, price is now finding resistance at the top of the long-standing rising bullish channel, while Bollinger Bands are rapidly pinching back together and oscillators RSI, MACD, and Slow Stochastic are all in overbought positions that, although could get more overbought, really need to take a breather and preferably cycle back down. Also, the gap up on Tuesday is going to be a magnet to be at least partially filled, as a test of support. Furthermore, Friday’s candlestick looks a lot like a bearish hanging-man pattern. Although in this case it might simply indicate caution going into the weekend (given global events), the combination of signals suggests the market will lose some steam at this level, at least temporarily.
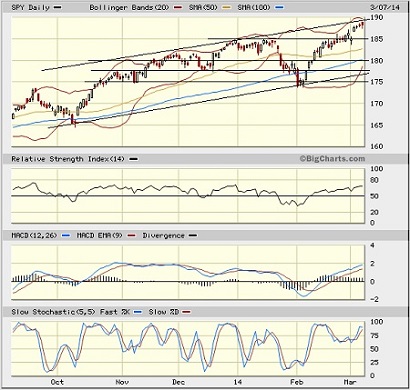
If the market indeed pulls back from here, there are plenty of support levels close below, including resistance-turned-support at 185, the 20-day and 50-day SMAs (currently near 182), round-number support at 180, the 100-day SMA near 179, prior support at 177.50, the bottom of the rising channel (currently near 176), prior strong support at 175, and then the 200-day SMA (currently near 173).
Latest sector rankings:
Relative sector rankings are based on Sabrient’s proprietary SectorCast model, which builds a composite profile of each equity ETF based on bottom-up aggregate scoring of the constituent stocks. The “Outlook Score” employs a forward-looking, fundamentals-based multifactor algorithm considering forward valuation, historical and projected earnings growth, the dynamics of Wall Street analysts’ consensus earnings estimates and recent revisions (up or down), quality and sustainability of reported earnings (forensic accounting score), and various return ratios. It helps us predict relative performance over the next 1-3 months.
In addition, SectorCast computes Sabrient's Bull Score and Bear Score for each ETF based on recent price behavior of the constituent stocks on particularly strong and weak market days. High Bull score indicates that stocks within the ETF have tended recently toward relative outperformance when the market is strong, while a high Bear score indicates that stocks within the ETF have tended to hold up relatively well (“safe havens”) when the market is weak.
Outlook Score is forward-looking while Bull and Bear are backward-looking. As a group, these three scores can be helpful for positioning a portfolio for a given set of anticipated market conditions. Of course, each ETF holds a unique portfolio of stocks and position weights, so the sectors represented will score differently depending upon which set of ETFs is used. For Sector Detector, I use the iShares that represent the ten major U.S. business sectors: Financial, Technology, Industrial, Healthcare, Consumer Goods, Consumer Services, Energy, Basic Materials, Telecom, and Utilities. Whereas the Select Sector SPDRs only contain stocks from the S&P 500, I prefer the iShares for their larger universe and broader diversity. Fidelity also offers a group of sector ETFs with an even larger number of constituents in each.
Here are some of my observations on this week’s scores:
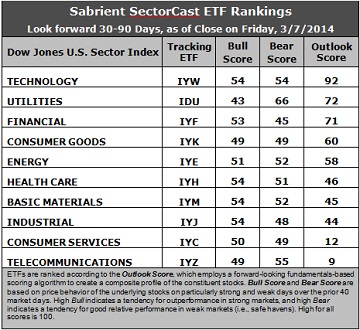
1. Technology (IYW) retains the top spot with a strong Outlook score of 92. Anything above 90 is impressive and highly notable. However, Financial (IYF) has been supplanted in the second spot, at least for the moment, by defensive sector Utilities (IDU), which scores 72. Technology has consistently displayed solid factor scores across the board, with a strong forward long-term growth rate, a relatively low forward P/E, the highest return ratios, and excellent sentiment among Wall Street’s sell-side analysts (net positive revisions to forward earnings estimates) and company insiders (open market buying). The Utilities sector displays a relatively low forward P/E and notably positive sentiment among sell-side analysts. Recall that last week IDU jumped 25 points, and it added another 7 points this week. Financial is third at 71, followed by Consumer Goods (IYK) and Energy (IYE). Energy continues its rise in the rankings, scoring 58 this week as sentiment continues to improve among both sell-side analysts and insiders.
2. Telecommunications (IYZ) has fallen back in the cellar with an Outlook score of 9, after getting it with a wave of negative earnings revisions by Wall Street. Consumer Services, a.k.a., consumer cyclicals or consumer discretionary, continues to boast the best forward long-term growth rate, but this is more than offset by a relatively high forward P/E and weak sentiment among both Wall Street analysts (net negative revisions to earnings estimates) and company insiders (low buying activity). Telecom continues to score among the lowest on most of the factors in the model, including the highest (worst) forward P/E, lowest return ratios, and a low projected long-term growth rate.
3. It appears to me that these fundamentals-based rankings have suddenly taken a neutral turn from their persistently bullish bias. Although Tech and Financial remain strong, the rise of defensive sectors like Utilities and Consumer Goods puts up a caution flag.
4. Looking at the Bull scores, Technology, Healthcare, Materials and Industrial have been the leaders on strong market days, scoring 54, while Utilities (IDU) is the laggard with a score of 43. The top-bottom spread is 11 points, reflecting moderately high sector correlations on particularly strong market days. It is generally preferable in a healthy market to see the top-bottom spread approach 20 points.
5. Looking at the Bear scores, Utilities scores a 66, giving a clear indication that stocks within this sector are the preferred “safe havens” on recent weak market days. Financial scores the lowest with a 45. The top-bottom spread is a robust 21 points, reflecting low sector correlations on weak market days, which is a good sign for a healthy market.
6. Overall, Technology easily displays the best all-weather combination of Outlook/Bull/Bear scores, while Consumer Services is the worst. Looking at just the Bull/Bear combination, Utilities holds the lead, indicating excellent relative performance (on average) in extreme market conditions, and Technology is a close second. Financial scores the lowest, indicating investor avoidance (relatively speaking) during extreme conditions, followed closely by the two Consumer sectors.
These Outlook scores represent the view that Technology and Utilities sectors are relatively undervalued, while Telecom and Consumer Services may be relatively overvalued based on our 1-3 month forward look.
Stock and ETF Ideas:
Our Sector Rotation Model, which appropriately weights Outlook, Bull, and Bear scores in accordance with the overall market’s prevailing trend (bullish, neutral, or bearish), continues to suggest holding Technology (IYW), Financial (IYF), and Healthcare (IYH) in the current bullish climate, in spite of my personal observations described above. (The bias remains bullish because the SPY is above its 50 and 200-day simple moving averages. Note: If you are more comfortable moving to a neutral bias at this time, the model suggests replacing Healthcare with Utilities.)
Other ETFs highly-ranked by Sabrient from the Technology, Financial, Healthcare, and Utilities sectors include iShares US Global Tech ETF (IXN), PowerShares KBW Insurance Portfolio (KBWI), SPDR S&P Pharmaceuticals ETF (XPH), and the Utilties Select Sector SPDR (XLU).
For an “enhanced” sector portfolio that employs top-ranked stocks (instead of ETFs) from within Tech, Financial, and Healthcare, some long ideas include NetScout Systems (NTCT), Manhattan Associates (MANH), KeyCorp (KEY), OFG Bancorp (OFG), Questcor Pharmaceuticals (QCOR) and Shire plc (SHPG). All are ranked highly in the Sabrient Ratings Algorithm and score near the top of the Sabrient/Gradient Earnings Quality Rank (EQR), which is a pure accounting-based risk assessment signal based on the forensic accounting expertise of Sabrient subsidiary Gradient Analytics. Among Utilities stocks (which are not covered by EQR), some ideas that are highly ranked in the Sabrient Ratings Algorithm include Empresa Distribuidora y Comercializadora Norte S.A. (EDN) and Targa Resources (TRGP).
On the other hand, if you have a bearish outlook on the market, our Sector Rotation Model would suggest holding Utilities (IDU), Technology (IYW), and Energy (IYE).
Disclosure: Author has no positions in stocks or ETFs mentioned.
Disclaimer: This newsletter is published solely for informational purposes and is not to be construed as advice or a recommendation to specific individuals. Individuals should take into account their personal financial circumstances in acting on any rankings or stock selections provided by Sabrient. Sabrient makes no representations that the techniques used in its rankings or selections will result in or guarantee profits in trading. Trading involves risk, including possible loss of principal and other losses, and past performance is no indication of future results.