Sector Detector: Top rankings in Tech, Financial, Energy, and Industrial
 Stocks have shown some resiliency this week as they have made an attempt to recover from last week’s weakness, which was primarily due to the imminent threat of a US strike on Syria. Also, the senior portfolio managers are returning to the fold after taking some time off in late August, and they are likely seeing more opportunities than threats at the moment.
August was the worst month for the market since May 2012, and September is historically the worst month for stocks. The bear story has relied upon a start to the Fed’s tapering on quant easing. The yield on 10-year Treasuries is now 2.89%, which is up about 25 bps since last month; while 10-year AAA munis pay 3.02% tax free and 10-year AAA corporates are at 3.64%.
The bear story has been further enhanced by Syria, Egypt, debt ceiling, sequester, new Fed Chairman speculation, elections in countries like Australia and Germany, rising oil prices, slowing corporate earnings growth, and stalled housing numbers, among many other issues. One of those other issues is the Fukushima nuclear plant in Japan and its alarming rise in radiation levels.
On Wednesday, a proposal supported by Senator John McCain regarding a military response for Syria passed through the Senate Foreign Relations Committee, so it is expected to go before the full Senate next week. It seems that investors are happy with further delays on military action, and perhaps they are still holding out hope that ultimately no action will be taken at all.
It’s a tough situation, and President Obama has put himself between a rock and a hard place on this. On the one hand, he will lose all credibility if he doesn’t follow through on his threats about the “red line” that cannot be crossed. On the other hand, he knows that if Assad falls, extremists will try to fill the void, leading to widespread violence, destruction, death, mass refugees, chaos, and perhaps civil war, which that would destabilize the entire region and likely draw Israel into a regional war.
Does all of this spell doom for the bull market? I would say no. The technical pullback has the market poised to move higher, and most of the economic numbers (here and abroad) support global economic recovery, albeit slow. True, that will lead the Fed to begin their dreaded tapering sooner rather than later, but we have to keep in mind that the Fed is not going to abandon us but rather stand vigilant to step in as needed.
The SPY closed Wednesday at 165.75. After losing key support levels (during the initial concerns about missiles raining on Syria), including its 50-day simple moving average, SPY has found friends in its 100-day SMA and the uptrend line from late June’s bullish reversal, which is also the lower support line of the neutral symmetrical triangle formation. Wednesday’s price action provided a breakout above the triangle, so we’ll watch for confirmation on Thursday-Friday and how it deals with the resistance levels above. Oscillators RSI, MACD, and Slow Stochastic all are pointed up from deeply oversold territory. A continued bounce could take SPY up to fill the price gap from mid-August, and perhaps retest resistance at 170.
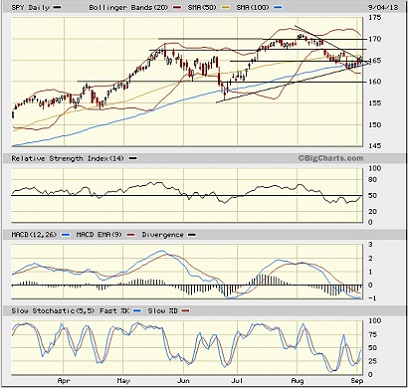
The CBOE Market Volatility Index (VIX), a.k.a. “fear gauge,” closed Wednesday at 15.88. It remains above the 15 threshold, although it is still low by historical standards.
All in all, I would say that U.S. equities are still en vogue, and pullbacks are buying opportunities. But beware; pullbacks in the current global environment might be greater than previous expectations.
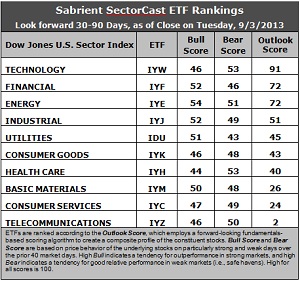
Latest rankings: The table ranks each of the ten U.S. business sector iShares ETFs by Sabrient's proprietary Outlook Score, which employs a forward-looking, fundamentals-based, quantitative algorithm to create a bottom-up composite profile of the constituent stocks within the ETF. The multi-factor model considers forward valuation, historical earnings trends, earnings growth prospects, the dynamics of Wall Street analysts' consensus estimates, accounting practices and earnings quality, and various return ratios. In addition, the table also shows Sabrient's proprietary Bull Score and Bear Score for each ETF.
High Bull score indicates that stocks within the ETF have tended recently toward relative outperformance during particularly strong market periods, while a high Bear score indicates that stocks within the ETF have tended to hold up relatively well during particularly weak market periods. Bull and Bear are backward-looking indicators of recent sentiment trend.
As a group, these three scores can be quite helpful for positioning a portfolio for a given set of anticipated market conditions.
Observations:
1. There was still not much in the way of sell-side net revisors to earnings estimates this week, so perhaps there isn’t much behind some of the shuffling in this week’s rankings. Still, the changes are intriguing. Technology (IYW) remains in the top spot with a robust Outlook score of 91. IYW displays a low forward P/E, a solid projected long-term growth rate, and the best return ratios. Financial (IYF) takes the second spot again with a score of 72 as it continues to display a low forward P/E, strong insider sentiment, and the most new Wall Street support (such as it is). Energy (IYE) continues to see its score rise, taking it up to a tie for second place, followed by Industrial (IYJ) at 51. After losing 16 points in its Outlook scores last week, Consumer Goods (IYK) lost another 14 points and fell to sixth place behind Utilities (IDU).
2. Telecom (IYZ) stays in the cellar yet again with a low Outlook score of 2. IYZ remains weak in most factors across the board, including a high forward P/E, low return ratios, poor insider sentiment, and modest long-term projected growth. Moving into the bottom two this week is Consumer Services (IYC)) with a score of 24, primarily due to relative poor analyst sentiment, although its projected long-term growth rate is still the highest.
3. This week’s fundamentals-based rankings maintain their bullish bias as the top four sectors are all economically sensitive -- Technology, Financial, Energy, and Industrial. However, the low score for Consumer Services continues to be a concern.
4. Looking at the Bull scores, Energy (IYE) has been the leader on particularly strong market days, scoring 54, while Healthcare (IYH) scores the lowest at 44. The top-bottom spread remains at 10 points, indicating relatively high sector correlations on particularly bullish market days, i.e., across-the-board buying during extreme market strength.
5. Looking at the Bear scores, Technology (IYW) and Healthcare (IYH) are the favorite “safe haven” on weak market days, scoring 53, while long-time safe-haven Utilities (IDU) is scoring the lowest at 43 -- which indicates to me bullish investor sentiment and a lack of fear. The top-bottom spread is a narrow 10 points, indicating relatively high sector correlations on particularly weak market days, i.e., across-the-board selling during extreme market weakness.
6. Overall, IYW shows the best all-weather combination of Outlook/Bull/Bear scores. Adding up the three scores gives a total of 190. IYZ is the by far the worst at 98. Looking at just the Bull/Bear combination, IYE displays the highest score of 105 this week, which indicates good relative performance in extreme market conditions (whether bullish or bearish), perhaps due to rising oil prices given the events in the Middle East, while IDU and IYK score the lowest at 94, which indicates investor avoidance during extreme conditions.
These Outlook scores represent the view that Technology and Financial sectors are still relatively undervalued, while Telecom in particular may be relatively overvalued based on our 1-3 month forward look.
Some top-ranked stocks within IYW and IYF that look good to me this week include Apple (AAPL), athenahealth (ATHN), Ameriprise Financial (AMP), and BlackRock (BLK).
Also, Sabrient’s annual Baker’s Dozen portfolio of top stocks for 2013 continues to outperform by a wide margin. It is now up +28.4% from the portfolio’s inception on January 11, more than doubling the S&P 500 return of +12.3% over the same timeframe. In fact, all 13 stocks are comfortably positive, and 12 are up by double digits, led by Jazz Pharmaceuticals (JAZZ) and Genworth Financial (GNW). (Note: last year’s portfolio was up +43%.)
Disclosure: Author has no positions in stocks or ETFs mentioned.
About SectorCast: Rankings are based on Sabrient’s SectorCast model, which builds a composite profile of each equity ETF based on bottom-up aggregate scoring of the constituent stocks. The Outlook Score employs a fundamentals-based multi-factor approach considering forward valuation, earnings growth prospects, Wall Street analysts’ consensus revisions, accounting practices, and various return ratios. It has tested to be highly predictive for identifying the best (most undervalued) and worst (most overvalued) sectors, with a 1-3 month forward look.
Bull Score and Bear Score are based on the price behavior of the underlying stocks on particularly strong and weak days during the prior 40 market days. They reflect investor sentiment toward the stocks (on a relative basis) as either aggressive plays or safe havens. So, a high Bull score indicates that stocks within the ETF have tended recently toward relative outperformance during particularly strong market periods, while a high Bear score indicates that stocks within the ETF have tended to hold up relatively well during particularly weak market periods.
Thus, ETFs with high Bull scores generally perform better when the market is hot, ETFs with high Bear scores generally perform better when the market is weak, and ETFs with high Outlook scores generally perform well over time in various market conditions.
Of course, each ETF has a unique set of constituent stocks, so the sectors represented will score differently depending upon which set of ETFs is used. For Sector Detector, I use ten iShares ETFs representing the major U.S. business sectors.
About Trading Strategies: There are various ways to trade these rankings. First, you might run a sector rotation strategy in which you buy long the top 2-4 ETFs from SectorCast-ETF, rebalancing either on a fixed schedule (e.g., monthly or quarterly) or when the rankings change significantly. Another alternative is to enhance a position in the SPDR Trust exchange-traded fund (SPY) depending upon your market bias. If you are bullish on the broad market, you can go long the SPY and enhance it with additional long positions in the top-ranked sector ETFs. Conversely, if you are bearish and short (or buy puts on) the SPY, you could also consider shorting the two lowest-ranked sector ETFs to enhance your short bias.
However, if you prefer not to bet on market direction, you could try a market-neutral, long/short trade—that is, go long (or buy call options on) the top-ranked ETFs and short (or buy put options on) the lowest-ranked ETFs. And here’s a more aggressive strategy to consider: You might trade some of the highest and lowest ranked stocks from within those top and bottom-ranked ETFs.