Buybacks: More Nuanced Than the Media Narrative Suggests
 by Ryan Frederick
Equity Analyst, Gradient Analytics LLC (a Sabrient Systems company)
Stock buybacks (or share repurchases – we will use the terms interchangeably) have garnered significant attention as publicly-traded companies have repurchased shares at record levels (in terms of dollars spent). In 2018, companies in the S&P 500 spent $806 billion on buybacks (about 3.8% of public float), shattering the previous record of $590 billion spent in 2007 (about 5.3% of public float) by 36.6%. Few topics provoke as intense of a response from those in the world of finance as to what role buybacks should play – whether in a given company’s cash management strategy or for the broader market as a whole. There are various viewpoints on the subject, but there’s a good chance you’ve primarily heard buybacks described in pejorative terms. The negative framing ranges from management using buybacks to manipulate EPS growth and share prices (with no underlying change in the company’s financial condition), to shortchanging long-term investments and employees, to cannibalization, to mis-spending tax cuts, to outright calls for the practice to be outlawed.
Indeed, it is easy to frame buyback programs in a negative light, and some of the connotations may be deserved. To be sure, corporate executives often focus so much on EPS performance that they might choose to engage in short-sighted and/or self-centered activities. (Whether they can get away with it is another matter.) However, the truth about buybacks is much more complicated than typically presented as there is a confluence of many factors and questions that must be considered, such as: What timeframe was used to analyze the effects? Was it the right timeframe? What are a company’s alternative investment opportunities before, during, and after a buyback program? Can an outsider refute with certainty what is/isn’t a good use of cash? What is the cost of capital and opportunity cost? What are the macroeconomic conditions, e.g., interest rates, fiscal policy, trade wars?
Moreover, do buybacks actually lift a given company’s share price and the value of an index that holds it? Is this practice such an epidemic and scourge on society that the federal government should step in to regulate what a private company (or by extension, its shareholders) can or cannot do with its cash? Should a buyback intended to reduce public float be made illegal once again (as it was until 1982)? We believe the answers to these questions are more nuanced than the media presents, so we will attempt to offer some additional insight. Read on….
What is Share Repurchasing and Why Do It?
In short, buybacks are the repurchasing of common or preferred shares previously issued to the public by the company that originally issued (directly or indirectly) those shares. In the end, the result is a return of cash to various shareholders. Which brings up an important point. Frequently when buybacks are criticized it is stated that the money could have been used for other investments that would have benefited long-term growth. This argument incorrectly implies that those funds “disappear” into the ether. More logically, shareholders can take those proceeds and allocate them to more profitable, value-added investments.
Theoretically, there are several (less headline grabbing) motives to buy back shares. A few of these include: (1) a belief shares are undervalued, (2) a lack of positive net present value (NPV) projects, (3) re-balancing the capital structure, (4) idle cash that carries expensive opportunity costs, (5) reducing the dilution effect of issuances to employees, and (6) lowering the weighted average cost of capital (WACC) and internal rate of return (IRR) threshold.
There also would seem to be a need to consider the talent and skill of both management and employees at envisioning, finding, and executing on investment opportunities and company goals. Management teams are only human and therefore come with varied levels of experience, education, intelligence, skill, leadership, connections, goals, and risk tolerances. Differences in these areas would affect management’s decision-making in all facets of operation.
Certainly, negative incentives to use buybacks do exist. Most obvious would be to meet executive compensation metrics tied to EPS (a clear agency problem), but also to beat the street’s EPS estimates and avoid the negative perception of missing such expectations. Having less volatile earnings performance could also be a goal. However, there are easier and more inconspicuous ways to manipulate earnings results in a given period (something we here at Gradient spend a great deal of time investigating). Furthermore, we believe the assumption that sophisticated investors (and corporate boards) are easily duped by such a rudimentary manipulation of an earnings metric (by simply reducing public float) is faulty.
Using Buybacks to Increase EPS and Meet Consensus Estimates:
In 2015, one study concluded that, yes, “the probability of share repurchases that increase earnings per share (EPS) is sharply higher for firms that would have ‘just missed’ the EPS forecast in the absence of the repurchase, when compared with firms that ‘just beat’ the EPS forecast.” However, there are some caveats to note. Evidence supporting the study was only observable when they narrowed the focus to companies which, absent buybacks, would have “just missed” EPS forecasts by a few cents. Furthermore, even after narrowing the sample, when faced with a potential EPS miss the probability of a repurchase swinging results to a meet/beat was found to increase from less than 1.5% to just 3.5% – not exactly great betting odds. Coupled with the sample size caveats, the study’s results hardly point to an EPS manipulation epidemic.
For fun, let’s look at a couple of company specific examples. Delta Airlines (DAL) used buybacks consistently in recent years. The company announced two $5 billion buyback programs since 2015 (in addition to smaller programs in prior years). Since the first $5 billion program announced on 5/13/15, weighted average shares outstanding had fallen by 17.8% though 3/31/19. Additionally, buybacks changed quarterly EPS performance (from miss to beat) in 13 of 16 quarters over that same period. As a result, it would be easy to infer (and write a provocative headline) that DAL manipulated EPS performance through buybacks. Indeed, in the 13 quarters in which EPS performance changed from miss to meet/beat concurrent with buyback activity, the average share price performance the day after announced earnings relative to the day before announced earnings was 1.2%. This seems to support the idea that artificially enhanced EPS performance boosted share price. However, there’s more to the DAL story. While EPS grew an average of 22.4% per quarter, non-GAAP net income grew an average of 16.2% per quarter showing the company’s EPS growth was not the result of buybacks alone.
Another example is Home Depot (HD). In 2017, HD implemented two buyback programs totaling about $19 billion (on 2/21/17 for $6 billion, and on 12/6/17 for $13 billion). Additionally, the company announced a $15 billion program on 2/26/19. Through 5/3/19, buybacks changed the result of EPS performance (from miss to beat) in 6 of 10 quarters. While several factors (e.g., revenue performance, customer growth, guidance, etc.) contribute to stock performance after an earnings report, it’s interesting to analyze the stock performance shortly after the EPS performance changes. In each of HD’s 6 quarters that changed from miss to beat in conjunction with buyback activity since early 2017, all six experienced a stock price decline measured from the day after an earnings announcement relative to the day prior to the announcement. This is opposite the phenomena observed in our DAL example.
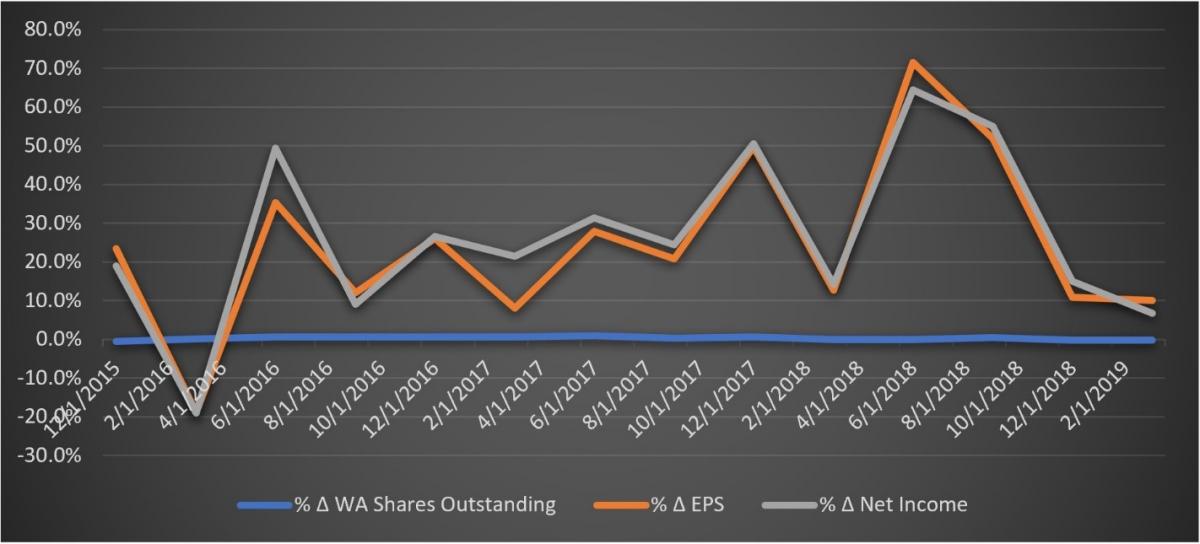
While both cases are clearly anecdotal, it falls in-line with the idea of complexity, which must be considered when examining the impact of buybacks, and of course, the intelligent investor will factor in more than just raw EPS performance. Our own general analysis of the S&P 500 companies’ aggregate quarterly results since Q4 2015 looked at the change in weighted average shares outstanding, EPS growth, and income growth. We found that on average, EPS growth appeared to be much more correlated with growth in net income than a change in share count, as shown in the chart below.
There also appears to be a chicken-or-egg problem. Did firms that were close to missing EPS targets repurchase shares because of poor market fundamentals or operational headwinds, or because of a lack of viable positive NPV investment projects? If the latter, then perhaps returning excess cash to shareholders should be viewed as a positive. After all, investing in projects that don’t add value would be detrimental to the firm’s stakeholders and the market-at-large, since that money could theoretically be allocated more efficiently elsewhere.
Of course, there’s no denying that shrinking the share count changes the EPS calculation (by reducing the denominator with no change in the numerator). However, the analyst must ask, how long have these buyback programs been in place? Are they on a long-standing schedule as a strategic policy, or were they introduced suddenly? Perhaps a serendipitous enhancement in EPS performance in any one period is simply a consequence of a larger buyback program and not strictly to manipulate the result. Perhaps a company that statistically registered as having used buybacks to inflate EPS also has used buybacks in other periods where it would not have meaningfully changed the EPS performance. Sorting out the seemingly nefarious from the coincidental and routine would involve a more rigorous analysis.
Other Ways to Manipulate EPS:
Here at Gradient Analytics we specialize in poring over financial statements and analyzing numerous financial metrics and footnotes. In doing so, we assess a firm’s “earnings quality” and strive to answer the question of whether a company’s financial performance reflects reality and is sustainable over the long term.
As discussed, buybacks are often used as headline fodder to insinuate that companies are misleading investors by artificially manipulating EPS results. Indeed, we too will frame buybacks negatively if they account for a significant proportion of positive EPS performance (but this alone would not be a sufficient indictment). However, there are more discreet ways to manipulate earnings. An entirely separate discussion could be had detailing these methods, but we’ll try to stick with the highlights.
To artificially enhance the top line, a firm might accelerate sales by offering discounts or extended payment terms to incentivize purchasing more in the current period at the expense of future periods (i.e., pull sales forward). The opposite can also occur. If a company has done exceedingly well in the current period, it could attempt to shift revenue to a later period. Even worse, revenue could be reported improperly or fraudulently in several ways or management could adjust the closing period date to allow accounting for more business. [Note that Gradient President Brent Miller wrote about some of these practices in a previous article (4/11/17) which described new accounting regulation ASC 606 addressing revenue recognition practices.]
Additionally, companies can use a variety of ways to boost income (and thus EPS). This can be done by executing one-time events such as selling a portion of the business, realizing investment gains, failing to write-down impaired assets, or misclassifying certain transactions. Furthermore, other income enhancing methods that deviate from the norm could include overstating capitalized costs and prepaid expenses, understating accrued expenses and asset reserve accounts (e.g., reserves for bad debts, allowances, warranties, etc.), changing amortization schedules/methodology, or improperly adding or removing certain transactions from non-GAAP metric calculations.
While these are just some of the methods that can be used to manipulate financial results, the point is that massaging EPS performance can be done in a variety of ways – many of which are more inconspicuous, complex, and harder to detect than following through on a previously announced buyback program. Alas, detection of these subtle performance manipulations requires more expertise, time, and diligent scrutiny, and is not as easy or sexy for a news headline.
Do Buybacks Inflate Stock and Index Prices?
Another common criticism is that massive buyback programs are the main reason that both stock and index prices have risen in recent years. Indeed, it seems logical that a company buying and retiring shares is both increasing demand while decreasing the supply of shares, and thus, prices should rise. Moreover, additional demand arising from a lower P/E ratio (indicating a more attractive valuation) also can put upward pressure on share prices. [Note: Scott Martindale (President of Sabrient Systems, parent company of Gradient Analytics) touched on this topic in a recent Sector Detector article (05/02/19), which is his monthly market letter that can be found on the Sabrient blog (and you can sign up for free email delivery, as well). I encourage you to go back and read his take if you have not already. In short, his main point is that, even if individual company share prices rise after a buyback (e.g., as investors bid up the shares to restore the P/E ratio to where it was beforehand), an index like the S&P 500 would not increase due to buybacks alone because it is a float-adjusted index.]
Ultimately, long-term, sustainable share price appreciation is associated with growth in total earnings, not just EPS. Several studies exist that do not support the idea of share prices necessarily increasing as a direct result of buybacks. One study done in 2006 found that investors did not reward EPS growth that was solely the result of share count reduction. In fact, it was found that firms that had managed to meet or beat earnings expectations primarily as a result of share repurchases, received a roughly 60% lower valuation premium than firms that met or exceeded expectations without repurchasing shares. This is consistent with the idea presented earlier that investors are not fooled by this practice.
Furthermore, if buybacks enhanced stock prices, we would expect firms that utilize them would have higher EPS growth rates than firms that do not, and of course, show better returns. In a 2017 study, a comparison was done between buyback and non-buyback companies by examining EPS growth rates for Russell 3000 constituents from 1991-2016. While acknowledging that an EPS growth rate comparison between buyback and non-buyback firms is not quite apples-to-apples, they found that firms that did not repurchase shares had EPS growth rates approximately 1.0% higher on average than companies that did repurchase shares.
Another question is to what extent investors care about EPS performance for a given company. What we mean is that there are numerous companies in which investors may be more concerned with factors other than EPS (at least in the near term), such as revenue growth, customer acquisition, user/subscriber growth, backlogs, future investment opportunities, positive guidance, efficiency gains, real income growth, etc. More and more frequently, you can find companies that can get away with missing revenue and/or EPS estimates if more coveted metrics are met that imply future value and growth. Often such companies are considered “disruptors” in the technology and consumer spaces.
Buybacks and the Use of Debt:
Once more, contrary to the negative narratives, there could be a variety of rational reasons for a firm to engage in share repurchases. For instance, there may be a lack of long-term investments worthy of a multi-million-dollar commitment, especially if the economic outlook is uncertain (such as amid a protracted trade war). For an investment to be worthwhile, it should be expected to add a positive NPV to the company or meet IRR thresholds. If those requirements can’t be met, then a buyback may be a sound alternative. As for using excess cash to increase (or begin paying) dividends, keep in mind that a one-time “special” dividend has no lasting impact on share price, and any increase in the regular quarterly dividend payment must be considered “permanent” to have a lasting beneficial stock price effect (since later cutting the regular dividend is always punished by the market), so making such a long-term commitment may not be optimal.
Regardless, idle cash comes with opportunity costs. Investors realize that if there are no worthwhile investments, then it’s better to return that cash to shareholders so they may reinvest the money in other companies or projects that might provide greater value. Again, it would seem to be a poor assumption that investors who sell shares back to the company do not then go and reinvest those proceeds productively (whether in other stocks, private investments elsewhere, or in consumption).
Buybacks are also employed for changing capital structures or lowering the weighted average cost of capital (WACC). While using debt to finance buybacks has been repeatedly castigated, there’s another view to be had. Given that for the bulk of time since the 2008 recession the Federal Reserve kept rates barely above zero, a company steward likely would be accused of dereliction of duty had he or she not taken on additional leverage to reduce the cost of capital. Reducing the WACC not only benefits the company but it could be argued also benefits the larger economy. Lowering the costs to do business allows for more room to compete on price, labor, and potential investment opportunities. Projects that were previously not viable for not exceeding IRR requirements could now be invested at the lower hurdle rate secured by increased debt financing.
Furthermore, Modigliani-Miller (MM) theory states that all else equal (in a tax environment), a firm with debt is more valuable than an equity-only firm due to the tax shield that is generated as a result of tax deductible interest expense. The reduction in taxes allows a company to generate more cash flow for investors and thus increases the value of the firm. For a leveraged buyback, increased debt may be a more reasonable explanation for the rising share price – i.e., not the buyback itself, but rather the increased cash flows to investors from tax-deductible interest. However, a portion of the value increase gets offset by the increased risk of a leveraged firm.
On the other hand, renowned hedge fund manager Stanley Druckenmiller has opined that too low of a hurdle rate may lead to the misallocation of capital, i.e., unwise or overly risky investments. And obviously, excessive use of leverage can be dangerous. WACC does not account for credit risk and asymmetric information. Increasing the amount of debt increases fixed interest costs and long-term liquidity obligations that burden a company. How expensive the financing is and the ability to pay it back determines how much an entity can take on. The goal is to both lower the WACC as much as possible without excessively increasing the risk of bankruptcy. Increasing the debt of a company increases the financial risk to shareholders and requires a higher return for assuming that risk, thus lowering the valuation (and offsetting the argument that debt-fueled buybacks are all upside to investors). Also, lenders want to get paid back and thus should act as a check on excessive risk-taking.
However, we acknowledge that market risk assessment can work better in theory than practice. Look no further than the role ratings agencies played in the Financial Crisis of 2008. Some investors, and even the Fed, warn that those same mistakes could be happening yet again. Unforeseen risks (or faulty risk assessment) can surprise even the most seasoned investors and underwriters. The domino effect created when one part of our interconnected global economy goes bad can be disastrous. Assessing a company’s ability to pay back debt shouldn’t rely exclusively on current company and market growth but also integrate stress-testing scenarios to observe the effects of low-probability negative events (and even more than the “worst event,” since the worst event to date doesn’t mean something even worse cannot occur). Governments placing their thumbs on the scale with loan guarantees and bailouts can also distort risk-taking incentives. While a full discussion of optimal capital structures and risk assessment is beyond the scope of this article, our main point is that in a low-interest rate environment, adding debt to lower the WACC is not necessarily an irrational decision.
Are Record Levels of Buybacks to the Detriment of Long-Term Investment and Employees?
On this question, we could argue yes and no. There are many anecdotes that suggest that managing earnings may hold back long-term investment. Indeed, in absolute dollars buybacks are at record levels relative to the past. However, when normalized using buybacks net of issuances and as a percentage of market capitalization, we get a slightly different story. In other words, buybacks may be larger because firms are larger and pricier. When assessing the net repurchase activity from 1990-2017 for the constituents of the Russell 3000 Index, it was found that after scaling repurchase activity to market capitalization, current buyback levels are not at all-time highs.
The relative size of buybacks has also been analyzed in another context. During the 2007-2016 period, it was found that firms distributed $7.0 trillion to shareholders through buybacks ($4.2 trillion) and dividends ($2.8 trillion). This amounted to 96% of net income during the same period. While at first staggering, it’s important to get the full picture. For instance, when also accounting for share issuances – both direct (sold to investors) and indirect (shares awarded to employees who then sell to investors) – the proportion of buybacks and dividends materially drops to 50% of net income. Furthermore, it was shown that while S&P 500 firms tended to buy back more shares than they issued, companies outside the S&P 500 were the opposite and issued more shares than they bought back. As a result, when accounting for all public firms, buybacks and dividends accounted for a materially smaller (41%) proportion of net income.
While distributing 41% of net income to shareholders still may seem significant (ignoring that the money was likely invested elsewhere) a poor understanding of accounting may also lead to assuming those distributions ate into long-term investment. This is because net income is derived after subtracting research and development (R&D) costs. In observing S&P 500 companies’ R&D spending relative to revenue for the past 25 years, R&D spending is at record highs. Moreover, total investment (including CapEx) has been well above the lows of early 2004.
Furthermore, even with higher absolute dollars spent on buybacks and R&D, cash balances remained healthy during the 2007-2016 period. In 2016, S&P 500 firms held $4.3 trillion in cash and short-term investments which was 54% higher than the $2.8 trillion held in 2007.
Let’s also touch on employees. One of the arguments is that buybacks only benefit shareholders and executives. This is not entirely true. Among S&P 500 companies, about 50% of equity issuances are to the firms’ own employees, and 85% of those are to non-executive employees (such as through profit-sharing and 401k plans). It’s also important to note that about 80% of the total workforce is employed by private and non-S&P 500 companies.
But those Tax Cuts Were Supposed to Fuel Long Term Capital Investment!
Sure, politicians intended for the tax reform bill to fuel increased capital investment into a company’s future growth, leading to things like new facilities, equipment and software upgrades, increased personnel hiring, and ultimately to rising wages and inflation. While we’ve already shown that overall investment is not abnormally low, this criticism ignores an important point – which is that while the amount of money on hand may broaden the selection of investment opportunities, it does not make a given investment more attractive or viable. Whether you come upon an extra $10 million or $100 million, it does not suddenly make a given $5 million investment with a negative NPV more attractive.
While historic tax cut legislation resulted in lower tax obligations and much more cash in the corporate coffers – not to mention companies also repatriated over a half-trillion dollars during 2018 – there are several crucial uncertainties remaining for which firms must account, primarily related to trade deals. First, while the USMCA has been agreed upon with Mexico and Canada, it has yet to be ratified by Congress, which includes surviving a hostile Democrat majority in the House. The US is also still negotiating with the European Union and of course, China. Given the uncertain timing and outcome of contentious trade negotiations, it’s not easy to make long-term commitments of vast sums of money to capital expenditures (although a number of companies are already doing so). The point is that fundamental structural changes are currently in flux that are likely to significantly transform the global economy, leading to changes in manufacturing, supply chain, and technological investment.
Should Share Count be Regulated or Made Illegal?
Because so much of the tax savings has been spent on buybacks, a cadre of news outlets, politicians, and even some investment professionals have called for regulations on buybacks – or to make them outright illegal. But who’s to say which centralized decision-making body should determine what investment opportunities exist or are best for a company and its investors? If share buybacks were to be regulated, perhaps it follows that new share issuances would be as well. What is the proper number of shares outstanding? Does it matter? The market will set a value on a company commensurate with its future expected cash flows and growth opportunities, irrespective of the number of shares outstanding. Share issuances and buybacks are an important mechanism for liquidity, funding, and facilitating the transfer of capital to the uses deemed most worthwhile.
As a side note, it is worth mentioning that there is another burgeoning movement among a contingent of CEOs (including John Mackey of Whole Foods Market), politicians, pundits, and investors to encourage companies to take a more holistic long-term view by considering all “stakeholders” when making investment decisions, rather than adhering solely to the Milton Friedman free-market view that business’ only responsibility is to maximize shareholder value. Stakeholders would include employees, suppliers, and customers, as well (and perhaps more broadly, society and the environment).
In closing, we acknowledge that agency issues can and do exist. There indeed are instances in which management has used buybacks improperly to meet EPS targets, whether to achieve executive compensation thresholds or in an attempt to prevent the stock from selling off. However, this seems like a problem best handled by shareholders and directors to properly align management’s incentives. Furthermore, as we have laid out, this practice does not appear to be systemic (nor particularly effective) in terms of market manipulation – no matter what the attention-grabbing media headlines might suggest. In our view, companies that engage in artificial EPS manipulation through share buybacks without real growth in the business are rarely rewarded by the market in the long term.
Disclosure: The author has no positions in stocks mentioned.
Disclaimer: This newsletter is published solely for informational purposes and is not to be construed as advice or a recommendation to specific individuals. Individuals should take into account their personal financial circumstances in acting on any opinions, commentary, rankings, or stock selections provided by Sabrient Systems or its wholly owned subsidiary Gradient Analytics. Sabrient makes no representations that the techniques used in its rankings or analysis will result in or guarantee profits in trading. Trading involves risk, including possible loss of principal and other losses, and past performance is no indication of future results.