Sector Detector: Against the Odds, Markets are Looking More Bullish
 On Wednesday, the S&P 500 rallied hard in the last 20 minutes to finish right near the flat line, but it still closed with a fractional loss, which makes it the fifth straight loss since last week’s Independence Day patriotic rally. It is now testing technical support at a level of prior-resistance-turned-support. Nevertheless, on balance, investors appear to be getting more and more cautiously optimistic, which might open the door for the bulls.
The Energy sector was the market leader for the day on Wednesday, as crude oil strengthened, while Technology and Industrial were notably weak. For the first three days of the week, Telecommunications has been quite strong, while Basic Materials has been quite weak.
To be sure, the bears are prowling. Nouriel Roubini (aka, “Dr. Doom”) was back in the news with a wet blanket saying that his “perfect storm” forecast for 2013 is unfolding as he predicted back in May, driven by slowing growth in the U.S., China and emerging markets, intractable debt problems in Europe, and costly military conflict in Iran.
And then there was David Rosenberg, chief economist for Gluskin Sheff, opining that the U.S. economy is in the midst of a depression rather than merely a double-dip recession as we keep hearing. He believes that governmental intervention has only served to prolong the economic malaise rather than allowing it to flush out with a quick but painful cleansing, and he predicts another three years before the economy recovers.
Yes, anxious investors have been facing a wall of worry. On top of all of the above, there’s persistent unemployment coupled with lower labor participation rates, an uninspiring start to earnings season, Wall Street’s continuing reduction in earnings growth forecasts, collapsing commodity prices, a depressed housing market, the Arab Spring and troubles in Syria and Egypt, uncertainty over Obamacare and the presidential election, the threat of tax hikes, and global flight-to-safety producing record-low U.S. Treasury yields. And yet stocks are holding up.
Germany boasts the strongest and most productive economy in the EU, but the financial burdens it must assume to prop up the others could prove to be too much. However, for the moment, things are looking more hopeful as central banks around the world have stepped up cooperatively and proactively by bailing out troubled banks and cutting interest rates.
On that subject, the next edition of The MacroReport will be released next week, and it will focus on Central Banks. A co-publication of Sabrient Systems and MacroRisk Analytics, The MacroReport provides in-depth analysis of the macroeconomic trends in focus regions and how they might impact the U.S., with specific actionable ideas (stocks and ETFs). Be sure to check it out.
By the way, the Exchange Traded Product (ETP) industry continues to grow. According to BlackRock, global inflows for the first half of 2012 were the largest ever for the global ETP Industry, attracting net new assets of about $105 billion (a 16% increase over first half 2011)—mostly for income-producing assets. Overall, global ETPs (including ETFs and ETNs) now boast AUM of about $1.68 trillion.
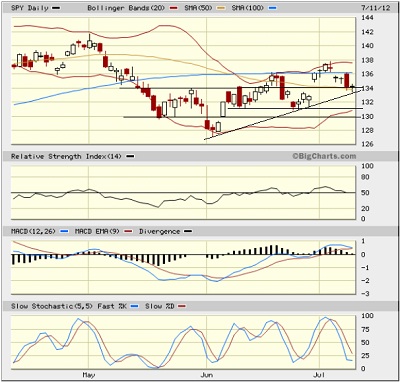
The SPY closed Wednesday at 134.16. Looking at the chart, SPY made a strong bullish move out of its ascending triangle pattern to close the month of June and rally into Independence Day. It has since pulled back to close the gap and now finds itself testing resistance-turned-support at the top of that ascending triangle near 134. In fact, intraday on Wednesday it actually bounced from the lower uptrend line of the triangle. Now near the apex of the triangle, SPY will have to take a direction. My guess is up. Slow Stochastic looks ready to turn back up, and RSI and MACD could easily do the same.

The VIX (CBOE Market Volatility Index—a.k.a. “fear gauge”) closed Tuesday at 17.95. After a couple of tests of resistance at 20, it has held firmly below, which is bullish for stocks.
I can’t forget to mention investor darling Apple (AAPL). The largest market-cap company has recaptured the $600 price threshold and seems to be consolidating for a move higher…and it would take the Tech sector and Nasdaq with it. There is huge anticipation of an iPhone 5, iPad mini, and Apple TV.
And finally, the Sabrient SectorCast-ETF rankings continue to display a bullish bias, as described below. All told, I am becoming quite bullish on stocks.
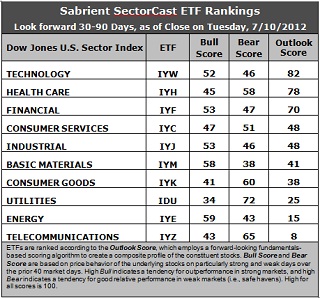
Latest rankings: The table ranks each of the ten U.S. industrial sector iShares (ETFs) by Sabrient’s proprietary Outlook Score, which employs a forward-looking, fundamentals-based, quantitative algorithm to create a bottom-up composite profile of the constituent stocks within the ETF. In addition, the table also shows Sabrient’s proprietary Bull Score and Bear Score for each ETF.
High Bull score indicates that stocks within the ETF have tended recently toward relative outperformance during particularly strong market periods, while a high Bear score indicates that stocks within the ETF have tended to hold up relatively well during particularly weak market periods. Bull and Bear are backward-looking indicators of recent sentiment trend.
As a group, these three scores can be quite helpful for positioning a portfolio for a given set of anticipated market conditions.

Observations:
1. There is only some minor shuffling in this week’s rankings. Technology (IYW) retains the top spot with an Outlook score of 82 this week, followed once again by Healthcare (IYH) at 76. Financial (IYF) in third at 75, and then there is a 22-point gap down to fourth place Consumer Services (IYC), which is tied with Industrial (IYJ) at 48. These rankings are reflective of an overall bullish bias, with the economically sensitive sectors like Technology, Financial, Consumer Services, Industrial, and Materials in the top six.
2. Telecom (IYZ) returns to the bottom of the Outlook rankings this week, as it is saddled with the highest (worst) forward P/E and the worst return ratios. Energy (IYE) climbs out of the bottom spot but remains in the bottom two. Although IYE lost more analyst support this week, its forward P/E was still able to improve a bit such that its overall Outlook score climbed slightly.
3. Looking at the Bull scores, Energy (IYE) remains the leader on strong market days, scoring 59. Materials (IYM) is close behind at 58. Utilities (IDU) is still by far the weakest on strong days, scoring 34. In other words, Materials and Energy stocks have tended to perform the best when the market is rallying, while Utilities stocks have lagged.
4. Looking at the Bear scores, Utilities (IDU) remains the strong investor favorite “safe haven” on weak market days, scoring an impressive 72. Although Materials (IYM) and Energy (IYE) are the investor favorites on strong market days, they have been abandoned (relatively speaking) by investors during market weakness, as reflected by their low Bear scores of 38 and 43. In other words, Materials and Energy stocks have tended to sell off the most when the market is pulling back, while Utilities stocks have held up the best—just the opposite of the Bull scores.
5. Overall, IYH now shows the best all-weather combination of Outlook/Bull/Bear scores. Adding up the three scores gives a total of 181. IYZ is the worst at 116; however, IYZ reflects the best combination of Bull/Bear at 108. Materials (IYM) displays the worst combination of Bull/Bear with an anemic 96.
These scores represent the view that the Technology and Healthcare sectors may be relatively undervalued overall, while Telecom and Energy sectors may be relatively overvalued, based on our 1-3 month forward look.
Top-ranked stocks within Technology and Healthcare sectors include CalAmp (CAMP), Procera Networks (PKT), Obagi Medical Products (OMPI), Orexigen Therapeutics (OREX).
Disclosure: Author has no positions in stocks or ETFs mentioned.
About SectorCast: Rankings are based on Sabrient’s SectorCast model, which builds a composite profile of each equity ETF based on bottom-up scoring of the constituent stocks. The Outlook Score employs a fundamentals-based multi-factor approach considering forward valuation, earnings growth prospects, Wall Street analysts’ consensus revisions, accounting practices, and various return ratios. It has tested to be highly predictive for identifying the best (most undervalued) and worst (most overvalued) sectors, with a one-month forward look.
Bull Score and Bear Score are based on the price behavior of the underlying stocks on particularly strong and weak days during the prior 40 market days. They reflect investor sentiment toward the stocks (on a relative basis) as either aggressive plays or safe havens. So, a high Bull score indicates that stocks within the ETF have tended recently toward relative outperformance during particularly strong market periods, while a high Bear score indicates that stocks within the ETF have tended to hold up relatively well during particularly weak market periods.
Thus, ETFs with high Bull scores generally perform better when the market is hot, ETFs with high Bear scores generally perform better when the market is weak, and ETFs with high Outlook scores generally perform well over time in various market conditions.
Of course, each ETF has a unique set of constituent stocks, so the sectors represented will score differently depending upon which set of ETFs is used. For Sector Detector, I use ten iShares ETFs representing the major U.S. business sectors.
About Trading Strategies: There are various ways to trade these rankings. First, you might run a sector rotation strategy in which you buy long the top 2-4 ETFs from SectorCast-ETF, rebalancing either on a fixed schedule (e.g., monthly or quarterly) or when the rankings change significantly. Another alternative is to enhance a position in the SPDR Trust exchange-traded fund (SPY) depending upon your market bias. If you are bullish on the broad market, you can go long the SPY and enhance it with additional long positions in the top-ranked sector ETFs. Conversely, if you are bearish and short (or buy puts on) the SPY, you could also consider shorting the two lowest-ranked sector ETFs to enhance your short bias.
However, if you prefer not to bet on market direction, you could try a market-neutral, long/short trade—that is, go long (or buy call options on) the top-ranked ETFs and short (or buy put options on) the lowest-ranked ETFs. And here’s a more aggressive strategy to consider: You might trade some of the highest and lowest ranked stocks from within those top and bottom-ranked ETFs, such as the ones I identify above.
