Sector Detector: Bears acquire new WMD (weapon of market destruction)
 Stock market bears needed a new weapon to fight off bold bulls, and they found it in the same place that WMD’s often emerge -- in the Middle East, this time in Syria. In this case, however, I’m not talking about a weapon of mass destruction, but rather a weapon of market destruction.
The Fed’s recent hints about tapering its quant easing in the near-term gave bears their first weapon to stem the bulls’ seemingly inexorable rise. Other imminent worries that have bolstered the bear story have included the looming debt ceiling and budget battle, a new Fed Chairman, slowing corporate earnings growth and housing, escalating oil prices, near-record levels of margin debt, the full impact of Obamacare, and near-civil war in Egypt. And let’s not forget the Hindenburg Omen. But just when the market seemed to be putting it all aside and launching a bounce, Syria trotted out their chemical weapons of mass destruction, and the inevitable U.S. response has given the bears a powerful new story.
Markets fear that a U.S. military strike could lead to a retaliatory strike against Israel, which would then set off a whole cascade of events that could spiral out of control. Long-term Treasuries have seen an uptick (and temporary reversal to the uptrend in yields). Oil and gold are the most notable beneficiaries of investor worry and the flight of capital from equities (i.e., “risk-off”), particularly the emerging markets.
If you look at a chart of the iShares MSCI Emerging Markets ETF (EEM) versus a U.S. market index like the SPDR S&P 500 Trust (SPY), they were highly correlated from the March 2009 bottom all the way through the end of 2012, but they have been moving in opposite directions so far in 2013. Central banks in these developing countries have been burning through reserves to prop up their currencies, but it is getting to point where they have to give up.
Of course, the U.S. Federal Reserve is not going to abandon us here at home, and in fact they might delay any pre-planned timing on tapering until at least December. The multiplier effect from their money-printing has been anemic, as banks have been reluctant to lend. Perhaps it is because the yield spread is too small. Rising longer-term interest rates resulting from an end to quant easing will steepen the yield curve and perhaps entice banks to lend the enormous amounts of cash idling on their balance sheets …. But it may also lead to higher mortgage rates that could stymie the housing market -- a classic double-edged sword.
The SPY closed Wednesday at 163.91. It lost support from its 50-day simple moving average, and it is now struggling to hang on at the 100-day. I discussed last week the head-and-shoulders top that confirmed and projected a price drop to at least 165. I suggested that the correction could end around there, or perhaps slightly lower like the 100-day SMA, and price indeed is trying to hold the line. I have drawn a possible neutral symmetrical triangle formation, with destination unknown. But given the severely oversold technical conditions, and given that the dire news has been trumping the technical patterns, we are due for a significant bounce to perhaps close the price gap from mid-August -- unless of course the situation with Syria escalates too far for investors to stomach. The 200-day SMA is quite a bit lower, down around 156. Oscillators RSI and Slow Stochastic both look as oversold as they were at the SPY’s June reversal point.
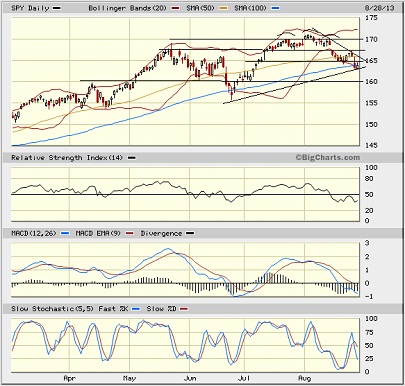
The CBOE Market Volatility Index (VIX), a.k.a. “fear gauge,” closed Wednesday at 16.49. It remains above the 15 threshold, which in today’s new reality implies elevated volatility, although it is still low by historical standards. Just as equities were long overdue for a larger pullback and mean reversion, VIX also was overdue for some mean reversion.
All in all, I would say that U.S. equities are still en vogue, and pullbacks are buying opportunities. But beware; pullbacks in the current global environment might be greater than previous expectations.
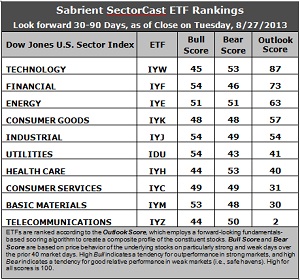
Latest rankings: The table ranks each of the ten U.S. business sector iShares ETFs by Sabrient's proprietary Outlook Score, which employs a forward-looking, fundamentals-based, quantitative algorithm to create a bottom-up composite profile of the constituent stocks within the ETF. The multi-factor model considers forward valuation, historical earnings trends, earnings growth prospects, the dynamics of Wall Street analysts' consensus estimates, accounting practices and earnings quality, and various return ratios. In addition, the table also shows Sabrient's proprietary Bull Score and Bear Score for each ETF.
High Bull score indicates that stocks within the ETF have tended recently toward relative outperformance during particularly strong market periods, while a high Bear score indicates that stocks within the ETF have tended to hold up relatively well during particularly weak market periods. Bull and Bear are backward-looking indicators of recent sentiment trend.
As a group, these three scores can be quite helpful for positioning a portfolio for a given set of anticipated market conditions.
Observations:
1. Not much change this week, primarily because some many on Wall Street are on vacation, so sell-side net revisors to earnings estimates didn’t have much impact. Technology (IYW) remains in the top spot with a robust Outlook score of 87. IYW displays a low forward P/E, a solid long-term projected growth rate, and the best return ratios. Financial (IYF) takes the second spot again with a score of 73 as it continues to display a low forward P/E, strong insider sentiment, and the most new Wall Street support (such as it is). Consumer Goods (IYK) lost 16 points in its Outlook score this week and lost its third place spot to Energy (IYE), which clocks in with a score of 63. IYK is fourth, followed by Industrial (IYJ) to round out the top five.
2. Telecom (IYZ) stays in the cellar yet again with a low Outlook score of 2. IYZ remains weak in all factors across the board, including a high forward P/E, low return ratios, poor insider sentiment, modest long-term projected growth, and relatively negative Wall Street sentiment. Also in the bottom two again this week is Basic Materials (IYM) with a score of 30.
3. This week’s fundamentals-based rankings maintain their bullish bias, despite the technical conditions and external news events. Technology, Financial, Energy, and Industrial remain in the top five, although their Outlook scores all came down slightly, mostly due to the quiet from Wall Street. Still the two-tier ranking remains in place, with the top five keeping their separation from the bottom five.
4. Looking at the Bull scores, Financial (IYF), Industrial (IYJ), and (surprisingly) Utilities (IDU) have been the leaders on particularly strong market days, scoring 54, while Healthcare (IYH) and Telecom (IYZ) the lowest at 44. The top-bottom spread has narrowed back to 10 points, indicating relatively high sector correlations on particularly bullish market days, i.e., across-the-board buying during extreme market strength.
5. Looking at the Bear scores, Technology (IYW) and Healthcare (IYH) are now the favorite “safe haven” on weak market days, scoring 53, while long-time favorite Utilities (IDU) has fallen all the way down to the lowest score of 43 (!) -- which indicates to me bullish investor sentiment and a lack of fear. The top-bottom spread is a narrow 10 points, indicating relatively high sector correlations on particularly weak market days, i.e., across-the-board selling during extreme market weakness.
6. Overall, IYW shows the best all-weather combination of Outlook/Bull/Bear scores. Adding up the three scores gives a total of 185. IYZ is the by far the worst at 96. Looking at just the Bull/Bear combination, IYJ displays the highest score of 103 this week, which indicates good relative performance in extreme market conditions (whether bullish or bearish), while IDU and IYZ score the lowest at 94, which indicates investor avoidance during extreme conditions.
These Outlook scores represent the view that Technology and Financial sectors are still relatively undervalued, while Telecom in particular may be relatively overvalued based on our 1-3 month forward look.
Some top-ranked stocks within IYW and IYF that look good to me this week include Cognizant Technology Solutions (CTSH), Harris Corp (HRS), Affiliated Managers Group (AMG), and Everest Re Group (RE).
Also, Sabrient’s annual Baker’s Dozen portfolio of top stocks for 2013 continues to outperform by a wide margin. It is now up +26% from the portfolio’s inception on January 11, more than doubling the S&P 500 return of +11% over the same timeframe. In fact, all 13 stocks are comfortably positive, and 12 are up by double digits.
Disclosure: Author has no positions in stocks or ETFs mentioned.
About SectorCast: Rankings are based on Sabrient’s SectorCast model, which builds a composite profile of each equity ETF based on bottom-up aggregate scoring of the constituent stocks. The Outlook Score employs a fundamentals-based multi-factor approach considering forward valuation, earnings growth prospects, Wall Street analysts’ consensus revisions, accounting practices, and various return ratios. It has tested to be highly predictive for identifying the best (most undervalued) and worst (most overvalued) sectors, with a 1-3 month forward look.
Bull Score and Bear Score are based on the price behavior of the underlying stocks on particularly strong and weak days during the prior 40 market days. They reflect investor sentiment toward the stocks (on a relative basis) as either aggressive plays or safe havens. So, a high Bull score indicates that stocks within the ETF have tended recently toward relative outperformance during particularly strong market periods, while a high Bear score indicates that stocks within the ETF have tended to hold up relatively well during particularly weak market periods.
Thus, ETFs with high Bull scores generally perform better when the market is hot, ETFs with high Bear scores generally perform better when the market is weak, and ETFs with high Outlook scores generally perform well over time in various market conditions.
Of course, each ETF has a unique set of constituent stocks, so the sectors represented will score differently depending upon which set of ETFs is used. For Sector Detector, I use ten iShares ETFs representing the major U.S. business sectors.
About Trading Strategies: There are various ways to trade these rankings. First, you might run a sector rotation strategy in which you buy long the top 2-4 ETFs from SectorCast-ETF, rebalancing either on a fixed schedule (e.g., monthly or quarterly) or when the rankings change significantly. Another alternative is to enhance a position in the SPDR Trust exchange-traded fund (SPY) depending upon your market bias. If you are bullish on the broad market, you can go long the SPY and enhance it with additional long positions in the top-ranked sector ETFs. Conversely, if you are bearish and short (or buy puts on) the SPY, you could also consider shorting the two lowest-ranked sector ETFs to enhance your short bias.
However, if you prefer not to bet on market direction, you could try a market-neutral, long/short trade—that is, go long (or buy call options on) the top-ranked ETFs and short (or buy put options on) the lowest-ranked ETFs. And here’s a more aggressive strategy to consider: You might trade some of the highest and lowest ranked stocks from within those top and bottom-ranked ETFs.