Sector Detector: Bulls await post-holiday reinforcements
 As we head into the homestretch of summer and the Labor Day holiday weekend, investors are anxious to see if next week brings elevated volume and the reinforcements to help the bulls break out. However, there’s no doubt that the bears are lurking in the wings to drive stocks down hard, given the right scenario. In any case, volume has been absolutely anemic as stocks have basically churned in place, and the market seems poised for a significant move one way or the other after a prolonged period within a narrow trading channel.
On Wednesday, the Commerce Department said GDP rose at a 1.7% annual rate during the second quarter, which is higher than the estimate of 1.5%, and the Fed Beige Book was mostly encouraging. Also, the National Association of Realtors reported further strengthening in the housing sector, as its index of pending-home sales rose 2.4% in July.
Healthcare has been particularly strong lately. The iShares Dow Jones U.S. Healthcare Sector Index Fund (IYH) and the Health Care Select Sector SPRD Fund (XLV) both hit all-time highs on Wednesday. Also at or near their all-time highs are the consumer-oriented iShares and Select Sector SPDR ETFs, including IYC, IYK, XLP, and XLY. Notably, Yelp (YELP) bucked the trend of social media companies selling off upon expiration of the lock-up period, surging over 3% on Wednesday.
U.S. stocks have steadily climbed since early June on low volume—ever since ECB President Mario Draghi promised to do "whatever it takes" to save the euro. The major indexes have held their psychologically important support levels of Dow 13,000, Nasdaq 3,000, S&P 500 1400, and Russell 2000 800.
Now, as we head into the two most notorious months of the year, September and October, with stocks near their highs, the bulls are hoping for some sort of supportive announcement from one of the central banks over the next few weeks. First up is Chairman Bernanke at the annual monetary policy conference of central bankers on Friday in Jackson Hole, WY (although Draghi apparently announced that he was too busy to attend). Then on September 6, the ECB will decide whether to begin its own quantitative easing strategy. Finally we’ll see what comes from the next FOMC meeting on September 12-13.
However, there are many compelling reasons why the Fed might choose not to launch a QE3. Chief among them is that banks simply don’t need or want more cash. When the Fed buys Treasuries, bank reserves are increased so that the banking system will increase loan-based demand deposits. But the big banks are already holding more than $1 trillion cash in combined excess reserves. Rather than wanting to sell their Treasury bonds to obtain even more lendable capital, these banks would likely prefer to hold them as interest-earning collateral for their highly profitable trading activities.
Looking at the S&P 500 SPDR Trust (SPY) chart, It closed Wednesday at 141.51. After trading above 143 on August 21 to reach its highest levels since mid-2008, it has gone moribund during these final dog days of summer. SPY has been trading within a bullish rising channel for over 3 months, and many market observers still say we are way overdue for at least a minor correction. SPY has been contending with strong technical resistance from the April-May closing highs near 142, and now might be forming a bullish ascending triangle within the established rising channel. Price still sits above the 20-, 50-, 100- and 200-day SMAs, and in fact the 20-day has been lending support since Friday.
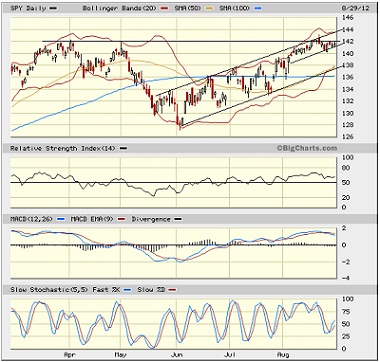
If markets try to correct, there are several interim support levels, including Friday’s low near 140, the rising 50-day SMA and the bottom of the larger rising channel approaching 138, the 100-day SMA near 136, and then the 200-day SMA near 134.
The VIX (CBOE Market Volatility Index—a.k.a. “fear gauge”) has continued to rise, closing Wednesday at 17.06, which is right at its 50-day SMA. However, its Stochastics are extremely overbought.
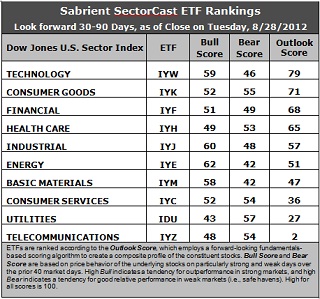
Latest rankings: The table ranks each of the ten U.S. industrial sector iShares (ETFs) by Sabrient’s proprietary Outlook Score, which employs a forward-looking, fundamentals-based, quantitative algorithm to create a bottom-up composite profile of the constituent stocks within the ETF. In addition, the table also shows Sabrient’s proprietary Bull Score and Bear Score for each ETF.
High Bull score indicates that stocks within the ETF have tended recently toward relative outperformance during particularly strong market periods, while a high Bear score indicates that stocks within the ETF have tended to hold up relatively well during particularly weak market periods. Bull and Bear are backward-looking indicators of recent sentiment trend.
As a group, these three scores can be quite helpful for positioning a portfolio for a given set of anticipated market conditions.
Observations:
1. Technology (IYW) remains in the top spot with an Outlook score of 79. Stocks within IYW are displaying relatively low forward P/Es, strong projected long-term growth, and solid return ratios. However, the analysts have been reducing forward earnings estimates overall. Consumer Goods (IYK) makes a huge jump from eighth to second, with a 33-point increase in its Outlook score, primarily due to strong relative support from Wall Street. Financial (IYF), Healthcare (IYH), and Industrial (IYJ) round out the top five.
2. Telecom (IYZ) stays at the bottom of the Outlook rankings this week with a rock-bottom Outlook score of 2. It’s not the worst in every factor in the quant model, but it’s close. Stocks within the sector are hobbled by the highest forward P/E and the worst return ratios, and this week Wall Street analysts came out with net downgrades. Utilities (IDU) is back down in the bottom two with a score of 27. It continues to be hampered by a high forward P/E and the worst projected long-term growth rate.
3. Overall, this week’s rankings are a mixed bag between the offensive and defensive sectors such that I would categorize the rankings as neutral.
4. Looking at the Bull scores, Energy (IYE) is the clear leader on strong market days, scoring 62, followed by Industrial (IYJ). Utilities (IDU) is still by far the weakest on strong days, scoring 43, which is somewhat improved. In other words, Energy stocks have tended to perform the best when the market is rallying, while Utilities stocks have lagged.
5. Looking at the Bear scores, Utilities (IDU) remains the investor favorite “safe haven” on weak market days, scoring 57. Energy (IYE), which has the highest Bull score, has been abandoned (relatively speaking) by investors during market weakness, as reflected by its low Bear score of 42, which is actually tied this week with Basic Materials (IYM). In other words, Energy and Materials stocks have tended to sell off the most when the market is pulling back, while Utilities stocks have held up the best.
6. Overall, Technology (IYW) again shows the best all-weather combination of Outlook/Bull/Bear scores. Adding up the three scores gives a total of 184. Telecom (IYZ) is the worst at 104. As for Bull/Bear combination, Industrial (IYJ) is the best with 108, while Financial (IYF), Materials (IYM), and Utilities (IDU) share the worst at 100.
These scores represent the view that the Technology and Consumer Goods sectors may be relatively undervalued overall, while Telecom and Utilities sectors may be relatively overvalued based on our 1-3 month forward look.
Top-ranked stocks within IYW and IYK include Gartner Inc. (IT), Equinix Inc. (EQIX), The J.M. Smucker Co. (SJM), and Whirlpool Corp (WHR).
Disclosure: Author has no positions in stocks or ETFs mentioned.
About SectorCast: Rankings are based on Sabrient’s SectorCast model, which builds a composite profile of each equity ETF based on bottom-up aggregate scoring of the constituent stocks. The Outlook Score employs a fundamentals-based multi-factor approach considering forward valuation, earnings growth prospects, Wall Street analysts’ consensus revisions, accounting practices, and various return ratios. It has tested to be highly predictive for identifying the best (most undervalued) and worst (most overvalued) sectors, with a 1-3 month forward look.
Bull Score and Bear Score are based on the price behavior of the underlying stocks on particularly strong and weak days during the prior 40 market days. They reflect investor sentiment toward the stocks (on a relative basis) as either aggressive plays or safe havens. So, a high Bull score indicates that stocks within the ETF have tended recently toward relative outperformance during particularly strong market periods, while a high Bear score indicates that stocks within the ETF have tended to hold up relatively well during particularly weak market periods.
Thus, ETFs with high Bull scores generally perform better when the market is hot, ETFs with high Bear scores generally perform better when the market is weak, and ETFs with high Outlook scores generally perform well over time in various market conditions.
Of course, each ETF has a unique set of constituent stocks, so the sectors represented will score differently depending upon which set of ETFs is used. For Sector Detector, I use ten iShares ETFs representing the major U.S. business sectors.
About Trading Strategies: There are various ways to trade these rankings. First, you might run a sector rotation strategy in which you buy long the top 2-4 ETFs from SectorCast-ETF, rebalancing either on a fixed schedule (e.g., monthly or quarterly) or when the rankings change significantly. Another alternative is to enhance a position in the SPDR Trust exchange-traded fund (SPY) depending upon your market bias. If you are bullish on the broad market, you can go long the SPY and enhance it with additional long positions in the top-ranked sector ETFs. Conversely, if you are bearish and short (or buy puts on) the SPY, you could also consider shorting the two lowest-ranked sector ETFs to enhance your short bias.
However, if you prefer not to bet on market direction, you could try a market-neutral, long/short trade—that is, go long (or buy call options on) the top-ranked ETFs and short (or buy put options on) the lowest-ranked ETFs. And here’s a more aggressive strategy to consider: You might trade some of the highest and lowest ranked stocks from within those top and bottom-ranked ETFs.