Sector Detector: Charts, rankings, psychology remain bullish
 Markets have been signaling a willingness to look past the deluge of troubling news and move higher. This is bullish behavior. On Tuesday, market psychology displayed its positivity as initial weakness on bad news was quickly reversed. Rather than demanding that the Fed initiate a QE3, investors seem to be happier with indications from the Fed that the economy might be able to muddle along without it.
Political fists seem to be flying in greater force and frequency as both the presidential election and the fiscal cliff draw nearer. We are seeing escalation in both class warfare and big government vs. free market. President Obama was quoted in a speech that business does not succeed in a vacuum but depends upon government to create the environment and infrastructure (e.g., roads, utilities, educated workforce) to thrive—which Governor Romney enthusiastically jumped on as insulting to risk-taking entrepreneurs. But at the same time, Romney’s past with Bain Capital has become the bane of his campaign as he profited handsomely from his family connections without having to take risks, often through restructuring of struggling companies that led to job cuts—which Obama has enthusiastically jumped on as lacking understanding and compassion.
It’s no surprise that a populist message can gain extra traction when times are hard—not just in the third world but also right here in the U.S. If you lack an adequate safety net, need can trump reason such that the distasteful strategy of printing money to minimize our economic pain and maintain our vast entitlement system becomes more palatable than keeping the faith that the unobstructed marketplace will provide more richly in the long run. In other words, fear trumps greed, and when the short run is too scary, the long run is ignored.
Although we rightly revere our democratic processes, we also must keep in mind that it is not democracy that has created the incredible innovation, progress and wealth that we enjoy today—it is capitalism. Even the Chinese have recognized this. Let’s not forget it.
I mentioned last week that even while Fed Chairman Bernanke has been downplaying the risks of a double-dip recession, the likes of “Dr. Doom” Nouriel Roubini and David Rosenberg have been warning of depression afoot. And now Peter Schiff, CEO and Chief Global Strategist of Euro Pacific Capital, is in the news saying that the U.S. economy is heading for an economic crash that will make 2008 look like a cakewalk. He thinks that the central banks’ stimulus programs merely serve to delay and worsen the eventual meltdown, which will be worse than what Europe is now experiencing. He says you should protect yourself against the crash of the U.S. dollar by getting out of cash and Treasuries and moving into stocks with strong multinational business models, as well as into silver and gold.
Just saying.
Let’s look at the chart. The SPY closed Wednesday at 137.37. It broke out strongly from the ascending triangle formation and bounced off of support at the bottom of the rising channel. In fact, intraday on Wednesday it actually bounced from the lower uptrend line of the triangle. SPY now finds itself trying to break through tough resistance at the 100-day simple moving average near 137, which is also an important longer-term threshold. RSI and MACD are both confirming price action with higher highs and higher lows. Slow Stochastic is now a bit overbought, so we might need a little technical consolidation here at this area of strong resistance before the next attempt at moving higher. But the chart is bullish indeed.
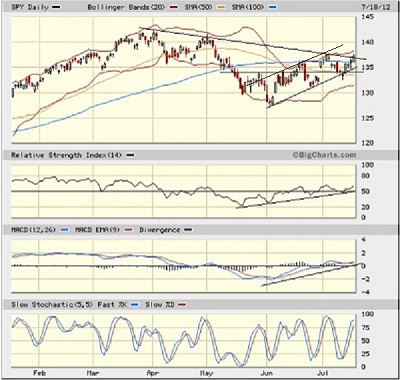
The VIX (CBOE Market Volatility Index—a.k.a. “fear gauge”) closed Tuesday at 16.16. It hasn’t tried to test resistance at the important 20 level in three weeks, which is bullish for stocks.
The Fed and central banks have successfully driven down safe-haven government bond yields so much that income investors are being forced to seek dividend-paying equities. Oh, and let’s not overlook that short interest on the NYSE is now higher than last September's extreme of 5.3%--just prior to that powerful six-month rally, which was kicked off largely by massive short covering. Investment professionals are well aware of this, and they cannot afford to miss out on a breakout.
Yes, the bulls appear to be in control for now.
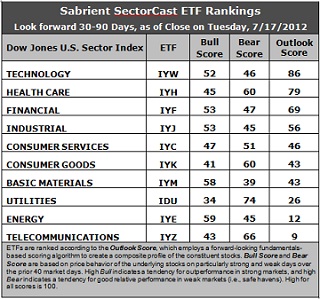
Latest rankings: The table ranks each of the ten U.S. industrial sector iShares (ETFs) by Sabrient’s proprietary Outlook Score, which employs a forward-looking, fundamentals-based, quantitative algorithm to create a bottom-up composite profile of the constituent stocks within the ETF. In addition, the table also shows Sabrient’s proprietary Bull Score and Bear Score for each ETF.
High Bull score indicates that stocks within the ETF have tended recently toward relative outperformance during particularly strong market periods, while a high Bear score indicates that stocks within the ETF have tended to hold up relatively well during particularly weak market periods. Bull and Bear are backward-looking indicators of recent sentiment trend.
As a group, these three scores can be quite helpful for positioning a portfolio for a given set of anticipated market conditions.
Observations:
1. Little change in this week’s rankings. Technology (IYW) retains the top spot with an Outlook score of 86, followed once again by Healthcare (IYH) at 79 and Financial (IYF) at 69. Industrial (IYJ) gained some strength to move into fourth place and close the gap with IYF. These rankings continue to reflect an overall bullish bias, with the economically sensitive sectors like Technology, Financial, Industrial, and Consumer Services in the top five.
2. Telecom (IYZ) returns to the bottom of the Outlook rankings this week with an anemic score of 9, as it is saddled with the highest (worst) forward P/E and the worst return ratios. Energy (IYE) remains in the bottom two with a score of 12. IYE continues to lose analyst support.
3. Looking at the Bull scores, Energy (IYE) remains the leader on strong market days, scoring 59. Materials (IYM) is close behind at 58. Utilities (IDU) is still by far the weakest on strong days, scoring 34. In other words, Materials and Energy stocks have tended to perform the best when the market is rallying, while Utilities stocks have lagged.
4. Looking at the Bear scores, Utilities (IDU) remains the strong investor favorite “safe haven” on weak market days, scoring 74. Although Materials (IYM) is an investor favorite on strong market days, the sector has been abandoned (relatively speaking) by investors during market weakness, as reflected by its low Bear score of 39. In other words, Materials stocks have tended to sell off the most when the market is pulling back, while Utilities stocks have held up the best.
5. Overall, IYW and IYH share the best all-weather combination of Outlook/Bull/Bear scores. Adding up the three scores gives a total of 184. IYE is the worst at 116. IYZ reflects the best combination of Bull/Bear at 109. Materials (IYM) displays the worst combination of Bull/Bear with a dismal 97.
These scores represent the view that the Technology and Healthcare sectors may be relatively undervalued overall, while Telecom and Energy sectors may be relatively overvalued, based on our 1-3 month forward look.
Top-ranked stocks within Technology and Healthcare sectors include Seagate Technology (STX), NetEase (NTES), Spectrum Pharmaceuticals (SPPI), and United Therapeutics (UTHR).
Disclosure: Author has no positions in stocks or ETFs mentioned.
About SectorCast: Rankings are based on Sabrient’s SectorCast model, which builds a composite profile of each equity ETF based on bottom-up scoring of the constituent stocks. The Outlook Score employs a fundamentals-based multi-factor approach considering forward valuation, earnings growth prospects, Wall Street analysts’ consensus revisions, accounting practices, and various return ratios. It has tested to be highly predictive for identifying the best (most undervalued) and worst (most overvalued) sectors, with a one-month forward look.
Bull Score and Bear Score are based on the price behavior of the underlying stocks on particularly strong and weak days during the prior 40 market days. They reflect investor sentiment toward the stocks (on a relative basis) as either aggressive plays or safe havens. So, a high Bull score indicates that stocks within the ETF have tended recently toward relative outperformance during particularly strong market periods, while a high Bear score indicates that stocks within the ETF have tended to hold up relatively well during particularly weak market periods.
Thus, ETFs with high Bull scores generally perform better when the market is hot, ETFs with high Bear scores generally perform better when the market is weak, and ETFs with high Outlook scores generally perform well over time in various market conditions.
Of course, each ETF has a unique set of constituent stocks, so the sectors represented will score differently depending upon which set of ETFs is used. For Sector Detector, I use ten iShares ETFs representing the major U.S. business sectors.
About Trading Strategies: There are various ways to trade these rankings. First, you might run a sector rotation strategy in which you buy long the top 2-4 ETFs from SectorCast-ETF, rebalancing either on a fixed schedule (e.g., monthly or quarterly) or when the rankings change significantly. Another alternative is to enhance a position in the SPDR Trust exchange-traded fund (SPY) depending upon your market bias. If you are bullish on the broad market, you can go long the SPY and enhance it with additional long positions in the top-ranked sector ETFs. Conversely, if you are bearish and short (or buy puts on) the SPY, you could also consider shorting the two lowest-ranked sector ETFs to enhance your short bias.
However, if you prefer not to bet on market direction, you could try a market-neutral, long/short trade—that is, go long (or buy call options on) the top-ranked ETFs and short (or buy put options on) the lowest-ranked ETFs. And here’s a more aggressive strategy to consider: You might trade some of the highest and lowest ranked stocks from within those top and bottom-ranked ETFs, such as the ones I identify above.