Sector Detector: Forward-looking rankings solidify bullish bias
-
 Stock investors are surveying the view from these lofty heights, with the S&P 500 trying to hold up just below the 1700 level, and they appear to be feeling some vertigo. They are wondering if there will be a catalyst to take stocks higher before Labor Day, or if the dreaded correction is imminent. However, my concern is that investors might be hamstrung by a perceived no-win situation.
As I discussed last week, earnings growth is now a prerequisite for a sustained rise in equity prices (as the P/E multiple approaches a practical ceiling) -- and it will have to be led by revenue growth from now on, as cost cutting and productivity improvements have been about maxed out. But with the Fed now focused solely on the economic data as it anxiously awaits an opportunity to begin tapering its bond buying programs, it might be creating a Catch-22. Any good economic news makes Fed tapering more likely, which scares investors about the market’s ability to move up without the Fed’s intervention. But if the economic numbers are weak, there is little reason to anticipate the critical revenue growth that companies will require, even with the Fed’s injection of crisp new dollars.
Nevertheless, I remain confident that investor sentiment -- unencumbered by worries of global financial Armageddon, Eurozone sovereign debt defaults, or a China growth slowdown -- eventually will find a way forward. However, the bigger obstacle actually may emanate from our own government, e.g., a Federal government that cannot function and municipalities that may have to resort to bankruptcy court to get out from under massive budget deficits and pension liabilities.
Of course, American business has proven time and again that it can find a path to prosperity no matter which party is in power. They just need to know what the rules are. While gridlock is usually good in that it prevents our elected representatives from meddling too much, it also can be bad if it leads to a government shutdown and the paralysis of uncertainty among entrepreneurs and corporate leaders. With an economy struggling to find its footing, widespread underemployment, and fresh college grads unable to find entry-level work in their target fields, now is not the time for more brinksmanship in government (despite their noble intentions).
With high stock correlations (i.e., all boats generally rising or falling together), stock picking has been difficult -- particularly for those trying to sell short, as this has been like swimming against a riptide. Nevertheless, Sabrient subsidiary Gradient Analytics has been finding some success in these shark-infested waters. Gradient is a forensic accounting research firm that provides the buy-side with supplemental research primarily focused on identifying red flags that indicate higher risk of earnings misses or restatement, which is valuable for risk monitoring of long positions or for identifying high-potential short candidates.
Some stocks with negative Gradient ratings that announced disappointing news recently include Orthofix International (OFIX), Ralph Lauren (RL), Haemonetics (HAE), Open Text (OTEX), Infinera (INFN), KBR Inc (KBR), and foreign listings Royal Imtech, Canon, and China Shanshui Cement.
For example, Gradient began pounding the table on Royal Imtech back in September 2011 due to troublesome earnings quality trends, including work-in-progress assets. The stock has been a complete train wreck since then. Also, Orthofix International NV (OFIX) announced on Wednesday that it will be restating the past couple of years’ reports due to revenue recognition issues. Gradient first issued a comprehensive report in late April noting that sales channels were overfilled and that revenue may have been prematurely recognized in 2012.
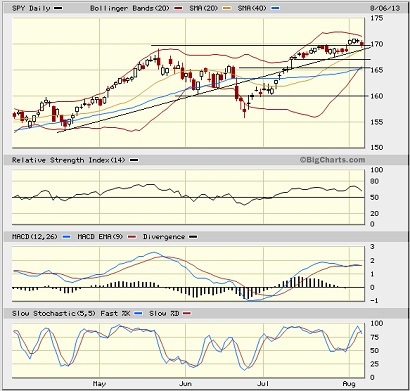
Looking at the chart of the SPDR S&P 500 Trust (SPY), it closed Wednesday at 169.18 after setting a new all-time high last Friday just below 171. SPY remains above all its major moving averages and the uptrend line from November. I also have drawn on the chart an uptrend line since the April lows that has been supporting recent price action of higher lows, and in fact, it may be serving as the lower line of a bullish ascending triangle, in which just below 170 represents the flat upper line of the triangle. This bullish formation appeared last week like it was simply awaiting the next catalyst for a breakout, but the initial breakout looks like it may have been a false move. Or perhaps it is simply retesting the bullish conviction of the breakout. In any case, price is right at the apex of the triangle, so something is going to break. Oscillators RSI, MACD, and Slow Stochastic are all looking either bearish or neutral, but there are plenty of lines of support nearby, as shown, including the 20-day simple moving average, which has converged with the lower line of the triangle.
Something to keep in mind is that we really haven’t seen much of a correction since last November. Although the quick pullback in June might be all investors are willing to give up, similar to what we saw in May of last year, it’s possible that we’ll encounter something a little scarier before the market undertakes a renewed upward march. In any case, with so many investors still looking for an entry point, it’s unlikely that anything more than a minor pullback will occur.
As the market remains near its all-time high, it’s no surprise that the CBOE Market Volatility Index (VIX), a.k.a. “fear gauge,” remains historically low. It closed Wednesday at 12.98, which keeps it in the zone of high complacency (and low fear) below 15.
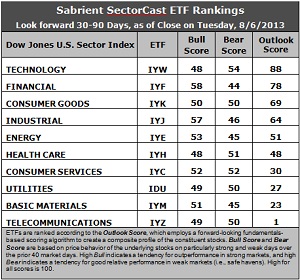
Latest rankings: The table ranks each of the ten U.S. business sector iShares ETFs by Sabrient's proprietary Outlook Score, which employs a forward-looking, fundamentals-based, quantitative algorithm to create a bottom-up composite profile of the constituent stocks within the ETF. The multi-factor model considers forward valuation, historical earnings trends, earnings growth prospects, the dynamics of Wall Street analysts' consensus estimates, accounting practices and earnings quality, and various return ratios. In addition, the table also shows Sabrient's proprietary Bull Score and Bear Score for each ETF.
High Bull score indicates that stocks within the ETF have tended recently toward relative outperformance during particularly strong market periods, while a high Bear score indicates that stocks within the ETF have tended to hold up relatively well during particularly weak market periods. Bull and Bear are backward-looking indicators of recent sentiment trend.
As a group, these three scores can be quite helpful for positioning a portfolio for a given set of anticipated market conditions.
Observations:
1. Technology (IYW) remains in the top spot with an Outlook score of 88. IYW displays a low forward P/E, a solid long-term projected growth rate, and the best return ratios. Financial (IYF) takes the second spot once again with a score of 78 as it enjoys a low forward P/E, strong insider sentiment, and a continued increase in earnings estimates from Wall Street analysts. Consumer Goods (IYK) remains in third place with an Outlook score of 69. Industrial (IYJ) and Energy (IYE) round out the top five.
2. Telecom (IYZ) stays in the cellar yet again with a meager Outlook score of 1. IYZ is generally weak in all factors across the board, including a high forward P/E, modest long-term projected growth, and poor return ratios. Plus, stocks in the sector got smacked this week with a rash of earnings downgrades from Wall Street. Also in the bottom two again this week is Basic Materials (IYM) with a score of 23, as stocks within the sector got a hit with even more reductions to earnings estimates.
3. This week’s fundamentals-based rankings have further solidified the slightly bullish bias I have been observing over the past several weeks, with Technology, Financial, Industrial, and Energy in the top five. In fact, IYJ continues to climb in its Outlook score, boasting a solid 64 this week. It is notable that some sectors clearly are receiving more in the way of Wall Street earnings upgrades, like Financial, Consumer Goods, Industrial, and Healthcare, while others are getting hit with downgrades, like Energy, Materials, Telecom, and Utilities. I’m still looking for a better showing from Consumer Services (IYC) to firm up the bullishness of the rankings. Also, I see three clear groups emerging, with IYW, IYF, IYK, and IYJ at the top; IYC, IDU, IYM, and IYZ at the bottom; and IYE and IYH stuck in the middle.
4. Looking at the Bull scores, IYF has been the leader on particularly strong market days, scoring 58, followed closely by IYJ at 57, while Technology (IYW) and Healthcare (IYH) score the lowest at 48. The top-bottom spread is a narrow 10 points, indicating relatively high sector correlations on bullish market days, i.e., all boats are lifted together rather than a thoughtful stock-picking approach.
5. Looking at the Bear scores, IYW remains the surprising favorite “safe haven” on weak market days, scoring 54, and seems to have supplanted long-time favorite Utilities (IDU) -- which is another bullish signal. Still, it is nowhere near the former highs in Bear scores of around 65-70 that we regularly witnesses in the recent past. IYF now displays the worst performance during extreme market weakness as reflected in the low Bear score of 44, probably due to profit-taking given the recent strength in this sector. The top-bottom spread is a narrow 10 points, indicating relatively high sector correlations on weak market days.
6. Overall, Technology (IYW) shows the best all-weather combination of Outlook/Bull/Bear scores. Adding up the three scores gives a total of 190. Telecom (IYM) is the by far the worst at 100. Looking at just the Bull/Bear combination, Consumer Services (IYC) displays the highest score of 104, which indicates good relative performance in extreme market conditions (whether bullish or bearish), while Materials (IYM) scores the lowest at 96, which indicates investor avoidance during extreme conditions.
These Outlook scores represent the view that Technology and Financial sectors are still relatively undervalued, while Telecom and Basic Materials sectors may be relatively overvalued based on our 1-3 month forward look.
Some top-ranked stocks within IYW and IYF that look good to me this week include CACI International (CACI), VMware (VMW), Affiliated Managers Group (AMG), and M&T Bank (MTB).
Disclosure: Author has no positions in stocks or ETFs mentioned.
About SectorCast: Rankings are based on Sabrient’s SectorCast model, which builds a composite profile of each equity ETF based on bottom-up aggregate scoring of the constituent stocks. The Outlook Score employs a fundamentals-based multi-factor approach considering forward valuation, earnings growth prospects, Wall Street analysts’ consensus revisions, accounting practices, and various return ratios. It has tested to be highly predictive for identifying the best (most undervalued) and worst (most overvalued) sectors, with a 1-3 month forward look.
Bull Score and Bear Score are based on the price behavior of the underlying stocks on particularly strong and weak days during the prior 40 market days. They reflect investor sentiment toward the stocks (on a relative basis) as either aggressive plays or safe havens. So, a high Bull score indicates that stocks within the ETF have tended recently toward relative outperformance during particularly strong market periods, while a high Bear score indicates that stocks within the ETF have tended to hold up relatively well during particularly weak market periods.
Thus, ETFs with high Bull scores generally perform better when the market is hot, ETFs with high Bear scores generally perform better when the market is weak, and ETFs with high Outlook scores generally perform well over time in various market conditions.
Of course, each ETF has a unique set of constituent stocks, so the sectors represented will score differently depending upon which set of ETFs is used. For Sector Detector, I use ten iShares ETFs representing the major U.S. business sectors.
About Trading Strategies: There are various ways to trade these rankings. First, you might run a sector rotation strategy in which you buy long the top 2-4 ETFs from SectorCast-ETF, rebalancing either on a fixed schedule (e.g., monthly or quarterly) or when the rankings change significantly. Another alternative is to enhance a position in the SPDR Trust exchange-traded fund (SPY) depending upon your market bias. If you are bullish on the broad market, you can go long the SPY and enhance it with additional long positions in the top-ranked sector ETFs. Conversely, if you are bearish and short (or buy puts on) the SPY, you could also consider shorting the two lowest-ranked sector ETFs to enhance your short bias.
However, if you prefer not to bet on market direction, you could try a market-neutral, long/short trade—that is, go long (or buy call options on) the top-ranked ETFs and short (or buy put options on) the lowest-ranked ETFs. And here’s a more aggressive strategy to consider: You might trade some of the highest and lowest ranked stocks from within those top and bottom-ranked ETFs.