Sector Detector: Random observations, as consolidation in stocks continues
 The stock market’s technical consolidation continues, and in fact anyone who missed last week’s entry point for the widely-anticipated year-end rally is getting another shot at it. The S&P 500 and Dow Jones Industrials both lost round-number support again this week at 1800 and 16,000, after briefly recovering them from last week’s pullback. However, the NASDAQ is still holding its breakout above 4000 and the Russell 2000 above 1100. Here are some random observations on what is driving market gyrations during this consolidation period.
A bipartisan Congressional committee came to an agreement on the budget, but with House support far from certain. Both the far left and far right are unhappy (the very definition of compromise, by the way), “But we understand in this divided government we’re not going to get everything we want,” said Paul Ryan, who served on the committee. "It makes sure that we don't lurch from crisis to crisis."
Facebook (FB) was added to both the S&P 500 and S&P 100 indexes. MasterCard (MA) declared a 10-1 stock split, which is appropriate for a $760 stock but unusual in an era in which hardly anybody splits anymore. MA was up +3.5% on a bad market day.
The Bureau of Labor Statistics’ JOLTS (Job Openings and Labor Turnover Survey) this week showed a big increase in job openings and record low layoffs. Hiring and quitting are both up. This essentially supports last Friday’s lower unemployment rate of 7.0% and higher labor participation rate of 63%. On the other hand, the Redbook weekly retail sales report fell from +4.9% to +2.6% in year-over-year growth. The FOMC’s next policy meeting is next week, and it’s encouraging to see that the market hasn’t sold off upon any whiff of positive jobs news. Tapering is always on the table for discussion, but I still think it’s quite a ways off.
Given this year’s big outperformance in US stocks versus other regions and asset classes, we should not overlook for 2014 the possibility of mean reversion and/or the positive impact of accelerating global recovery on those other areas, like commodities, emerging markets, Europe and Japan. Within the US markets, however, sector correlations remain high (a rising or falling tide….).
Some market technicians, like BA/ML Head of Global Technical Strategy MacNeil Curry, think US stocks could see as much as a 20% correction next year. But I’m not at all convinced -- at least not in the first half of the year. In fact, I think that some of the massive sideline cash will start finding its way into equities as the New Year begins and a budget deal is consummated, oil prices remain low, global uncertainties continue to subside, and the Fed demonstrates its ongoing support for the economy and risk assets.
By the way, Sabrient’s renowned “Baker’s Dozen” annual portfolio of high-potential GARP stocks continues to perform extremely well, more than doubling the S&P 500 return. Our next Baker’s Dozen annual portfolio for 2014 will launch on January 13. The 2013 portfolio has experienced no offsetting meltdowns, largely because of prescreening with our proprietary Earnings Quality Rank (EQR), which is a pure accounting-based risk assessment signal based on the forensic accounting expertise of subsidiary Gradient Analytics.
The SPY chart: The SPDR S&P 500 Trust (SPY) closed Wednesday at 178.72, which is just a dollar lower than it closed last Wednesday, and very close to prior support around 178. I still expect that failure of the bearish rising wedge at the top of the rising channel gives a support target down around the 50-day simple moving average near 176 or prior support at 175. Oscillators like RSI, MACD and Slow Stochastic all have further to go before they are oversold and ready to bounce into a year-end rally.
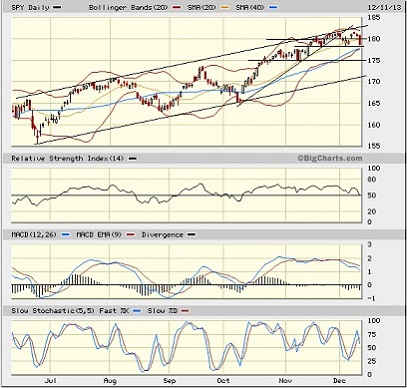
The CBOE Market Volatility Index (VIX), a.k.a. “fear gauge,” closed Wednesday at 15.42, which is its highest close since mid-October. However, it is just barely above the 15 threshold and well below the important 20 level. There is still very little fear being reflected in this overdue market pullback/consolidation.
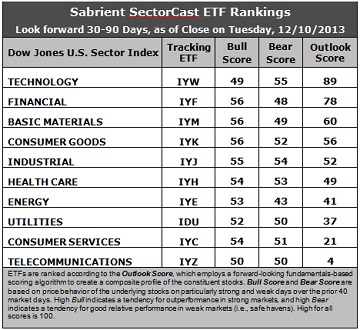
Latest rankings: The table ranks each of the ten U.S. business sector iShares ETFs by Sabrient's proprietary Outlook Score, which employs a forward-looking, fundamentals-based, quantitative algorithm to create a bottom-up composite profile of the constituent stocks within the ETF. The multi-factor model considers forward valuation, historical earnings trends, earnings growth prospects, the dynamics of Wall Street analysts' consensus estimates, accounting practices and earnings quality, and various return ratios. In addition, the table also shows Sabrient's proprietary Bull Score and Bear Score for each ETF.
High Bull score indicates that stocks within the ETF have tended recently toward relative outperformance during particularly strong market periods, while a high Bear score indicates that stocks within the ETF have tended to hold up relatively well during particularly weak market periods. Bull and Bear are backward-looking indicators of recent sentiment trend.
As a group, these three scores can be quite helpful for positioning a portfolio for a given set of anticipated market conditions.
Observations:
1. Not much movement in the rankings this week. Technology (IYW) retains the top spot with an Outlook score of 89. IYW still displays one of the lowest forward P/Es, a solid long-term forward growth rate, and the best return ratios, and the strongest sentiment among Wall Street analysts, in the way of upgrades to earnings estimates. Financial (IYF) takes second place with a 78. It displays one of the lowest forward P/Es and excellent sentiment among both Wall Street analysts and company insiders. IYW and IYF sit well above the rest of the field, with an 18-point gap above third place Basic Materials (IYM), which now enjoys the strongest improvement in sell-side sentiment. It was not very long ago that IYM had the worst analyst sentiment in the way of net downgrades to earnings estimates. Things seem to have changed.
2. Telecom (IYZ) is in the cellar yet again with an Outlook score of 4. IYZ scores the absolute lowest on every factor in the model, including the highest forward P/E, lowest return ratios, a low projected long-term growth rate, and poor sentiment among insiders and Wall Street analysts. Consumer Services (IYC) remains in the bottom two with an Outlook score of 21. Although it enjoys the best projected long-term growth rate, IYC’s forward P/E is still too high relative to the other sectors.
3. In the middle of the Outlook rankings, Consumer Goods (IYK), Industrial (IYJ), and Healthcare (IYH) continue to jostle about with little change in scores. Energy (IYE), however, dropped by 9 points as Wall Street has reduced estimates, perhaps in view of falling oil prices, and it is particularly notable that the Bear score for IYE dropped 9 points this week, as well, as Energy stocks are apparently being unloaded during this stretch of market weakness.
4. This week’s fundamentals-based rankings seem to have maintained their bullish bias, with economically-sensitive sectors Tech, Financial, Materials, and Industrial all in the top five and scoring above 50.
5. Looking at the Bull scores, Financial (IYF), Materials (IYM), and Consumer Goods (IYK) have been the leaders on particularly strong market days, scoring 56. It is notable that 9 of the 10 sectors are scoring above 50. At the bottom is Technology (IYW) with a score of 49. The top-bottom spread is only 7 points, which continues to indicate high sector correlations (all-boats-lifted buying) on particularly strong market days.
6. Looking at the Bear scores, Technology (IYW) is the highest at 55, and is serving as the favorite “safe haven” on weak market days, followed by Industrial (IYJ) at 54. Energy (IYE) has the lowest score of 43. The top-bottom spread widened dramatically this week to 12 points, which indicates lower sector correlations on particularly weak market days. It appears that investors are holding on to their Tech and Industrial stocks while unloading their Energy stocks during market weakness.
7. Overall, IYW shows the best all-weather combination of Outlook/Bull/Bear scores. Adding up the three scores gives a total of 193. IYZ is the by far the worst at 104. Looking at just the Bull/Bear combination, IYJ displays the highest score of 109 this week, followed closely by IYK at 108. Their scores indicate good relative performance in extreme market conditions (whether bullish or bearish), while IYE is the lowest at 96, which indicates investor avoidance (relatively speaking) during extreme conditions.
These Outlook scores represent the view once again that Technology and Financial sectors are still relatively undervalued, while Telecom and Consumer Services may be relatively overvalued based on our 1-3 month forward look.
Some highly-ranked stocks that are components of IYW and IYF include Solera Holdings (SLH), Google (GOOG), Affiliated Managers Group (AMG), and Ameriprise Financial (AMP).
Disclosure: Author has no positions in stocks or ETFs mentioned.
About SectorCast: Rankings are based on Sabrient’s SectorCast model, which builds a composite profile of each equity ETF based on bottom-up aggregate scoring of the constituent stocks. The Outlook Score employs a fundamentals-based multi-factor approach considering forward valuation, earnings growth prospects, Wall Street analysts’ consensus revisions, accounting practices, and various return ratios. It has tested to be highly predictive for identifying the best (most undervalued) and worst (most overvalued) sectors, with a 1-3 month forward look.
Bull Score and Bear Score are based on the price behavior of the underlying stocks on particularly strong and weak days during the prior 40 market days. They reflect investor sentiment toward the stocks (on a relative basis) as either aggressive plays or safe havens. So, a high Bull score indicates that stocks within the ETF have tended recently toward relative outperformance during particularly strong market periods, while a high Bear score indicates that stocks within the ETF have tended to hold up relatively well during particularly weak market periods.
Thus, ETFs with high Bull scores generally perform better when the market is hot, ETFs with high Bear scores generally perform better when the market is weak, and ETFs with high Outlook scores generally perform well over time in various market conditions.
Of course, each ETF has a unique set of constituent stocks, so the sectors represented will score differently depending upon which set of ETFs is used. For Sector Detector, I use ten iShares ETFs representing the major U.S. business sectors.
About Trading Strategies: There are various ways to trade these rankings. First, you might run a sector rotation strategy in which you buy long the top 2-4 ETFs from SectorCast-ETF, rebalancing either on a fixed schedule (e.g., monthly or quarterly) or when the rankings change significantly. Another alternative is to enhance a position in the SPDR Trust exchange-traded fund (SPY) depending upon your market bias. If you are bullish on the broad market, you can go long the SPY and enhance it with additional long positions in the top-ranked sector ETFs. Conversely, if you are bearish and short (or buy puts on) the SPY, you could also consider shorting the two lowest-ranked sector ETFs to enhance your short bias.
However, if you prefer not to bet on market direction, you could try a market-neutral, long/short trade—that is, go long (or buy call options on) the top-ranked ETFs and short (or buy put options on) the lowest-ranked ETFs. And here’s a more aggressive strategy to consider: You might trade some of the highest and lowest ranked stocks from within those top and bottom-ranked ETFs.