Sector Detector: Bulls hold the line as market coils in anticipation of a bigger move
After posting record highs the previous week, stocks closed last week slightly down overall. But the major indexes held their psychological levels, including Dow at 18,000, S&P 500 at 2100, NASDAQ at 5,000, and Russell 2000 at 1200. Although the bulls continue to find reliable support levels nearby, strong overhead technical resistance and neutral-to-defensive rankings in our SectorCast fundamentals-based quant model continue to suggest that a major upside breakout is not quite imminent, although a selloff doesn’t seem to be in the cards, either. Overall, stocks appear to be coiling ever tighter while awaiting a catalyst. Earnings season hasn’t provided it, so it might not come until the June meeting of the FOMC.
In this weekly update, I give my view of the current market environment, offer a technical analysis of the S&P 500 chart, review our weekly fundamentals-based SectorCast rankings of the ten U.S. business sectors, and then offer up some actionable trading ideas, including a sector rotation strategy using ETFs and an enhanced version using top-ranked stocks from the top-ranked sectors.
Market overview:
Net-net, the various economic reports last week were taken positively. Q1 GDP report indeed came in quite weak at an annualized +0.2%, but it was evidently already priced in and fully expected, with expectations for grand improvement going forward. The ISM Manufacturing report on Friday came in at 51.5 (unchanged from prior month), and New Orders rose to 53.5. Positive economic reports from Japan and China helped the bulls’ cause, with inflation rising in Japan during March and China showing some growth in both manufacturing and services sectors. The University of Michigan Consumer Sentiment Index for April was 95.9 (versus 93 in March). And first-time applicants for unemployment fell to the lowest in 15 years.
Here are some other noteworthy observations. Last year, S&P 500 companies spent 95% of their operating margins on buybacks and dividends, and this year, stock buybacks and dividends will surpass a record $1 trillion. Also, ETFGI reports that total assets invested in the global ETF/ETP industry will surpass assets in the global hedge fund industry during the current calendar quarter (both are currently around $2.9 trillion).
Interestingly, Brian Wesbury, chief economist at First Trust Advisors, points out that the Fed’s quantitative easing programs since 2008 have inflated the monetary base by 25% per year but have had no discernible impact on the M2 money supply, which has grown only 6% per year, or about the same rate that it grew between 1995-2008. So, if the banks aren’t lending the money, then the excess liquidity has not served to generate new capital investment and profitability. Instead, he believes that the plow-horse economy and rising corporate profits have been driven solely by technical innovation, productivity gains, and the unshakable American entrepreneurial spirit.
But even if it hasn’t boosted the economy directly, it seems to me that QE has provided an indirect effect by helping stabilize markets and investor confidence by putting a bid under asset prices, including both equities and bonds. This has helped create a psychological wealth effect and keep long-term interest rates low (including mortgage rates), which has lifted the housing market and consumer confidence, which in turn has helped boost corporate profits.
The CBOE Market Volatility Index (VIX), a.k.a. fear gauge, closed Friday at 12.70 after falling nearly 13% on the day. It is again probing toward its 2015 lows and well below the 15 threshold between investor fear and complacency.
Sabrient’s Baker’s Dozen annual top picks portfolio continues to impress. On Friday, four stocks were each up around +5%, including Alcoa (AA), NXP Semiconductor NV (NXPI), Tesoro (TSO), and Gilead Sciences (GILD). Today (Monday), Cognizant Technology Solutions (CTSH) reported a blow-out quarter with huge revenue boost and improved guidance, and it was up as much as 10% intraday. Much of their improvement has been in their Healthcare vertical, and of course the Healthcare sector overall has been a market leader (and top ranked in our SectorCast model, as described below).
SPY chart review:
The SPDR S&P 500 Trust (SPY) closed Friday at 210.72 after a strong bounce on Friday. It has been creating a pattern of successive bull flag formations (continuation patterns), each time bouncing from reliable support at the long-standing uptrend line, which now is again converging with the 100-day simple moving average to provide even stronger support. The latest bounce came at the 50-day SMA. However, the February high around 212 is providing extremely tough resistance in the absence of a strong catalyst for a bullish breakout. Nevertheless, Bollinger Bands are pinching together and the uptrend line is rapidly converging toward the 212 level, apparently coiling for a strong move at some point. Oscillators RSI, MACD, and Slow Stochastic are all in neutral territory. Will investors choose to sell in May and go away? Although I see nothing especially bearish, I still don’t think there is sufficient fuel for a breakout at the moment. Support levels include the 50-day simple moving average (around 209), the uptrend line and 100-day SMA (around 208), and the critical 200-day SMA (approaching 203), followed by round-number support at the 200 price level.

Latest sector rankings:
Relative sector rankings are based on our proprietary SectorCast model, which builds a composite profile of each equity ETF based on bottom-up aggregate scoring of the constituent stocks. The Outlook Score employs a forward-looking, fundamentals-based multifactor algorithm considering forward valuation, historical and projected earnings growth, the dynamics of Wall Street analysts’ consensus earnings estimates and recent revisions (up or down), quality and sustainability of reported earnings (forensic accounting), and various return ratios. It helps us predict relative performance over the next 1-3 months.
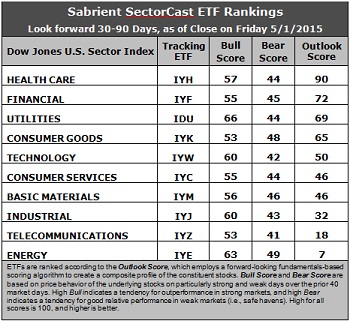
In addition, SectorCast computes a Bull Score and Bear Score for each ETF based on recent price behavior of the constituent stocks on particularly strong and weak market days. High Bull score indicates that stocks within the ETF recently have tended toward relative outperformance when the market is strong, while a high Bear score indicates that stocks within the ETF have tended to hold up relatively well (i.e., safe havens) when the market is weak.
Outlook score is forward-looking while Bull and Bear are backward-looking. As a group, these three scores can be helpful for positioning a portfolio for a given set of anticipated market conditions. Of course, each ETF holds a unique portfolio of stocks and position weights, so the sectors represented will score differently depending upon which set of ETFs is used. We use the iShares that represent the ten major U.S. business sectors: Financial (IYF), Technology (IYW), Industrial (IYJ), Healthcare (IYH), Consumer Goods (IYK), Consumer Services (IYC), Energy (IYE), Basic Materials (IYM), Telecommunications (IYZ), and Utilities (IDU). Whereas the Select Sector SPDRs only contain stocks from the S&P 500, I prefer the iShares for their larger universe and broader diversity. Fidelity also offers a group of sector ETFs with an even larger number of constituents in each.
Here are some of my observations on this week’s scores:
1. Healthcare remains in first place with a solid Outlook score of 90. Healthcare displays the best sell-side analyst sentiment (net positive revisions to earnings estimates) and decent scores in most factors in the model, including return ratios, forward long-term growth rate, and insider sentiment (buying activity), although forward P/E is a little pricey. Financial again takes second with a score of 72, primarily due to its low forward P/E. Utilities remains in third this week with a 69, displaying good analyst sentiment and a relatively low forward P/E.
2. Energy continues to hold the bottom spot with an Outlook score of 7, given the persistent weakness in oil prices and the downward earnings revisions from Wall Street (although it is leveling off). Energy ranks among the worst in all factors in the model, including a forward long-term growth rate near zero and by far the highest forward P/E. Telecom remains in the bottom two with a score of 25 despite new positive sell-side earnings revisions. Notably, Industrial is the third worst and displays the worst sell-side analyst sentiment (net negative revisions to earnings estimates).
3. Looking at the Bull scores, Utilities (somewhat surprisingly) displays the top score of 66, followed by Energy at 63 and then Technology and Industrial at 60. Consumer Goods (Staples/Noncyclical) and Telecom share the lowest Bull score of 53. Once again, all scores are above 50, but the top-bottom spread has expanded somewhat to 13 points, but still reflects elevated sector correlations (i.e., broad risk-on buying). It is generally desirable in a healthy market to see low correlations reflected in a top-bottom spread of at least 20 points, which indicates that investors have clear preferences in the stocks they want to hold.
4. Looking at the Bear scores, Energy displays the highest (i.e., best) score of 49, followed by Consumer Goods (Staples/Noncyclical), which means that stocks within these sectors have been the preferred safe havens (relatively speaking) on weak market days. Telecom ranks the lowest at 41, followed by Technology at 42. The top-bottom spread remains a narrow 8 points, which reflects high sector correlations on particularly weak market days (i.e., broad risk-off selling). Ideally, certain sectors will hold up relatively well while others are selling off, so it is generally desirable in a healthy market to see low correlations reflected in a top-bottom spread of at least 20 points.
5. Healthcare displays the best all-around combination of Outlook/Bull/Bear scores, while Telecom is the worst. Looking at just the Bull/Bear combination, Energy is the best, followed by Utilities, indicating superior relative performance (on average) in extreme market conditions (whether bullish or bearish), while Telecom scores by far the worst.
6. Overall, this week’s fundamentals-based Outlook rankings continue to look neutral to slightly defensive, with Utilities and Consumer Goods (Staples/Noncyclical) in the top four and falling scores for Technology and Industrial. Keep in mind, the Outlook Rank does not include timing or momentum factors, but rather is a reflection of the fundamental expectations of individual stocks aggregated by sector.
Stock and ETF Ideas:
Our Sector Rotation model, which appropriately weights Outlook, Bull, and Bear scores in accordance with the overall market’s prevailing trend (bullish, neutral, or defensive), retains its bullish bias and suggests holding Utilities, Healthcare, and Technology, in that order. (Note: In this model, we consider the bias to be bullish from a rules-based trend-following standpoint when SPY is above both its 50-day and 200-day simple moving averages.)
Utilities might seem like an unlikely choice for a bullish bias, but the combination of a solid Outlook Rank and a surprisingly high Bull Score make it the top choice from a rules-based perspective – at least for the moment.
Other highly-ranked ETFs in SectorCast from the Utilities, Healthcare, and Technology sectors include Utilities Select Sector SPDR Fund (XLU), iShares Global Healthcare ETF (IXJ), and PowerShares Dynamic Networking Portfolio (PXQ).
For an enhanced sector portfolio that enlists some top-ranked stocks (instead of ETFs) from within the top-ranked sectors, some long ideas from Utilities, Healthcare, and Technology sectors include NRG Energy (NRG), Level 3 Communications (LVLT), Regeneron Pharmaceuticals (REGN), Henry Schein (HSIC), LogMeIn (LOGM), and NetScout Systems (NTCT). All are highly ranked in the Sabrient Ratings Algorithm.
If you prefer to maintain a neutral bias, the Sector Rotation model still suggests holding Healthcare, Financial, and Utilities, in that order. But if you prefer a defensive stance on the market, the model suggests holding Consumer Goods (Staples/Noncyclical), Healthcare, and Financial, in that order.
IMPORTANT NOTE: I post this information each week as a free look inside some of our institutional research and as a source of some trading ideas for your own further investigation. It is not intended to be traded directly as a rules-based strategy in a real money portfolio. I am simply showing what a sector rotation model might suggest if a given portfolio was due for a rebalance, and I may or may not update the information each week. There are many ways for a client to trade such a strategy, including monthly or quarterly rebalancing, perhaps with interim adjustments to the bullish/neutral/defensive bias when warranted -- but not necessarily on the days that I happen to post this weekly article. The enhanced strategy seeks higher returns by employing individual stocks (or stock options) that are also highly ranked, but this introduces greater risks and volatility. I do not track performance of the ETF and stock ideas mentioned here as a managed portfolio.
Disclosure: Author has no positions in stocks or ETFs mentioned.
Disclaimer: This newsletter is published solely for informational purposes and is not to be construed as advice or a recommendation to specific individuals. Individuals should take into account their personal financial circumstances in acting on any rankings or stock selections provided by Sabrient. Sabrient makes no representations that the techniques used in its rankings or selections will result in or guarantee profits in trading. Trading involves risk, including possible loss of principal and other losses, and past performance is no indication of future results.