Sector Detector: Sharp selloff in stocks sets up long-awaiting buying opportunity
 Last week brought even more stock market weakness and volatility as the selloff became self-perpetuating, with nobody mid-day on Wednesday wanting to be the last guy left holding equities. Hedge funds and other weak holders exacerbated the situation. But the extreme volatility and panic selling finally led some bulls (along with many corporate insiders) to summon a little backbone and buy into weakness, and the market finished the week on a high note, with continued momentum likely into the first part of this week.
Despite concerns about global economic growth and a persistent lack of inflation, especially given all the global quantitative easing, fundamentals for U.S. stocks still look good, and I believe this overdue correction ultimately will shape up to be a great buying opportunity -- i.e., there is no need for investors to be afraid of the very thing they have been hoping for. Also, the charts are looking exhausted to the downside, and our fundamentals-based rankings remain slightly bullish.
In this weekly update, I give my view of the current market environment, offer a technical analysis of the S&P 500 chart, review our weekly fundamentals-based SectorCast rankings of the ten U.S. business sectors, and then offer up some actionable trading ideas, including a sector rotation strategy using ETFs and an enhanced version using top-ranked stocks from the top-ranked sectors.
Market overview:
Three weeks ago, the market finished the first week of October oversold, and the following week it became extremely oversold, and then last week it reached severely oversold. Obviously, no matter how overbought or oversold the market gets, it can always get more so. However, investing is about stacking the odds in your favor, and the more severe technical conditions become, the greater the odds of a bounce or outright reversal.
As of Friday, the S&P 500 closed down -6% from its closing peak on September 18 (but on an intraday basis, the peak-to-trough pullback was -9.8%). The MSCI World Index is down -10% from its September 2 high.
The top performing sectors last week were Telecom, Industrial, and Basic Materials, but these three had fallen the most the prior week. For the month of October, Utilities is up about +2%, which is far more than everyone else. Consumer Goods/Staples is down less than -2%, and the others are worse (Energy is down almost -9% MTD.) So far in 2014, Utilities is again the strongest sector after last week’s market weakness (up about +12% YTD), followed by Healthcare (+10%) and Technology (+7%). Then there’s a big gap down to the rest of the pack.
Because it has been so long since the broad market has pulled back in a meaningful way, investors have almost forgotten what it is like. I see it as a welcome cleansing that is wringing out some excesses and speculative fervor that had begun to creep in, not to mention an extremely overbought technical picture. The biggest concern driving the correction is the rising likelihood of a global economic slowdown and the potential for deflation in the Eurozone.
The CBOE Market Volatility Index (VIX), a.k.a. fear gauge, closed Friday at 21.99, after spiking during the week above 30 for the first time since November of 2011. Now that’s the old volatility we used to see from time to time. It has been hovering in the teens for much of the past couple of years and hit a low of 10.32 back on July 3. At the height of the financial crisis in 2008, VIX spiked above 80, and 20 range is its five-year average.
The 10-year U.S. Treasury bond yield closed Friday around 2.2%, which is down again from the prior week’s close of 2.3%. However, the yield actually dipped below 2.0% a few times last week (to as low as 1.86%) while the 30-year yield dipped below 3.0%, as investors sought refuge during the depths of despair. For comparison, German bund 10-year yields closed Friday 0.86% after trading as low as 0.72%.
As I said in last week’s article, the U.S. economic recovery has legs and is not heading into recession. It only requires a gut check and some renewed investor confidence to rejuvenate the bullish conviction that has suddenly disappeared. Although falling commodity prices does not bode well for the demand expected of a growing global economy, the combination of lower oil prices and lower interest rates will help support corporate earnings. Bellwethers reporting this week include Apple (AAPL), Yahoo! (YHOO), McDonald’s (MCD), Boeing (BA), Amazon.com (AMZN), and Coca Cola (KO).
With the reduced market valuation from the October correction, the forward P/E multiple for the market based on sell-side analysts' earnings expectations is now about 15.5x. And given the concurrent rally in bonds, stocks are now even more attractively valued relative to bonds than they were before. Moreover, seasonal factors indicate a significant year-end rally is still likely, and the buying often starts right around the first game of the major league baseball World Series, which is on Tuesday. Also, from a contrarian standpoint, the put/call ratio on individual equities hit its highest level since February.
Again, I have to emphasize that the new market psychology -- created by this sudden but long overdue correction, along with growing worries about global growth and persistently low inflation (despite massive injections of liquidity) -- should set the stage for lower equity correlations, selective stock picking, and capital flight to the highest quality companies, i.e., those with strong market position, solid cash flow, and low debt levels. The speculative stocks are more dangerous than ever -- as illustrated by the drubbing taken by Netflix (NFLX) last Thursday.
SPY chart review:
The SPDR S&P 500 Trust (SPY) closed Friday at 188.47, which is down only -1% from the prior Friday, despite the extreme volatility. Purely from a technical (chart) standpoint, last week was a disaster. Major support levels were broken left and right. Small caps have encountered a death cross (50-day simple moving average cutting down through the 200-day), and the S&P 500 large caps crashed down through support from the 200-day SMA. However, the S&P 500 bounced nicely on Friday to keep the week’s losses relatively small, after small caps had showed strength on Wednesday and Thursday, and the Dow Industrials were able to hold the 16,000 level. I mentioned last week that the next support level is all the way down at 185, which is a previous level of resistance-turned-support (and the year-to-date breakeven level), and it indeed came into play. Now, oscillators RSI, MACD, and Slow Stochastic are all pointing up bullishly from deeply oversold territory. Overhead resistance will be tested first at 190 and then at the 200-day SMA, followed by the trend line (lower line of bullish rising channel).
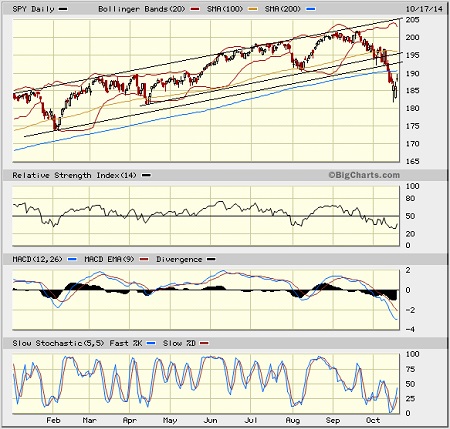
It’s hard to say if the result will be nothing more than a dead-cat bounce before heading lower. It looks like a good place for a reversal, but many pure chartists are saying that the charts have all failed and it is time to go to cash. Many are comparing the current setup to 2007. But keep in mind, pure technicals aside, the fundamental picture is quite different now than it was in 2007. Fear can erode investor psychology (especially given how long it has been since the market has endured a meaningful correction), leading to a weak technical picture. But once they all get their wits about them, the fundamentals are still favorable.
Latest sector rankings:
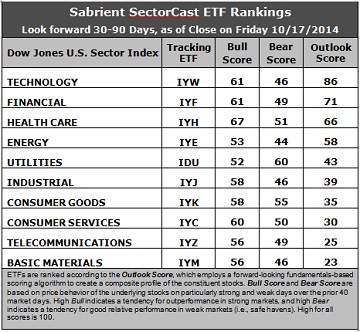
Relative sector rankings are based on our proprietary SectorCast model, which builds a composite profile of each equity ETF based on bottom-up aggregate scoring of the constituent stocks. The Outlook Score employs a forward-looking, fundamentals-based multifactor algorithm considering forward valuation, historical and projected earnings growth, the dynamics of Wall Street analysts’ consensus earnings estimates and recent revisions (up or down), quality and sustainability of reported earnings (forensic accounting), and various return ratios. It helps us predict relative performance over the next 1-3 months.
In addition, SectorCast computes a Bull Score and Bear Score for each ETF based on recent price behavior of the constituent stocks on particularly strong and weak market days. High Bull score indicates that stocks within the ETF recently have tended toward relative outperformance when the market is strong, while a high Bear score indicates that stocks within the ETF have tended to hold up relatively well (i.e., safe havens) when the market is weak.
Outlook score is forward-looking while Bull and Bear are backward-looking. As a group, these three scores can be helpful for positioning a portfolio for a given set of anticipated market conditions. Of course, each ETF holds a unique portfolio of stocks and position weights, so the sectors represented will score differently depending upon which set of ETFs is used. We use the iShares that represent the ten major U.S. business sectors: Financial (IYF), Technology (IYW), Industrial (IYJ), Healthcare (IYH), Consumer Goods (IYK), Consumer Services (IYC), Energy (IYE), Basic Materials (IYM), Telecommunications (IYZ), and Utilities (IDU). Whereas the Select Sector SPDRs only contain stocks from the S&P 500, I prefer the iShares for their larger universe and broader diversity. Fidelity also offers a group of sector ETFs with an even larger number of constituents in each.
Here are some of my observations on this week’s scores:
1. First, all sectors except Utilities took a hit this week from the sell-side analyst community in the way of net downward revisions to earnings estimates. Nevertheless, Technology still holds the top spot with an Outlook score of 86. The sector displays relatively solid scores across most factors in the model, including the strongest return ratios, a good forward long-term growth rate, and a low forward P/E. Financial is in the second spot this week with a score of 71. It displays the lowest forward P/E. In third is Healthcare, followed by Energy and Utilities. Notably, Energy made a big 25-point leap in its Outlook score this week as the analyst community slowed down on their parade of earnings downgrades and the low forward P/E looks even more attractive (as the sector has been crushed).
2. Basic Materials makes an appearance in the cellar this week with an Outlook score of 23, after being hammered with new downward earnings revisions from Wall Street. Telecom once again is in the bottom two, as well, and continues to score among the bottom for most factors in the model. Notably, Consumer Services/Discretionary has made a solid move out of the bottom two, largely because of its impressive forward long-term growth rate.
3. Looking at the Bull scores, Healthcare again displays the highest score of 67, while Utilities is the lowest at 52. The top-bottom spread is now 15 points, reflecting elevated sector correlations on particularly strong market days recently. It is generally desirable in a healthy market to see low correlations and a top-bottom spread of at least 20 points, which indicates that investors have clear preferences in the stocks they want to hold, rather than the all-boats-lifted-in-a-rising-tide (risk-on) mentality that dominated 2013. Also displaying strong Bull scores above 60 are Technology, Financial, and Consumer Services/Discretionary, which are all economically-sensitive sectors that should indeed have the highest Bull scores in a healthy market.
4. Looking at the Bear scores, Utilities displays the highest score of 60 this week, as one would expect for this traditionally defensive sector. However, no sectors were spared during the sharp selloff last week. Utilities stocks have been the preferred safe havens on weak market days. Energy displays the lowest score of 44. The top-bottom spread is now 16 points, reflecting elevated sector correlations on particularly weak market days -- not surprising given the risk-off behavior last week. Again, it is generally desirable in a healthy market to see low correlations and a top-bottom spread of at least 20 points. Also displaying strong Bear score is Consumer Goods/Staples, which along with Utilities are traditionally defensive (or all-weather) sectors that should have the highest Bear scores in a healthy market.
5. Technology still displays the best all-around combination of Outlook/Bull/Bear scores, while Basic Materials is the worst. Looking at just the Bull/Bear combination, Healthcare is the leader, followed by Consumer Goods/Staples and Utilities, indicating superior relative performance (on average) in extreme market conditions (whether bullish or bearish), while Energy is still the worst, indicating general investor avoidance during extreme conditions.
6. Overall, this week’s fundamentals-based Outlook rankings still appear slightly bullish to me. The top four sectors are all economically-sensitive (or in the case of Healthcare, all-weather), and the top three display the highest Bull scores. Keep in mind, the Outlook Rank does not include timing or momentum factors, but rather is a reflection of the fundamental expectations of individual stocks aggregated by sector.
Stock and ETF Ideas:
Our Sector Rotation model, which appropriately weights Outlook, Bull, and Bear scores in accordance with the overall market’s prevailing trend (bullish, neutral, or bearish), moved to a bearish bias this week, and it suggests holding Utilities, Healthcare, and Consumer Goods/Staples (in that order, for those portfolios due to rebalance on Monday). (Note: In this model, we consider the bias to be bearish from a rules-based trend-following standpoint because SPY is below both its 50-day and 200-day simple moving averages.)
Other highly-ranked ETFs from the Utilities, Healthcare, and Consumer Goods/Staples sectors that also sport reasonably strong Bear scores include Guggenheim Invest S&P 500 Equal Weight Utilities ETF (RYU), SPDR S&P Health Care Services ETF (XHS), PowerShares Dynamic Food & Beverage ETF (PBJ).
For an enhanced sector portfolio that enlists some top-ranked stocks (instead of ETFs) from within the top-ranked sectors, some long ideas from Utilities, Healthcare, and Consumer Goods/Staples sectors include American Water Works (AWK), Vectren Corp (VVC), Cardinal Health (CAH), Team Health Holdings (TMH), Dr. Pepper Snapple Group (DPS), Keurig Green Mountain (GMCR). All are highly ranked in the Sabrient Ratings Algorithm and also score within the top two quintiles (lowest accounting-related risk) of our Earnings Quality Rank (a.k.a., EQR), a pure accounting-based risk assessment signal based on the forensic accounting expertise of our subsidiary Gradient Analytics (except for the Utilities stocks, which are not ranked in EQR). We have found EQR quite valuable for helping to avoid performance-offsetting meltdowns in our model portfolios.
However, if you think the market has begun a bullish reversal and you prefer to maintain a bullish bias, the Sector Rotation model suggests holding Healthcare, Technology, and Financial (in that order). And if you prefer a neutral stance on the market, the model suggests holding Technology, Financial, and Healthcare (in that order).
IMPORTANT NOTE: Some readers have been asking for more specifics on how to trade our sector rotation strategy based solely on what I discuss in my weekly newsletter. Thus, I feel compelled to remind you that I post this information each week as a free look inside some of our institutional research and as a source of some trading ideas for your own further investigation. It is not intended to be traded directly as a rules-based strategy in a real money portfolio. I am simply showing what a sector rotation model might suggest if a given portfolio was due for a rebalance, and I may or may not update the information each week. There are many ways for a client to trade such a strategy, including monthly or quarterly rebalancing, perhaps with interim adjustments to the bullish/neutral/bearish bias when warranted -- but not necessarily on the days that I happen to post this weekly article. The enhanced strategy seeks higher returns by employing stocks (or stock options) that are also highly ranked, but this introduces greater risks and volatility. I do not track performance of the ETF and stock ideas mentioned here as a managed portfolio.
Disclosure: Author has no positions in stocks or ETFs mentioned.
Disclaimer: This newsletter is published solely for informational purposes and is not to be construed as advice or a recommendation to specific individuals. Individuals should take into account their personal financial circumstances in acting on any rankings or stock selections provided by Sabrient. Sabrient makes no representations that the techniques used in its rankings or selections will result in or guarantee profits in trading. Trading involves risk, including possible loss of principal and other losses, and past performance is no indication of future results.