Sector Detector: Still bullish despite worrisome indicators
 Bond yields have crept back up to near multi-year highs as the bond market appears to be anticipating some measure of tapering in the Fed’s monthly bond-buying program. This undoubtedly has caused some hesitancy among stock investors, too. And then there are the looming debt ceiling and budget battles, as well as concern about slowing corporate earnings growth. And let’s not forget the comparisons to 1987 we are hearing, with Marc Faber (a.k.a., “Dr. Doom”) front-and-center telling investors to prepare for a 20% correction before year end.
These are just some of the many worries that have caught the attention of nervous bulls and hungry bears. Nevertheless, I remain confident that investor sentiment will bolster the bulls, especially given the diminished global risks. And I’m not alone (which actually might be considered somewhat worrisome on a contrarian basis).
The CBOE Market Volatility Index (VIX), a.k.a. “fear gauge,” closed Wednesday at 13.04 and remains down around historical lows. It’s been hanging around these extreme lows since mid-July and might be due for a mean reversion (and a pullback in equities). Also, the CBOE put/call ratio has been below 0.80 for the past few days, which is a low level in its historical range that often results in mean reversion (and a pullback in equities). It lingered below 0.80 for a few days back in mid-May, right before the summer pullback.
And given the strong inflows of capital into mutual funds and ETFs recently by retail investors (who are notoriously late to the game), contrarians are expecting a pullback to shake out the weaker holders.
Another question is whether a mean reversion value play in emerging markets, which have lagged badly, as well as the impressive performance over the past six weeks among the PIIGS countries, might attract global investors away from US stocks. Take a look at The New Ireland Fund (IRE) or the iShares MSCI Ireland Capped ETF (EIRL) for an indication of recovery in Ireland and the success of its austerity program.
Some technicians are concerned about the charts. The SPDR S&P 500 Trust (SPY) closed Wednesday at 168.74, which is just slightly lower than where it was last Wednesday. It has been struggling at the 170 mark (which corresponds to 1700 on the S&P 500). I also have drawn on the chart an uptrend line since the April lows that has been supporting recent price action of higher lows and appeared to be serving as the lower line of a bullish ascending triangle, with 170 as the top of the triangle. The break of the triangle was lower, but price seems reluctant to fall very much. Perhaps it was just filling the small gap from August 1. Next line of support is around 167.5, although there is another gap below that level down to 165 (from July 11) that may act as a magnet.
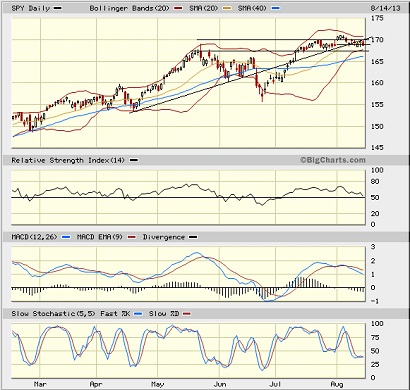
Oscillators RSI and MACD look short-term bearish, while Slow Stochastic looks neutral. Furthermore, some technicians are troubled that RSI and MACD did not confirm the new high in price. Price is trying to hug the bottom of the uptrend line and the 20-day simple moving average, but if it fails, 167.5 is the next support level followed by the 50-day moving average.
Overall, I don’t think the SPY chart looks too bad. However, as I pointed out last week, we really haven’t seen much of a correction since last November, so I wouldn’t be surprised to see something somewhat scary occur, perhaps tied to some news event like a tapering in the Fed’s quant easing. The chart might be forming the right shoulder of a head-and-shoulders top, but if so, it is a shallow formation and wouldn’t suggest much greater of a pullback than I’ve already described. With so many investors still looking for an entry point to participate in the bull trend, it’s unlikely that anything too dramatic will occur.
In fact, I was reading today on Yahoo! Finance that Erin Gibbs, equity chief investment officer for S&P's Investment Advisory Services, and Savita Subramanian, head of US equity strategy at Bank of America Merrill Lynch (BAC), both see the market going a good bit higher. Although Gibbs calls the economic recovery so far "subpar” due to lackluster GDP and wage growth, she still expects the S&P 500 to hit 1740-1770 this year, even if the Fed begins tapering. She thinks earnings growth will accelerate to 8% and assumes a target P/E of 15. Furthermore, BAC’s Subramanian foresees accelerating earnings growth, positive surprises in the US economy, diminished tail risks, and falling earnings volatility as bullish drivers.
Also, Joe Terranova of Virtus Investment Partners said on CNBC’s “Fast Money” show that he foresees the Technology sector finally taking the lead again largely due to a “product refresh cycle,” which lines up with Sabrient’s SectorCast ETF rankings. He particularly noted the expectation of Apple (AAPL) unveiling new products in mid-September. Notably, Carl Icahn came out this week on the Apple bandwagon, which helped boost the stock back over $500 for the first time since January.
In addition, I read in the ConvergEx Morning Briefing newsletter the other day a discussion of equity correlations. They observed that asset class and industry correlations have taken a dramatic fall, which is a welcome development for stock pickers trying to outperform the averages. Average sector correlations to the S&P 500 have dropped to 70%, which is the lowest they have been in over two years. Perhaps this is also due to the prospect of Fed tapering, which would help dissuade the general “risk-on/risk-off” trading pattern and make stocks rise on their own merits.
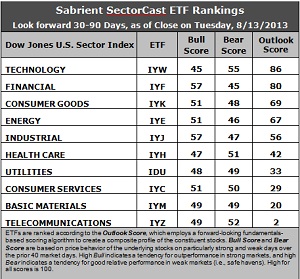
Latest rankings: The table ranks each of the ten U.S. business sector iShares ETFs by Sabrient's proprietary Outlook Score, which employs a forward-looking, fundamentals-based, quantitative algorithm to create a bottom-up composite profile of the constituent stocks within the ETF. The multi-factor model considers forward valuation, historical earnings trends, earnings growth prospects, the dynamics of Wall Street analysts' consensus estimates, accounting practices and earnings quality, and various return ratios. In addition, the table also shows Sabrient's proprietary Bull Score and Bear Score for each ETF.
High Bull score indicates that stocks within the ETF have tended recently toward relative outperformance during particularly strong market periods, while a high Bear score indicates that stocks within the ETF have tended to hold up relatively well during particularly weak market periods. Bull and Bear are backward-looking indicators of recent sentiment trend.
As a group, these three scores can be quite helpful for positioning a portfolio for a given set of anticipated market conditions.
Observations:
1. Technology (IYW) remains in the top spot with an Outlook score of 86. IYW displays a low forward P/E, a solid long-term projected growth rate, and the best return ratios. Financial (IYF) takes the second spot once again with a score of 80 as it enjoys a low forward P/E, strong insider sentiment, and by far the most earnings upgrades from Wall Street analysts. Consumer Goods (IYK) remains in third place with an Outlook score of 69. Industrial (IYJ) and Energy (IYE) round out the top five, although the two of them switched places this week.
2. Telecom (IYZ) stays in the cellar yet again with a low Outlook score of 2. IYZ is weak in all factors across the board, including a high forward P/E, low return ratios, poor insider sentiment, modest long-term projected growth, and extremely negative Wall Street sentiment in the form of earnings downgrades. Also in the bottom two again this week is Basic Materials (IYM) with a score of 20, as stocks within the sector continue to be hated by the sell side.
3. This week’s fundamentals-based rankings maintain their bullish bias, with Technology, Financial, Industrial, and Energy in the top five, and each of the top five has an Outlook score well above 50. I’m still disappointed in the poor showing of cyclical sector Consumer Services (IYC), which scores a 29. It actually boasts the highest long-term growth rate, but it scores below average on the rest of the model’s factors.
4. Looking at the Bull scores, IYF and IYJ have been the leaders on particularly strong market days, scoring 57, while Technology (IYW) scores the lowest at 45. The top-bottom spread is 12 points, indicating somewhat lower equity correlations on particularly bullish market days than we have been seeing recently.
5. Looking at the Bear scores, IYW remains the surprising favorite “safe haven” on weak market days, scoring 55, while long-time favorite Utilities (IDU) has fallen below 50 -- which indicates bullish investor sentiment and a lack of fear. IYF displays the worst performance during extreme market weakness as reflected in the low Bear score of 45. The top-bottom spread is a narrow 10 points, indicating relatively high sector correlations on particularly weak market days.
6. Overall, Technology (IYW) shows the best all-weather combination of Outlook/Bull/Bear scores. Adding up the three scores gives a total of 186. Telecom (IYM) is the by far the worst at 103. Looking at just the Bull/Bear combination, Industrial (IYJ) displays the highest score of 104, which indicates good relative performance in extreme market conditions (whether bullish or bearish), while Utilities (IDU) and Energy (IYE) score the lowest at 97, which indicates investor avoidance during extreme conditions.
These Outlook scores represent the view that Technology and Financial sectors are still relatively undervalued, while Telecom and Basic Materials sectors may be relatively overvalued based on our 1-3 month forward look.
Some top-ranked stocks within IYW and IYF that look good to me this week include CACI International (CACI), Western Digital (WDC), Visa (V), and SVB Financial Group (SIVB).
Besides faring well in Sabrient’s quantitative ratings algorithms, each of these companies also displays a solid score in our new Earnings Quality Rank (EQR), which is a pure accounting-based risk assessment signal that has proven valuable for both fundamental screening and as an orthogonal alpha factor for quant models. The model was co-developed by Sabrient and subsidiary Gradient Analytics, a forensic accounting firm.
Also, Sabrient’s annual Baker’s Dozen portfolio of top stocks for 2013 continues to perform. It is up +28% from the portfolio’s inception on January 11, nearly doubling the S&P 500 (+14.5%) over the same timeframe. In fact, all 13 stocks are comfortably positive, and 12 are up by double digits, which we largely attribute to the presence of EQR as a key scoring factor in the underlying multifactor model to help avoid meltdowns that can ruin overall portfolio performance.
Disclosure: Author has no positions in stocks or ETFs mentioned.
About SectorCast: Rankings are based on Sabrient’s SectorCast model, which builds a composite profile of each equity ETF based on bottom-up aggregate scoring of the constituent stocks. The Outlook Score employs a fundamentals-based multi-factor approach considering forward valuation, earnings growth prospects, Wall Street analysts’ consensus revisions, accounting practices, and various return ratios. It has tested to be highly predictive for identifying the best (most undervalued) and worst (most overvalued) sectors, with a 1-3 month forward look.
Bull Score and Bear Score are based on the price behavior of the underlying stocks on particularly strong and weak days during the prior 40 market days. They reflect investor sentiment toward the stocks (on a relative basis) as either aggressive plays or safe havens. So, a high Bull score indicates that stocks within the ETF have tended recently toward relative outperformance during particularly strong market periods, while a high Bear score indicates that stocks within the ETF have tended to hold up relatively well during particularly weak market periods.
Thus, ETFs with high Bull scores generally perform better when the market is hot, ETFs with high Bear scores generally perform better when the market is weak, and ETFs with high Outlook scores generally perform well over time in various market conditions.
Of course, each ETF has a unique set of constituent stocks, so the sectors represented will score differently depending upon which set of ETFs is used. For Sector Detector, I use ten iShares ETFs representing the major U.S. business sectors.
About Trading Strategies: There are various ways to trade these rankings. First, you might run a sector rotation strategy in which you buy long the top 2-4 ETFs from SectorCast-ETF, rebalancing either on a fixed schedule (e.g., monthly or quarterly) or when the rankings change significantly. Another alternative is to enhance a position in the SPDR Trust exchange-traded fund (SPY) depending upon your market bias. If you are bullish on the broad market, you can go long the SPY and enhance it with additional long positions in the top-ranked sector ETFs. Conversely, if you are bearish and short (or buy puts on) the SPY, you could also consider shorting the two lowest-ranked sector ETFs to enhance your short bias.
However, if you prefer not to bet on market direction, you could try a market-neutral, long/short trade—that is, go long (or buy call options on) the top-ranked ETFs and short (or buy put options on) the lowest-ranked ETFs. And here’s a more aggressive strategy to consider: You might trade some of the highest and lowest ranked stocks from within those top and bottom-ranked ETFs.