Sector Detector: Tech shows best valuations as budget negotiation continues
 I am not going to mention the nickname for the dominant issue of the day, since you are probably on the verge of screaming if you here it again (hint: initials are F.C.). But, unfortunately, we all remain hostage to the relentless political posturing of our elected officials during these critical budget negotiations. Not that we haven’t asked for it. The polarization of our Federal government has come about because we as a polarized society have elected those who espouse extreme views and promise to never knuckle under to the other side’s misguided, self-serving, or “evil” positions. And in fact, recent history shows that those who dare to compromise are quickly shown the door by voters at the next election.
So, with populism on the rise in the face of global economic difficulty, we now find ourselves in the midst of an immense wealth transfer from the rich and frugal (countries and individuals) to the poor and thriftless, from creditors to debtors.
Although many commentators are warning that this wealth transfer (and those still to come) is a road to economic destruction, most of the populace and their elected representatives have a greater fear of the immense near-term pain of the alternatives. Better to put it off to some future time, when perhaps the business cycle or some new technological invention arrives to save the day. Thus, as December 17 will be here in a flash, I think ultimately the House will knuckle under to Obama’s demand to boost taxes on higher marginal incomes for the top 2%, even though it is plain to any objective observer that the vast sea of small businesses in this category will take a hit just when the economy needs them to create new jobs. Inevitably, something better, i.e., more stimulative and less punitive, will be necessary for the longer term.
On the plane the other day, I was reading Time magazine’s “The Year in Review” issue, and David Von Drehle put it well when he said of Obama’s second term that he must “…sooner or later reach for the Grand Compromise that has eluded Washington for nearly 30 years: trading lower taxes on businesses and individuals for closing billions [of dollars] in loopholes and other tax-code giveaways that make virtually everyone in the U.S. — from corporations to small businesses to college students — welfare queens of one kind or another.”
Nevertheless, the news is good for stock investors. Ongoing monetary expansion from the worldwide central bank efforts will continue to support equities, and any kind of budget deal should light the fuse for further upside.
The charts aren’t very helpful these days as investors tread water awaiting news from the Federal government. The psychologically important levels of the Dow at 13,000, S&P 500 at 1,400, and Russell 2000 at 800 all continue to hold, although the Nasdaq has lost support at 3,000 primarily because of mega-cap Apple (AAPL), which seems to be suffering from challenges from other tablet makers.
The S&P 500 SPDR Trust (SPY) closed Wednesday at 141.50, which is almost exactly where it closed last Wednesday. I have drawn all kinds of lines showing various channels, triangles, and flags. However, the upshot is that price just seems to be treading water between support (from the 100-day simple moving average and the 140 level) and resistance (from the 50-day SMA and the 143 level. Overhead resistance looms at the convergence of prior support and the 50-day SMA near 143. RSI and MACD are looking more bearish this week, but they are really just cycling within the noise.
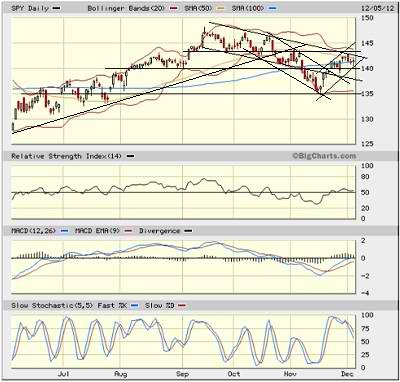
The chart reflects the same uncertainty that we see in Sabrient’s SectorCast rankings, and ultimately, the economic news is sufficiently positive that investors just need some good news about the budget to catalyze a year-end rally.
The CBOE Market Volatility Index (VIX), a.k.a. “fear gauge,” closed Wednesday at 16.46, which is still well below the important 20 level and low in its historical range, reflecting no apparent fear.
As a reminder, I’m in NYC this week, primarily for the big Bloomberg App Store event in which my colleagues and I will be demonstrating Sabrient’s new Equity Valuation and Ranking (EVR) application, an advanced stock and ETF screening, evaluation, and risk assessment tool. If you are in NYC, please come to the Bloomberg office to visit us. If you have access to a Bloomberg terminal, please take a free trial of EVR (APPS SABRIENT <GO>) and let us know what you think.
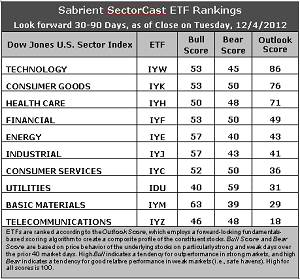
Latest rankings: The table ranks each of the ten U.S. industrial sector iShares (ETFs) by Sabrient’s proprietary Outlook Score, which employs a forward-looking, fundamentals-based, quantitative algorithm to create a bottom-up composite profile of the constituent stocks within the ETF. In addition, the table also shows Sabrient’s proprietary Bull Score and Bear Score for each ETF.
High Bull score indicates that stocks within the ETF have tended recently toward relative outperformance during particularly strong market periods, while a high Bear score indicates that stocks within the ETF have tended to hold up relatively well during particularly weak market periods. Bull and Bear are backward-looking indicators of recent sentiment trend.
As a group, these three scores can be quite helpful for positioning a portfolio for a given set of anticipated market conditions.
Observations:
1. There is no change in the rankings this week. Technology (IYW) returns to the top spot with a rising Outlook score of 86. Price weakness within Tech has kept valuations strong, and IYW still shows the best long-term growth rate, forward P/E, and return ratios. Wall Street analysts remain relatively quiet in their adjustments to earnings estimates, so the analyst scores in the Outlook rank are still mostly irrelevant this week. This has allowed Consumer Goods (IYK) to garner the best analyst score and rise to number two in the Outlook rank with a score of 76. Healthcare (IYH) is in third place at 71, and then there is a rather large 22-point gap down to Financial (IYF) in fourth place.
2. Telecom (IYZ) stays in the cellar with an Outlook score of 18, and is once again joined in the bottom two by Basic Materials (IYM), scoring 29. Stocks within IYZ appear overvalued from the standpoint of the forward P/E, and stocks within IYM lack analyst support, including a weak projected long-term earnings growth rate.
3. Overall, I would continue to characterize the Outlook rankings as neutral, with the aggressive and defensive sectors mixed about in the rankings. Only three sectors score above 50, and two of those are defensive (non-cyclical) sectors (IYK and IYH). All of this indicates uncertainty about economic growth and the Federal budget negotiations.
4. Looking at the Bull scores, Materials (IYM) is the clear leader on strong market days, scoring 63. Utilities (IDU) is the clear laggard on strong market days, scoring 40. In other words, Materials stocks have tended to perform the best when the market is rallying, while Utilities stocks have lagged.
5. Looking at the Bear scores, Utilities (IDU) is the clear investor safe haven on weak market days, scoring 59. Materials (IYM) is the weakest during market weakness, as reflected in its low Bear score of 39, followed closely by Energy (IYE) at 40. In other words, Materials and Energy stocks have been selling off the most lately when the market is pulling back, while Utilities stocks have held up the best.
6. Overall, Technology (IYW) now shows the best all-weather combination of Outlook/Bull/Bear scores. Adding up the three scores gives a total of 184. Telecom (IYZ) is by far the worst at 112. As for Bull/Bear combination, Financial (IYF) and Consumer Goods (IYK) share the best score at 103, while Telecom (IYZ) is the worst at 94.
These scores represent the view that the Technology and Consumer Goods sectors may be relatively undervalued overall, while Telecom and Basic Materials sectors may be relatively overvalued based on our 1-3 month forward look.
Top-ranked stocks within IYW and IYK include CommVault Systems (CVLT), InterDigital (IDCC), Ingredion (INGR), and Polaris Industries (PII).
By the way, have you reviewed performance of Sabrient’s “Baker’s Dozen” Top Stocks for 2012 lately? The model portfolio is up 35% YTD, led by Ocwen Financial (OCN) at 133%, Western Refining (WNR) at 105%, and Seagate Technology (STX) at 64%.
Also, Sabrient subsidiary Gradient Analytics, whose team of analysts performs in-depth analysis of forensic accounting, earnings quality, and equity incentives, has been knocking some balls out of the park lately. For example, back in February they published a brief “snapshot” on Men’s Wearhouse (MW) citing troubling divergences in cash flow vs. earnings and in inventory growth vs. sales growth. Then on November 27, they initiated full coverage with a detailed report on the same issues as well as outsized insider selling. On Wednesday afternoon, MW disappointed in its earnings report, and the stock fell 10% in afterhours trading.
Disclosure: Author has no positions in stocks or ETFs mentioned.
About SectorCast: Rankings are based on Sabrient’s SectorCast model, which builds a composite profile of each equity ETF based on bottom-up aggregate scoring of the constituent stocks. The Outlook Score employs a fundamentals-based multi-factor approach considering forward valuation, earnings growth prospects, Wall Street analysts’ consensus revisions, accounting practices, and various return ratios. It has tested to be highly predictive for identifying the best (most undervalued) and worst (most overvalued) sectors, with a 1-3 month forward look.
Bull Score and Bear Score are based on the price behavior of the underlying stocks on particularly strong and weak days during the prior 40 market days. They reflect investor sentiment toward the stocks (on a relative basis) as either aggressive plays or safe havens. So, a high Bull score indicates that stocks within the ETF have tended recently toward relative outperformance during particularly strong market periods, while a high Bear score indicates that stocks within the ETF have tended to hold up relatively well during particularly weak market periods.
Thus, ETFs with high Bull scores generally perform better when the market is hot, ETFs with high Bear scores generally perform better when the market is weak, and ETFs with high Outlook scores generally perform well over time in various market conditions.
Of course, each ETF has a unique set of constituent stocks, so the sectors represented will score differently depending upon which set of ETFs is used. For Sector Detector, I use ten iShares ETFs representing the major U.S. business sectors.
About Trading Strategies: There are various ways to trade these rankings. First, you might run a sector rotation strategy in which you buy long the top 2-4 ETFs from SectorCast-ETF, rebalancing either on a fixed schedule (e.g., monthly or quarterly) or when the rankings change significantly. Another alternative is to enhance a position in the SPDR Trust exchange-traded fund (SPY) depending upon your market bias. If you are bullish on the broad market, you can go long the SPY and enhance it with additional long positions in the top-ranked sector ETFs. Conversely, if you are bearish and short (or buy puts on) the SPY, you could also consider shorting the two lowest-ranked sector ETFs to enhance your short bias.
However, if you prefer not to bet on market direction, you could try a market-neutral, long/short trade—that is, go long (or buy call options on) the top-ranked ETFs and short (or buy put options on) the lowest-ranked ETFs. And here’s a more aggressive strategy to consider: You might trade some of the highest and lowest ranked stocks from within those top and bottom-ranked ETFs.