Sector Detector: August consolidation offers chance to buy top stocks from top sectors
Stocks saw elevated volume and volatility last week, and the 100-day simple moving average on the S&P 500 proved to be the proverbial line-in-the-sand for bullish investors. I opined last week that the market seemed to have sufficiently cycled back down to oversold territory, so with a little more technical consolidation and successful testing of nearby support levels, the next move higher could easily commence at any time. So, the question remains as to whether that was the big new buying opportunity, or whether more backing-and-filling is needed. Personally, I would prefer to see a successful test of the 200-day SMA, but the market might not be so generous.
In this weekly update, I give my view of the current market environment, offer a technical analysis of the S&P 500 chart, review our weekly fundamentals-based SectorCast rankings of the ten U.S. business sectors, and then offer up some actionable trading ideas, including a sector rotation strategy using ETFs and an enhanced version using top-ranked stocks from the top-ranked sectors.
Market overview:
U.S. Treasuries continue to enjoy strong demand. The 10-year yield fell even further this week, closing Friday at 2.42%. So, the bond market is telling us that the Fed will not raise interest rates in the near term. However, high-yield corporate bonds, which have enjoyed a multi-year bull run as income investors have taken on risk in search of higher yields, saw accelerated losses last week. According to Bank of America Merrill Lynch, total dollar outflows last week were the largest ever and the fourth largest as a percentage of AUM. So, all in all, bonds displayed risk-off activity, which of course should be no surprise.
Of course, overbought technical conditions combined with frightening geopolitical turmoil have made equity investors hesitant. And then there was the $100 billion in M&A that suddenly collapsed last Tuesday when the Twenty-First Century Fox (FOX) acquisition of Time Warner (TWX) and the Sprint (S) bid for T-Mobile US (TMUS) both fell apart. Nevertheless, M&A and stock buybacks remain robust -- and are expected to continue as such.
And Friday saw quite a resumption in bullish sentiment, with green across the board. In fact, all 13 of Sabrient’s Baker’s Dozen top stocks for 2014 finished the day positive. Interestingly, the five leaders in the portfolio on Friday were those stocks that have been the laggards so far this year, including Huntington Ingalls Industries (HII), NetApp Inc. (NTAP), Prudential Financial (PRU), Express Scripts (ESRX), and Marathon Petroleum (MPC). Top performers year-to-date are NXP Semiconductors (NXPI) and Southwest Airlines (LUV).
The CBOE Market Volatility Index (VIX), a.k.a. fear gauge, spiked a few times during the week above 17 but closed Friday at 15.77, which is back near the magic 15 level. If VIX can fall back below 15, equity bulls should be able to make a good upside run. Also, there was a lot of put buying last week, and those who took the other side of those trades at the strikes with highest open interest had to short stocks or futures to protect themselves (i.e., delta-hedge selling). So, if the market can hold up during this expiration week, short-covering might be a source of added fuel for the bulls.
Looking at the ten U.S. business sectors, Technology has surged to the year-to-date performance lead, up about +11%. Utilities has lost its big lead and now sits in a virtual tie for second place in YTD performance at around +10% with Energy and Healthcare. Notably, since May 1, Utilities has lost about -4% while Technology has gained about +7%. At the bottom are Industrial, Consumer Services/Discretionary, and Telecommunications. As a reminder, our forward-looking SectorCast rankings have consistently put Technology at the top, while Telecom and Consumer Services/Discretionary have dwelled at the bottom.
By the way, have you noticed the tremendous outperformance so far this year in the Sabrient Defensive Equity Index, which is tracked by the Guggenheim Defensive Equity ETF (DEF), compared with the SPDR S&P 500 Trust (SPY), Guggenheim S&P 500 Equal Weight ETF (RSP), and PowerShares S&P 500 Low Volatility Portfolio (SPLV)? DEF is up nearly +10% YTD while RSP and SPY are up less than +6% and SPLV is up less than +4%. I have long considered DEF as the original low-volatility large cap ETF since 2006, even though SPLV came along in 2011 to claim the mantle (as well as most of the assets).
SPY chart review:
The SPDR S&P 500 Trust (SPY) closed last Friday at 193.24, which is up slightly from the prior Friday, after a week of consolidation and testing of support on elevated volume at the 100-day simple moving average. So far it has held, and Friday was a very strong day across the board. Additional support levels are nearby, including resistance-turned-support lines at 190 and 187.5, the 200-day SMA around 190, and the lower line of the larger rising bullish channel approaching 188. Oscillators RSI, MACD, and Slow Stochastic have all turned back up from oversold territory and could rally further from here.
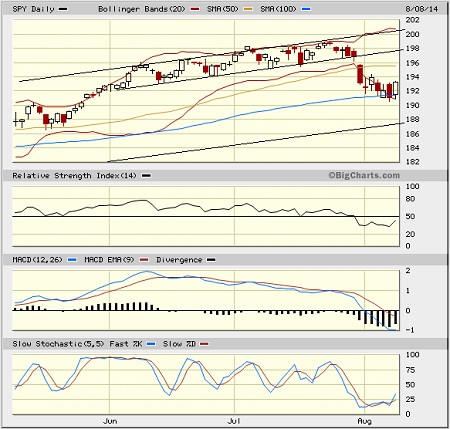
The Russell 2000 small cap index closed Friday at 112.27 and remains well below its important 200-day SMA. But it rallied stronger last week than the large caps, and it looks like it could make a run at its 100- and 200-day SMAs (which are converging at 114) during this rally phase. How it behaves at that test of resistance might be a tell-tale sign for the market overall.
Latest sector rankings:
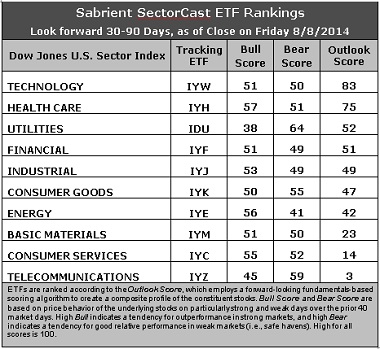
Relative sector rankings are based on our proprietary SectorCast model, which builds a composite profile of each equity ETF based on bottom-up aggregate scoring of the constituent stocks. The Outlook Score employs a forward-looking, fundamentals-based multifactor algorithm considering forward valuation, historical and projected earnings growth, the dynamics of Wall Street analysts’ consensus earnings estimates and recent revisions (up or down), quality and sustainability of reported earnings (forensic accounting), and various return ratios. It helps us predict relative performance over the next 1-3 months.
In addition, SectorCast computes a Bull Score and Bear Score for each ETF based on recent price behavior of the constituent stocks on particularly strong and weak market days. High Bull score indicates that stocks within the ETF recently have tended toward relative outperformance when the market is strong, while a high Bear score indicates that stocks within the ETF have tended to hold up relatively well (i.e., safe havens) when the market is weak.
Outlook score is forward-looking while Bull and Bear are backward-looking. As a group, these three scores can be helpful for positioning a portfolio for a given set of anticipated market conditions. Of course, each ETF holds a unique portfolio of stocks and position weights, so the sectors represented will score differently depending upon which set of ETFs is used. We use the iShares that represent the ten major U.S. business sectors: Financial (IYF), Technology (IYW), Industrial (IYJ), Healthcare (IYH), Consumer Goods (IYK), Consumer Services (IYC), Energy (IYE), Basic Materials (IYM), Telecommunications (IYZ), and Utilities (IDU). Whereas the Select Sector SPDRs only contain stocks from the S&P 500, I prefer the iShares for their larger universe and broader diversity. Fidelity also offers a group of sector ETFs with an even larger number of constituents in each.
Here are some of my observations on this week’s scores:
1. Technology still holds the top spot with an Outlook score of 83. The sector displays solid scores across most factors in the model, including solid Wall Street analyst sentiment (net upward revisions to earnings estimates), a good forward long-term growth rate, and strong return ratios. The forward P/E is below average (Financial has the lowest), as well as insider sentiment (open market buying). Healthcare remains in the second spot this week with a score of 75 as the sector continues to display the strongest (and still improving) sell-side analyst sentiment (upward revisions), a good forward long-term growth rate, and reasonable return ratios. Utilities has suddenly jumped into the third spot while Energy has plummeted to seventh, largely due to their respective Wall Street upgrades. Financial and Industrial round out the top five.
2. Telecom stays in the cellar this week with an Outlook score of 3, as the sector has low scores on most factors in the model. Consumer Services/Discretionary stays in the bottom two with a score of 14, despite a strong forward long-term growth rate. Telecom got hit with a lot of new analyst downward revisions.
3. Looking at the Bull scores, Healthcare displays the strongest score of 57, followed closely by Energy, while Utilities remains the clear laggard at 38. The top-bottom spread is 19 points, reflecting lower sector correlations on particularly strong market days. It is generally desirable in a healthy market to see lower correlations and a top-bottom spread of at least 20 points, which indicates that investors have clear preferences in the stocks they want to hold, rather than the all-boats-lifted-in-a-rising-tide mentality that dominated 2013.
4. Looking at the Bear scores, Utilities is the clear leader with a score of 64, which means that stocks within this sector have been the preferred safe havens on weak market days. Telecom also has shown good relative strength in market weakness. Energy, which has displayed high Bear scores at times lately, now displays the lowest score of 41. The top-bottom spread has expanded to 23 points, reflecting low sector correlations on particularly weak market days. Again, it is generally desirable in a healthy market to see low correlations and a top-bottom spread of at least 20 points.
5. Technology and Healthcare display the best all-weather combination of Outlook/Bull/Bear scores, while Telecom is clearly the worst. Looking at just the Bull/Bear combination, Healthcare is the leader, followed by somewhat surprisingly by Consumer Services/Discretionary, indicating superior relative performance (on average) in extreme market conditions (whether bullish or bearish). Energy, which at times has displayed the best Bull/Bear combo score, suddenly shows the worst one now, indicating general investor avoidance during extreme conditions.
6. Overall, this week’s fundamentals-based Outlook rankings look neutral to me. Utilities has risen at the expense of Energy, and the highest Bull and Bear scores are mixed across the rankings rather than congregated at the top or bottom.
These Outlook scores represent the view that the Technology and Healthcare sectors are relatively undervalued, while Telecom and Consumer Services/Discretionary may be relatively overvalued based on our 1-3 month forward look.
Stock and ETF Ideas:
Our Sector Rotation model, which appropriately weights Outlook, Bull, and Bear scores in accordance with the overall market’s prevailing trend (bullish, neutral, or bearish), suggests holding Technology, Healthcare, and Utilities (in that order) in the prevailing neutral climate. (Note: In this model, we consider the bias to have moved to neutral from a rules-based standpoint because SPY remains below its 50-day simple moving average while staying above its 200-day SMA.)
Other highly-ranked ETFs from the Technology, Healthcare, and Energy sectors include PowerShares Dynamic Semiconductors Portfolio (PSI), Market Vectors Biotech ETF (BBH), and First Trust Utilities AlphaDEX Fund (FXU).
For an enhanced sector portfolio that enlists top-ranked stocks (instead of ETFs) from within Technology, Healthcare, and Utilities, some long ideas include F5 Networks (FFIV), Zillow (Z), Biogen idec (BIIB), Illumina Inc (ILMN), NRG Yield (NYLD), and UGI Corp (UGI). All are highly ranked in the Sabrient Ratings Algorithm and also (except for the Utilities stocks) score within the top two quintiles (lowest accounting-related risk) of our Earnings Quality Rank (a.k.a., EQR), a pure accounting-based risk assessment signal based on the forensic accounting expertise of our subsidiary Gradient Analytics. (Note: Utilities are not covered by EQR.) We have found EQR quite valuable for helping to avoid performance-offsetting meltdowns in our model portfolios.
However, if you think the market will strengthen once again and you prefer to maintain a bullish market bias, the Sector Rotation model suggests holding Healthcare, Technology, and Energy (in that order). But if you have a bearish outlook on the market, the model suggests holding Utilities, Technology, and Healthcare (in that order).
Disclosure: Author has no positions in stocks or ETFs mentioned.
Disclaimer: This newsletter is published solely for informational purposes and is not to be construed as advice or a recommendation to specific individuals. Individuals should take into account their personal financial circumstances in acting on any rankings or stock selections provided by Sabrient. Sabrient makes no representations that the techniques used in its rankings or selections will result in or guarantee profits in trading. Trading involves risk, including possible loss of principal and other losses, and past performance is no indication of future results.