Sector Detector: Healthcare struggles under election campaign attacks, while Tech, Financial, and Small Caps lead an overall bullish market
By Scott Martindale
President, Sabrient Systems LLC
Overall, it appears that the stock market continues to focus more on improving fundamentals than on the daily news. We continue to see improved market breadth, low volatility, lower sector correlations, and capital flows into higher quality companies with solid fundamentals, attractive valuations, good earnings quality, and strong market position. Small and mid-caps have been leading market segments, especially those from the Energy sector. Among large caps, Technology and Financial sectors have been strong during Q3, while defensive sectors Utilities and Telecom have pulled back across all market caps after showing inordinate strength for much of the year (although they still remain strong YTD).
All of this is bullish – and is illustrative of the healthy broadening of the market. Although some traders appear to be taking some chips off the table in deference to September’s notoriety as the worst performing month of the year, I think the path of least resistance for stocks is to the upside.
In this periodic update, I give my view of the current market environment, offer a technical analysis of the S&P 500 chart, review our weekly fundamentals-based SectorCast rankings of the ten U.S. business sectors, and then offer up some actionable ETF trading ideas.
Market overview:
Despite the market’s impressive show of strength and resilience, stocks remain widely unloved. Just look at some of the forecasts emanating from various bulge bracket firms. FINSUM (Financial News Summarized) put out a bunch of summaries on these articles, with headlines like “UBS Warns of Imminent S&P 500 Crash,” and “Goldman Warns a Bear Market is Inevitable,” and “Bank of America Warns Markets to Tumble.” Furthermore, Barron’s wrote a piece on this growing bearishness on Wall Street, noting that we have not seen since 2002-3 such a bearish consensus from this traditionally bullish cohort.
On the other hand, it is notable that Bank of America also issued a separate article (in contrast to their earlier dire one) putting a positive contrarian spin on this same sell-side bearishness. They wrote that their proprietary Sell Side Indicator, which measures the bullishness of Wall Street analysts, now sits at its lowest level since 2013 and noted that whenever it has been this low, total market return over the ensuing 12 months has been positive 100% of the time with a median return of 27%. That kind of performance would certainly surprise a lot of people. In addition, Morgan Stanley forecasts that the S&P 500 will rise to 2,300 during the next several months, citing the attractive relative valuation of stocks versus bonds (i.e., earnings yield premium), improving corporate earnings, low expectations, and the appealing liquidity of US stocks.
The upshot is that you can find a “historically reliable indicator” to justify just about any market view right now. For my part, I still see a continuing healthy broadening of the market and a persistent movement of investment capital into higher-quality companies. Nevertheless, many investors remain quite hesitant given all the extreme market forecasts and global uncertainties, so it is possible that we will see continued low trading volumes and a narrow trading range, perhaps until the November elections.
Last summer, a populist message gained traction during the early presidential election campaign, which led to many of the drug companies finding themselves in the crosshairs of some of the candidates due to perceived inequities in their pricing strategies. This led the entire Healthcare sector, which had long been the market leader, to give back some gains as the Wall Street investment community preferred to sit out until the smoke cleared. After clearing briefly, the smoke is now kicking up again. Hillary, perhaps to shore up support among disillusioned Bernie supporters, has offered up a proposal to allow the government to impose penalties on what it considers “unjustified prices increases.”
No doubt, the “little guy” (e.g., the lower middle class and working poor) often finds himself victimized by the free market. This usually happens when demand outstrips supply and prices rise, sometimes because of important patent protections for a firm’s investment that create barriers to entry for competitors. But when it comes to life-saving meds, people have a harder time accepting the rules of the system that are designed to incentivize innovation and new product development. On the other hand, it doesn’t seem unreasonable for a parent to want to save her child’s life without going into heavy debt or bankruptcy – so why can’t a company show some heart? Well, even if it doesn’t, by golly, never fear, your government has arrived and it is here to help.
While this story has been playing out over the past year with regard to drug companies and the plight of citizens with high deductibles or generic-only coverage (when there are no generic alternatives), there are plenty of other industries that also create hardships for those least able to pay. Perhaps those industries are next to be targeted. Here are just two examples: consumer finance and property & casualty insurance. Someone who has endured financial struggles resulting in a low credit score and now needs to buy a car or take out a loan for anything else will pay a much higher interest rate than a wealthier person with a stellar credit rating, resulting in thousands of dollars more in interest payments over the life of the loan. Likewise, this same person may live in a crime-ridden part of town that an actuary deems higher risk, thus pushing up insurance rates well above what a wealthier client must pay.
And then let’s not forget the “greedy” oil companies (when gas prices spike), or “colluding” airlines (when airfares mysteriously rise), or “gouging” hoteliers (when room rates spike, such as after a localized natural disaster). In so many cases, we have witnessed the pattern of popular outrage, followed by investigations and then congressional hearings – with corporate executives paraded in to explain themselves.
But I think the reality is this is all symptomatic of the regressive cost structure of life in a capitalist society, which creates opportunities and incentives for a citizen to aspire to greater wealth while often making it hard to climb out of difficult financial straits. Will the heavy hand of government soon turn its ire (yet again) to these other industries? Despite the populist appeal of attacking a “heartless” corporate America, we must be vigilant about creeping socialism – which purports to ensure fairness and to narrow the wealth gap, but with the by-product of reducing incentives (for innovation and productivity) and ultimately eroding our overall standard of living.
Rather than the federal government spending its time on ad hoc hearings and creating new regulations and price controls on whatever the press deems as the populist topic of the day, I think it would be better served to focus on creating broad economic stimulus through new fiscal policies and structural/regulatory reforms … and perhaps even some infrastructure spending. Placing all the burden on the Federal Reserve and its limited monetary policy tools has proven woefully inadequate. Inflationary monetary policies alone cannot spur economic growth or reverse the growing wealth gap, especially when loose monetary policies are countered by relatively tight fiscal policies. The economy goes nowhere. Worse yet, it correlates and elevates asset prices (e.g., stocks, bonds, real estate), which may be dangerous for investors, while essentially keeping assets out of reach of those aspiring to own.
The 10-year Treasury yield closed Thursday at 1.62% and the 30-year at 2.32%, while on the short end the 2-year is 0.77% and the 5-year is 1.19%. The spread between the 10-year and 2-year is 85 bps, and the spread between the 30-year and 5-year is 113 bps, as the yield curve remains relatively flat. Also, CME fed funds futures place the odds of a rate hike on September 21 at 21%, 24% for November, and 57% for at least one hike by the December 14 FOMC meeting.
I have long argued that there simply are no drivers for rates to go up. The Fed raising short term rates would have little impact on global capital flows into longer-dated bonds, thus serving only to further flatten the yield curve. Now Goldman Sachs is forecasting that rates will stay low for a long time and that the Fed is coming around to a new view that the natural rate of interest in today’s world is much lower than previously assumed. Guggenheim has made a similar prediction. (Note: the natural rate of interest is the real short-term interest rate that would be neither expansionary nor contractionary if the economy were operating at its potential.) It may now be close to zero in the US and negative in the Eurozone and Japan, according to John Williams of the Federal Reserve Bank of San Francisco, with the implication that conventional monetary policy is much less effective in providing the intended economic stimulus.
Indeed, given the low interest rate environment – with no end in sight – it is difficult to know what the appropriate value for the S&P 500 should be right now, on the basis of discounted present value of expected future earnings streams. But to me, US equities still look relatively attractive when compared to the alternatives, given abundant global liquidity and foreign capital inflows to the US, massive corporate stock buyback programs, low inflation risk, strong housing, decent job growth, modest wage inflation, low fuel prices, solid US consumer spending, improving US corporate earnings growth, the huge premium for earnings yield of stocks versus the 10-year Treasury yield, and lots of cash still on the sidelines.
Moreover, volatility is extraordinarily low, as the CBOE Market Volatility Index (VIX), aka fear gauge, closed Thursday at 12.51, which is right where it was when I last wrote 3 weeks ago, and since early July it has held solidly below the 15 threshold between fear and complacency. S&P Dow Jones Indices reported that for August, the S&P 500 recorded its second lowest volatility in a decade as volatility and correlation reached multi-year lows in several of their indices.
SPY chart review:
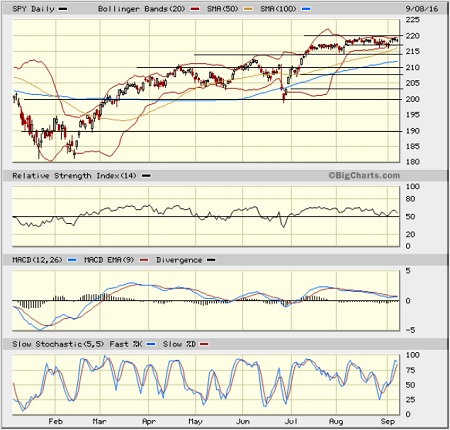
The SPY closed Thursday at 218.51, which is right about where it was when I last wrote 3 weeks ago. Obviously, it has been stuck in a narrow trading range between about 216 and 220 for the past month. In fact, it has traded for 39 straight days within a daily range of less 1%. The biggest action came last Thursday when it tested the 216 line in anticipation of a strong jobs report followed by hawkish Fed comments. But the jobs report was mildly disappointing, so the market rallied quite bullishly on Friday-Monday. Bollinger Bands have pinched tightly together during this low-volatility action, coiling for a big move (likely to the upside). Solid support can be found at the 50-day simple moving average (around 216), the 100-day (near 212), and prior resistance-turned support at 210, followed by 208, the 200-day SMA (near 206), and then a prior bullish gap from 204. Oscillators RSI and MACD are in neutral territory, but Slow Stochastic could stand to cycle lower. Also encouraging is that while the large cap SPY has been consolidating in a sideways pattern, mid-caps and small caps have continued to rise. Overall, the technical picture continues to look solid.
Latest sector rankings:
Relative sector rankings are based on our proprietary SectorCast model, which builds a composite profile of each equity ETF based on bottom-up aggregate scoring of the constituent stocks. The Outlook Score employs a forward-looking, fundamentals-based multifactor algorithm considering forward valuation, historical and projected earnings growth, the dynamics of Wall Street analysts’ consensus earnings estimates and recent revisions (up or down), quality and sustainability of reported earnings (forensic accounting), and various return ratios. It helps us predict relative performance over the next 1-3 months.
In addition, SectorCast computes a Bull Score and Bear Score for each ETF based on recent price behavior of the constituent stocks on particularly strong and weak market days. High Bull score indicates that stocks within the ETF recently have tended toward relative outperformance when the market is strong, while a high Bear score indicates that stocks within the ETF have tended to hold up relatively well (i.e., safe havens) when the market is weak.
Outlook score is forward-looking while Bull and Bear are backward-looking. As a group, these three scores can be helpful for positioning a portfolio for a given set of anticipated market conditions. Of course, each ETF holds a unique portfolio of stocks and position weights, so the sectors represented will score differently depending upon which set of ETFs is used. We use the iShares that represent the ten major U.S. business sectors: Financial (IYF), Technology (IYW), Industrial (IYJ), Healthcare (IYH), Consumer Goods (IYK), Consumer Services (IYC), Energy (IYE), Basic Materials (IYM), Telecommunications (IYZ), and Utilities (IDU). Whereas the Select Sector SPDRs only contain stocks from the S&P 500, I prefer the iShares for their larger universe and broader diversity.
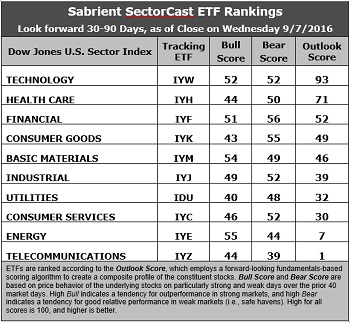
Here are some of my observations on this week’s scores:
1. Technology retains the top spot with a robust Outlook score of 93. Stocks within the sector generally display among the best Wall Street sell-side analyst sentiment (net revisions to earnings estimates) and insider sentiment, solid return ratios, a reasonable forward P/E of about 16.8x, a strong forward long-term EPS growth rate (14%), and the lowest forward PEG of 1.2 (ratio of forward P/E to forward EPS growth rate). Healthcare comes in second with an Outlook score of 71, and displays an attractive forward P/E of about 15.8x (which has fallen as the drug companies have come under attack) and the second lowest forward PEG of 1.4. However, Wall Street analyst sentiment has dipped as some analysts have reduced estimates. Rounding out the top of the rankings are Financial in third, followed by Consumer Goods (Staples/Noncyclical), Basic Materials, and Industrial. Financial still displays the lowest forward P/E of 15.5x.
2. Energy and Telecom remain in the bottom two. Nevertheless, Energy displays the second highest forward long-term growth rate of 12.8% (albeit because of a low bar for prior-year comps) and improving Wall Street sentiment (net revisions to earnings estimates), but it is held back by a high forward P/E (30x), a forward PEG of 2.4, and weak return ratios. Telecom also displays a relatively high forward P/E (25x) and forward PEG (2.3).
3. Looking at the Bull scores, Energy has the top score of 55, followed closely by Basic Materials, as they display relative strength on strong market days, while Utilities is the lowest at 40. The top-bottom spread is 15 points, which reflects moderately low sector correlations on strong market days, which can be good for stock picking. It is desirable in a healthy market to see low correlations reflected in a top-bottom spread of at least 20 points, which indicates that investors have clear preferences in the stocks they want to hold (rather than broad risk-on behavior).
4. Looking at the Bear scores, Utilities and Telecom have been weak in anticipation of possible Fed action, so Financial displays the top score of 56, followed by Consumer Goods (Staples/Noncyclical) at 55, which means that stocks within these sectors have been the preferred safe havens lately on weak market days (although there really haven’t been many). Telecom scores the lowest at 39, as investors flee during market weakness. The top-bottom spread is 17 points, which reflects relatively low sector correlations on weak market days, which can be good for stock picking. Ideally, certain sectors will hold up relatively well while others are selling off (rather than broad risk-off behavior), so it is desirable in a healthy market to see low correlations reflected in a top-bottom spread of at least 20 points.
5. Technology displays by far the best all-around combination of Outlook/Bull/Bear scores, while Telecom is by far the worst. However, looking at just the Bull/Bear combination, Financial is now the best, indicating superior relative performance (on average) in extreme market conditions (whether bullish or bearish), while Telecom is scoring the worst.
6. This week’s fundamentals-based Outlook rankings look bullish to me given that the top six sectors include traditionally all-weather Healthcare and economically-sensitive Technology, Financial, Basic Materials, and Industrial, along with just one defensive sector in Consumer Goods (Staples/Noncyclical), while defensive sectors Utilities and Telecom are ranked near the bottom. Keep in mind, the Outlook Rank does not include timing, momentum, or relative strength factors, but rather is a reflection of the fundamental expectations for individual stocks aggregated by sector.
ETF Trading Ideas:
Our Sector Rotation model, which appropriately weights Outlook, Bull, and Bear scores in accordance with the overall market’s prevailing trend (bullish, neutral, or defensive), continues to reflect a bullish bias and suggests holding Technology (IYW), Basic Materials (IYM), and Financial (IYF), in that order. (Note: In this model, we consider the bias to be bullish from a rules-based trend-following standpoint when SPY is above both its 50-day and 200-day simple moving averages.)
Besides iShares’ IYW, IYM, and IYF, other highly-ranked ETFs in our SectorCast model from the Technology, Basic Materials, and Financial sectors include First Trust NASDAQ Technology Dividend Index Fund (TDIV), PowerShares DWA Basic Materials Momentum Portfolio (PYZ), and iShares US Regional Banks ETF (IAT).
An assortment of other ETFs that are scoring well in our rankings include First Trust NASDAQ Rising Dividend Achievers ETF (RDVY), iShares Mortgage Real Estate Capped ETF (REM), John Hancock Multifactor Technology ETF (JHMT), and the First Trust LongShort Equity ETF (FTLS), which employs Sabrient’s proprietary Earnings Quality Rank as a key input factor.
If you prefer a neutral bias, the Sector Rotation model suggests holding Technology, Healthcare, and Financial, in that order. On the other hand, if you prefer a defensive stance on the market, the model suggests holding Technology, Financial, and Consumer Goods (Staples/Noncyclical), in that order.
IMPORTANT NOTE: I post this information periodically as a free look inside some of our institutional research and as a source of some trading ideas for your own further investigation. It is not intended to be traded directly as a rules-based strategy in a real money portfolio. I am simply showing what a sector rotation model might suggest if a given portfolio was due for a rebalance, and I may or may not update the information on a regular schedule. There are many ways for a client to trade such a strategy, including monthly or quarterly rebalancing, perhaps with interim adjustments to the bullish/neutral/defensive bias when warranted -- but not necessarily on the days that I happen to post this article. The enhanced strategy seeks higher returns by employing individual stocks (or stock options) that are also highly ranked, but this introduces greater risks and volatility. I do not track performance of the ideas mentioned here as a managed portfolio.
Disclosure: Scott Martindale is president of Sabrient Systems, LLC. The author has no positions in stocks or ETFs mentioned.
Disclaimer: This newsletter is published solely for informational purposes and is not to be construed as advice or a recommendation to specific individuals. Individuals should take into account their personal financial circumstances in acting on any rankings or stock selections provided by Sabrient. Sabrient makes no representations that the techniques used in its rankings or selections will result in or guarantee profits in trading. Trading involves risk, including possible loss of principal and other losses, and past performance is no indication of future results.