Sector Detector: Investors find a reason to sell, teeing up a new buying opportunity
When I’m in my sales role, I view every prospective client as falling into one of two broad baskets: those looking for a reason to say yes, and those looking for a reason to say no. I always try to focus on the former and spend little time on the latter. Likewise, last week’s market was dominated by those looking for a reason to sell. And so they did. Good news in the jobs and unemployment reports spooked investors on Friday, and stocks fell hard. So, for the moment we are back to a Fed-driven good-news-is-bad-news story line, or so it would seem. However, the real story is that when markets are overbought and hitting new highs on declining volume, investors look for any catalyst to take profits. But make no mistake, all signs point to more upside in U.S. equities. Bulls will simply wait for the moment when investors are again looking for a reason to buy. As the overbought conditions are relieved, that time will arrive once again.
In this weekly update, I give my view of the current market environment, offer a technical analysis of the S&P 500 chart, review our weekly fundamentals-based SectorCast rankings of the ten U.S. business sectors, and then offer up some actionable trading ideas, including a sector rotation strategy using ETFs and an enhanced version using top-ranked stocks from the top-ranked sectors.
Market overview:
Today is the 6-year anniversary of this persistent bull market, which many commentators deem as too long with a major selloff imminent. But bull markets don’t die of old age. The economy has been slow but steady in gaining traction, and cautious investors continue to worry about things like bull traps, global economic malaise, rising terrorism, and a strong dollar (hitting the earnings of multinationals). So, there are no signs of overheating in this economic recovery. And with supportive central banks keeping the liquidity flowing and interest rates low, there is still plenty of cash on the sidelines seeking better returns.
Q4 earnings season is about to wrap up, and total S&P 500 EPS indicates about 7.8% growth over last year. Healthcare, Technology, and Consumer Services/Discretionary/Cyclical have been the leading sectors, with the Retail segment looking particularly strong over the last few weeks of the quarter. However, FY2015 is only expected to generate 1% growth, compared with the Euro 350 expectation of 12%.
Although we are likely going to see Q1 results hurt by the severe winter, similar to last year’s Q1, it is not indicative of a slowing U.S. economy. Indeed, February payrolls were robust and unemployment fell to 5.5%, while the ISM services index clocked in above consensus at 56.9. Thus, with nervous investors protecting their profits in the face of uncertainty of the Federal Reserve starting the process of normalizing interest rates, the strong jobs report and fall in unemployment led everyone to think that the Fed will feel emboldened to make its first fed funds rate increase. Although the first rate hike make come in June, it’s equally likely that it will come later -- perhaps even in 2016.
S&P Capital IQ Global Markets Intelligence (GMI) Research published their latest outlook that the FOMC hawks and doves will need to come to agreement on two things before beginning a tightening of monetary policy. First, the core personal consumption expenditure deflator (1.3% in January) will need to reverse its declining trend in order to hit the 2% target core inflation rate, and second, the job market must see tightening conditions and wage inflation.
Interestingly, Brian Wesbury of First Trust Portfolios observed that the Federal Reserve’s bond holdings now total $4.25 trillion, which is more than the entire annual federal budget and equates to 24% of GDP. But, he points out that it peaked at 16% of GDP in 1939 at the end of the Great Depression, and averaged 12.6% during World War II. Moreover, during the 1980s and 1990s, the Fed balance sheet averaged only 5.2% of GDP. The Fed is now the largest financial entity in the world, and he insists it must begin shrinking its balance sheet and draining excess reserves from the banking system in order to normalize rates.
Overseas, the People’s Bank of China cut its benchmark interest rates by 25 bps and downgraded its GDP growth forecasts to 15-year lows, while India released a pro-growth budget that emphasizes infrastructure projects rather than subsidies. This month, the ECB will begin its own quantitative easing program, playing catch-up with central banks in Japan, U.K., and U.S. Global equities should remain a prime beneficiary of central bank largesse.
The 10-year U.S. Treasury yield closed Friday at 2.24% after a +6% spike on the day, while German 10-year rates are at 0.4% and Italy and Spain are both around 1.3% (and sub-prime, to boot). The spread between the U.S. and these Eurozone countries remains inordinately large, which is further fueling demand for U.S. Treasuries (besides our safe haven status), thus keeping U.S. yields in check.
The Energy sector continues to struggle, and as described below, it ranks firmly at the bottom of our fundamentals-based, forward-looking sector rankings. Oil prices have stabilized around $50, but I was reading (thanks for the article, Kevin) about a developing situation that could delay further price recovery. More than 3,000 wells have been drilled but not completed, and instead the reserves are being stored in situ in anticipation of higher prices in the future. So, these new supplies are being withheld from the market. But as prices start to rise, the wells can be quickly completed and fracked (if necessary) within a few months, thus flooding the market with new supplies and effectively keeping a lid on price increases.
Nevertheless, Exxon Mobil (XOM) announced its plans to double the amount of oil it pumps from U.S. shale fields during the next three years. Apparently their cost structure and high-efficiency technologies contradict those who have predicted that shale wells require $75 pricing to be viable. Furthermore, the firm indicated that opportunistic acquisitions in the space are increasingly likely at prevailing prices.
Another item worth noting is that Apple (AAPL) will join the Dow Jones Industrial Average after the March 18 close, replacing AT&T (T), which will lift the IT sector to over 30% of the index from its current 20%.
The CBOE Market Volatility Index (VIX), a.k.a. fear gauge, closed Friday at 15.20 after a +8% spike on the day, thus barely peeking back above the 15 threshold of investor fear rather than complacency.
SPY chart review:
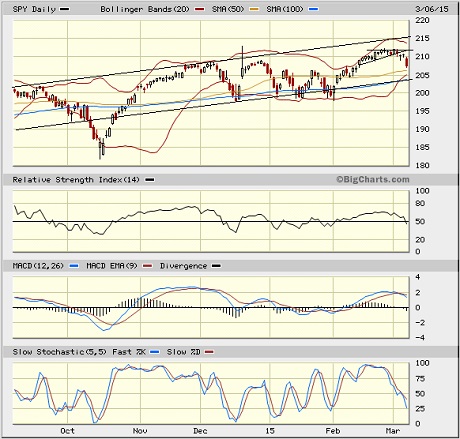
The SPDR S&P 500 Trust (SPY) closed Friday at 207.50. After hitting new highs on declining volume early in the week, it hit a skid, and broke down through the rising trend line of the bullish ascending triangle. However, oscillators RSI, MACD, and Slow Stochastic were all overbought and overdue for a pullback to test support and recharge bullish conviction, with the 50-day simple moving average near 206 as the likely first target. Below that resides the 100-day SMA and the lower uptrend line of the long-standing bullish rising channel, which are both at 204, and then the critical 200-day SMA around 200. From a technical standpoint, this sudden bout of weakness is healthy, and the chart remains bullish in the mid and longer term.
Latest sector rankings:
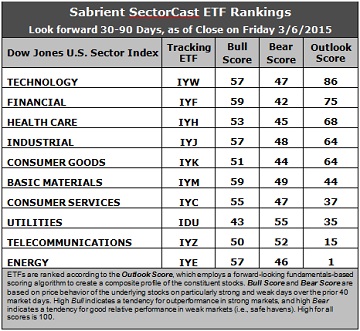
Relative sector rankings are based on our proprietary SectorCast model, which builds a composite profile of each equity ETF based on bottom-up aggregate scoring of the constituent stocks. The Outlook Score employs a forward-looking, fundamentals-based multifactor algorithm considering forward valuation, historical and projected earnings growth, the dynamics of Wall Street analysts’ consensus earnings estimates and recent revisions (up or down), quality and sustainability of reported earnings (forensic accounting), and various return ratios. It helps us predict relative performance over the next 1-3 months.
In addition, SectorCast computes a Bull Score and Bear Score for each ETF based on recent price behavior of the constituent stocks on particularly strong and weak market days. High Bull score indicates that stocks within the ETF recently have tended toward relative outperformance when the market is strong, while a high Bear score indicates that stocks within the ETF have tended to hold up relatively well (i.e., safe havens) when the market is weak.
Outlook score is forward-looking while Bull and Bear are backward-looking. As a group, these three scores can be helpful for positioning a portfolio for a given set of anticipated market conditions. Of course, each ETF holds a unique portfolio of stocks and position weights, so the sectors represented will score differently depending upon which set of ETFs is used. We use the iShares that represent the ten major U.S. business sectors: Financial (IYF), Technology (IYW), Industrial (IYJ), Healthcare (IYH), Consumer Goods (IYK), Consumer Services (IYC), Energy (IYE), Basic Materials (IYM), Telecommunications (IYZ), and Utilities (IDU). Whereas the Select Sector SPDRs only contain stocks from the S&P 500, I prefer the iShares for their larger universe and broader diversity. Fidelity also offers a group of sector ETFs with an even larger number of constituents in each.
Here are some of my observations on this week’s scores:
1. Technology has solidified its hold on first place with an Outlook score of 86. Technology displays the best return ratios, a good forward long-term growth rate and forward P/E, and the best sell-side analyst sentiment (net revisions to earnings estimates). Financial displays by far the lowest forward P/E, reasonably good forward long-term growth rate, and solid sentiment among both insiders (buying activity) and sell-side analysts. Healthcare, Industrial, and Consumer Goods/Staples/Noncyclical round out the top five, followed by Basic Materials and Consumer Services/Discretionary/Cyclical.
2. Once again, Energy continues to hold the bottom spot given the persistent weakness in oil prices and the ongoing downward earnings revisions from Wall Street. (Notably, Utilities is also getting hit with downward revisions.) Energy is among the worst in all factors in the model, and in fact its forward long-term growth rate is virtually zero. Joining Energy in the bottom two is Telecom.
3. Looking at the Bull scores, Financial and Basic Materials display the top score of 59, followed by Technology, Industrial, and Energy at 57. Utilities scores the lowest at 43. The top-bottom spread has widened to 16 points, which reflects lower correlations than the risk-on buying we have seen lately. It is generally desirable in a healthy market to see low correlations reflected in a top-bottom spread of at least 20 points, which indicates that investors have clear preferences in the stocks they want to hold.
4. Looking at the Bear scores, Utilities still displays the highest score of 55 this week (although this is lower than the 60s and 70s of prior weeks), which means that stocks within this sector have been the preferred safe havens on weak market days. Financial has the lowest score of 42. With Utilities falling from 63 to 55, the top-bottom spread has suddenly fallen to 13 points, which indicates higher sector correlations on particularly weak market days (i.e., broad risk-off selling). Ideally, certain sectors will hold up relatively well while others are selling off. Again, it is generally desirable in a healthy market to see low correlations reflected in a top-bottom spread of at least 20 points.
5. Technology displays the best all-around combination of Outlook/Bull/Bear scores, while Energy is the worst. Looking at just the Bull/Bear combination, Basic Materials has emerged as the strongest, followed by Industrial and then Technology, indicating superior relative performance (on average) in extreme market conditions (whether bullish or bearish), which to me is a bullish ranking. Consumer Goods/Staples/Noncyclical is the worst.
6. Overall, this week’s fundamentals-based Outlook rankings look solidly bullish to me, with economically-sensitive sectors Tech, Financial, Industrial, and all-weather Healthcare making up the top four, and with Basic Materials and Consumer Services/Discretionary/Cyclical holding up well. Defensive sectors (with the highest Bear scores) Utilities and Telecom rank near the bottom. However, keep in mind, the Outlook Rank does not include timing or momentum factors, but rather is a reflection of the fundamental expectations of individual stocks aggregated by sector.
Stock and ETF Ideas:
Our Sector Rotation model, which appropriately weights Outlook, Bull, and Bear scores in accordance with the overall market’s prevailing trend (bullish, neutral, or defensive), retains its bullish bias, and the model suggests holding Financial, Technology, and Industrial, in that order. (Note: In this model, we consider the bias to be bullish from a rules-based trend-following standpoint when SPY is above both its 50-day and 200-day simple moving averages.)
Other highly-ranked ETFs from the Financial, Technology, and Industrial sectors include iShares US Regional Banks (IAT), PowerShares Dynamic Semiconductors Portfolio (PSI), and SPDR S&P Transportation ETF (XTN).
For an enhanced sector portfolio that enlists some top-ranked stocks (instead of ETFs) from within the top-ranked sectors, some long ideas from Financial, Technology, and Industrial sectors include FirstMerit (FMER), BB&T Corp (BBT), Cirrus Logic (CRUS), Skyworks Solutions (SWKS), Avis Budget Group (CAR), and Landstar System (LSTR). All are highly ranked in the Sabrient Ratings Algorithm.
However, if you prefer to maintain a neutral bias, the Sector Rotation model suggests holding Technology, Financial, and Healthcare, in that order. And if you prefer a defensive stance on the market, the model suggests holding Utilities, Technology, and Healthcare, in that order.
IMPORTANT NOTE: I post this information each week as a free look inside some of our institutional research and as a source of some trading ideas for your own further investigation. It is not intended to be traded directly as a rules-based strategy in a real money portfolio. I am simply showing what a sector rotation model might suggest if a given portfolio was due for a rebalance, and I may or may not update the information each week. There are many ways for a client to trade such a strategy, including monthly or quarterly rebalancing, perhaps with interim adjustments to the bullish/neutral/defensive bias when warranted -- but not necessarily on the days that I happen to post this weekly article. The enhanced strategy seeks higher returns by employing individual stocks (or stock options) that are also highly ranked, but this introduces greater risks and volatility. I do not track performance of the ETF and stock ideas mentioned here as a managed portfolio.
Disclosure: Author has no positions in stocks or ETFs mentioned.
Disclaimer: This newsletter is published solely for informational purposes and is not to be construed as advice or a recommendation to specific individuals. Individuals should take into account their personal financial circumstances in acting on any rankings or stock selections provided by Sabrient. Sabrient makes no representations that the techniques used in its rankings or selections will result in or guarantee profits in trading. Trading involves risk, including possible loss of principal and other losses, and past performance is no indication of future results.