Sector Detector: Stocks cruise right along, whistling past the graveyard
U.S. stocks just continue to cruise right along, although investors seem to be displaying a healthy level of caution, looking over their shoulders as they whistle past the graveyard and bet on ongoing improvement in corporate earnings and economic growth. Despite extremely overbought technical conditions and regional hot spots that may ultimately threaten global economic recovery, investors seem undeterred. Indeed, all major central banks are now onboard the liquidity bandwagon, and although bonds have not sold off as many expected (to create a Great Rotation into equities), most income and total return-seeking investors in the U.S. see little in the way of attractive alternatives to equities.
The economic data continues to indicate improvement in the U.S. economy. For example, the number of job openings waiting to be filled in the United States rose in April by 289,000 to 4.5 million, which is the highest in nearly seven years. This bodes well for an imminent fall in the unemployment rate. Also, April retail sales were revised upward to +0.5%.
Furthermore, the global economy seems to have the wind at its back, thanks at least in part to central banks around the world providing a sea of liquidity by printing money. The scary side of this is that when the next recession eventually arises, all of these central banks will be low in ammunition to fight it. Nevertheless, for the near term, it seems that all is well for U.S. stocks, even though fears of a major crisis continue to push much of the global liquidity that is being printed into U.S. Treasuries in a flight to quality and safety. The 10-year Treasury yield remains quite low and may yet fall further.
With economies in Europe and the U.S. improving, China has been able to grow exports and expand its trade balance. In addition, China has enacted a number of policies to support the housing market and overall economic growth. All of this seems to have staved off the brewing crisis there.
Of course, there is no free lunch, and Iraq has again turned into a quagmire (perhaps predictably and inevitably, given its long history of Sunni/Shiite discord), replacing the Russian/Ukraine conflict as the hot spot that could ultimately pose real threats to global security, oil prices, and economic recovery. But a Wall of Worry is important to the bullish case by keeping excessive exuberance under control.
Also keeping price progression orderly is the fact that economic expansion is slower than prior recoveries from recessions, so we have not seen the typical excesses that lead to sudden corrections. And now all signs (finally) point to improving economic growth rates later this year. Furthermore, there is a lot of fuel for stocks in the form of cash on the sidelines and in underperforming bond funds.
To be sure, the old adage that you should never short a dull market has certainly rung true lately. There has not been a 10% pullback in U.S. stocks in nearly 3 years. And with the VIX now flirting with single digits, it has been two months since the S&P 500 last had a 1% daily move up or down (the longest such period since 1995, by the way).
Moreover, the CBOE Market Volatility Index (VIX), a.k.a. fear gauge, hit a 7-year low on Friday of 10.34. Although some observers are predicting single digits for the VIX, others insist that the extreme oversold conditions are ripe for reversion to the mean sometime this summer, perhaps to test resistance at 15.
In any case, short of a major black swan event, I just don’t see anything on the horizon that could seriously derail the bull train in its upward path. I recommend sticking with the trend of rotation from speculative names into quality companies with attractive valuations, solid earnings growth projections, sound earnings quality, and preferably paying a consistent dividend.
To this end, Sabrient just launched its annual mid-year Forward Looking Value portfolio, which is a cap- and sector-diversified group of 35 GARP (Growth At Reasonable Price) stocks, selected based on a combination of our proven quant model (for identifying high-potential candidates) and subsidiary Gradient Analytics’ forensic accounting expertise (to evaluate earnings quality and avoid those stocks at higher risk of a meltdown due to accrual accounting issues).
SPY chart review:
The SPDR S&P 500 Trust (SPY) closed Friday at 195.38. As I said in my previous article two weeks ago, a pullback was inevitable given the extremely overbought technical conditions, and indeed it has pulled back somewhat. Although the current consolidation is allowing the moving averages to catch up with price, the oscillators have been reluctant to cycle back down, particularly MACD, which is still clinging to the roof, so to speak. Instead of testing important support levels (starting with the 20-day simple moving average), price merely formed a bull flag pattern and took another run at the upper line of the long-standing bullish rising channel -- which once again proved impenetrable. To breech this line, I think volume is going to have to increase, which is not likely until we get oscillators like RSI, MACD, and Slow Stochastic to cycle back down to oversold territory. But this does not necessarily mean a large pullback in price. A test of the 50-day SMA (around 190) would be a good start, since it coincides with round-number-resistance-turned-support.
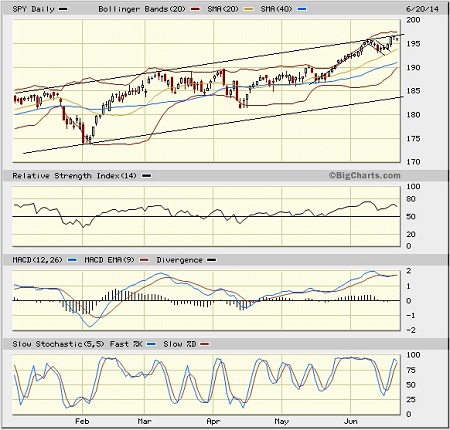
We shall see if bulls can gather sufficient conviction to rally to new highs -- with the 200 level serving as both an enticing bullish target and a potential ambush location by some ravenous bears, who haven’t eaten in quite some time. (Note: Extinction is highly unlikely.)
Latest sector rankings:
Relative sector rankings are based on our proprietary SectorCast model, which builds a composite profile of each equity ETF based on bottom-up aggregate scoring of the constituent stocks. The Outlook Score employs a forward-looking, fundamentals-based multifactor algorithm considering forward valuation, historical and projected earnings growth, the dynamics of Wall Street analysts’ consensus earnings estimates and recent revisions (up or down), quality and sustainability of reported earnings (forensic accounting), and various return ratios. It helps us predict relative performance over the next 1-3 months.
In addition, SectorCast computes a Bull Score and Bear Score for each ETF based on recent price behavior of the constituent stocks on particularly strong and weak market days. High Bull score indicates that stocks within the ETF recently have tended toward relative outperformance when the market is strong, while a high Bear score indicates that stocks within the ETF have tended to hold up relatively well (i.e., safe havens) when the market is weak.
Outlook score is forward-looking while Bull and Bear are backward-looking. As a group, these three scores can be helpful for positioning a portfolio for a given set of anticipated market conditions. Of course, each ETF holds a unique portfolio of stocks and position weights, so the sectors represented will score differently depending upon which set of ETFs is used. We use the iShares that represent the ten major U.S. business sectors: Financial (IYF), Technology (IYW), Industrial (IYJ), Healthcare (IYH), Consumer Goods (IYK), Consumer Services (IYC), Energy (IYE), Basic Materials (IYM), Telecommunications (IYZ), and Utilities (IDU). Whereas the Select Sector SPDRs only contain stocks from the S&P 500, I prefer the iShares for their larger universe and broader diversity. Fidelity also offers a group of sector ETFs with an even larger number of constituents in each.
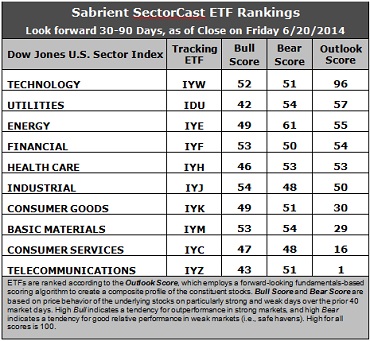
Here are some of my observations on this week’s scores:
1. Technology remains in first place with a strong Outlook score of 96, which is quite impressive especially given its huge (and still-increasing) 39-point gap above second place Utilities at 57. Technology displays generally solid factor scores across the board, with a strong forward long-term growth rate, a reasonable forward P/E, the highest return ratios, and the strongest sentiment among both Wall Street analysts (upward revisions to earnings estimates) and insiders (open market buying). Utilities displays a reasonably low forward P/E and decent sell-side sentiment. Energy has jumped back up into third place, while Financial rounds out the top five. However, it should be noted that Utilities, Energy, Financial, Healthcare, and Industrial are all tightly bunched in 2-6 place, providing little confidence in the middle rankings.
2. Telecommunications stays in the cellar once again with an Outlook score of 1, as it scores among the lowest in every factor in the model. It is joined in the bottom two again this week by Consumer Services/Discretionary with a score of 16, despite its strong forward long-term growth rate.
3. Looking at the Bull scores, Industrial holds the lead with a 54, while Utilities is the laggard with a 42. The top-bottom spread has fallen to only 12 points, reflecting higher sector correlations on particularly strong market days. (Of course, there haven’t been many extremely strong or weak days lately, so the scores are less reliable.) It is generally desirable in a healthy market to see a top-bottom spread of at least 20 points, which indicates that investors have clear preferences in the stocks they want to hold, rather than the all-boats-lifted-in-a-rising-tide mentality that dominated 2013.
4. Looking at the Bear scores, Utilities is no longer the leader, dropping to 54. Instead, Energy has emerged as the clear leader at 61, which means that stocks within this sector have been the preferred safe havens on weak market days (but again, there haven’t been many lately.) Industrial and Consumer Services/Discretionary share the lowest score of 48. The top-bottom spread has fallen to only 13 points, reflecting higher sector correlations on particularly weak market days (of which there have not been many). Again, it is generally desirable in a healthy market to see a top-bottom spread of at least 20 points.
5. Technology displays by far the best all-weather combination of Outlook/Bull/Bear scores. Telecom is by far the worst. Looking at just the Bull/Bear combination, Energy is the clear leader, indicating superior relative performance (on average) in extreme market conditions (whether bullish or bearish). Telecom scores the lowest, indicating general investor avoidance of these sectors during extreme conditions.
6. Overall, I would say that this week’s fundamentals-based Outlook rankings look neutral and non-committal. After Technology at the top, the next five sectors are pretty much bunched in the middle, showing no clear preferences.
These Outlook scores represent the view that the Technology sector is relatively undervalued, while Consumer Services and Telecom may be relatively overvalued based on our 1-3 month forward look. The rest give really little indication right now.
Stock and ETF Ideas:
Our Sector Rotation model, which appropriately weights Outlook, Bull, and Bear scores in accordance with the overall market’s prevailing trend (bullish, neutral, or bearish), suggests holding Technology, Industrial, and Financial (in that order) in the prevailing bullish climate. (Note: In this model, we consider the bias to be bullish from a rules-based standpoint because SPY is still above its 50-day simple moving average while also remaining above its 200-day SMA.)
Other highly-ranked ETFs from the Technology, Industrial, and Financial sectors include First Trust NASDAQ Technology Dividend Index Fund (TDIV), First Trust NASDAQ ABA Community Bank Index Fund (QABA), and SPDR S&P Transportation ETF Trust (XTN).
For an enhanced sector portfolio that enlists top-ranked stocks (instead of ETFs) from within Technology, Industrial, and Financial, some long ideas include Facebook (FB), Seagate Technology (STX), General Dynamics (GD), United Rentals (URI), The PNC Financial Services Group (PNC), and SunTrust Banks (STI). All are highly ranked in the Sabrient Ratings Algorithm and also score within the best two quintiles of our Earnings Quality Rank (EQR), a pure accounting-based risk assessment signal based on the forensic accounting expertise of our subsidiary Gradient Analytics. We have found it quite valuable for helping to avoid performance-offsetting meltdowns in our model portfolios.
However, if you are more comfortable with a neutral bias, the model suggests holding Technology, Utilities, and Energy (in that order). Similarly, if you have a bearish outlook on the market, the model also suggests holding Energy, Technology, and Utilities (in that order).
Disclosure: Author has no positions in stocks or ETFs mentioned.
Disclaimer: This newsletter is published solely for informational purposes and is not to be construed as advice or a recommendation to specific individuals. Individuals should take into account their personal financial circumstances in acting on any rankings or stock selections provided by Sabrient. Sabrient makes no representations that the techniques used in its rankings or selections will result in or guarantee profits in trading. Trading involves risk, including possible loss of principal and other losses, and past performance is no indication of future results.