Sector Detector: Solid 1H2017 bodes well for equity bulls, even with the pullback in large-cap Tech
 By Scott Martindale
President, Sabrient Systems LLC
The major US stock indexes continue to hold near their highs, awaiting the next upside catalyst, supported by persistently low interest rates, record share buybacks, net solid economic reports, and continued organic growth in corporate earnings – in spite of disappointments in the fiscal policy front. The S&P 500 has held solidly above 2,400, the Dow has stayed above 21,000, the Russell 2000 has held 1,400, the Tech-heavy Nasdaq Composite has held 6,000 despite a severe pullback in the market-leading large-cap Tech stocks, and oil has held above the critical $40 mark despite being in a general downtrend since the start of the year.
Recent momentum resides in Transportation, Financial, and small caps, which is a bullish development. In fact, the Dow Jones Transportation Average is setting new highs and is in full-on breakout mode.
In this periodic update, I give my view of the current market environment, offer a technical analysis of the S&P 500 chart, review Sabrient’s weekly fundamentals-based SectorCast rankings of the ten U.S. business sectors, and then offer up some actionable ETF trading ideas. In summary, our sector rankings still look slightly bullish, while the sector rotation model maintains its bullish bias and the climate overall still seems favorable for risk assets like equities – particularly dividend payers, small caps, and GARP stocks (i.e., growth companies among all caps selling at attractive forward PEG ratios). Moreover, July is typically a solid month for stocks, a strong first half typically bodes well for the second half, and the technical picture still looks favorable. Read on...
Market overview:
Looking at performance for 1H2017, the S&P 500 price index was +8.2% (and +9.3% total return, with dividends), Dow +7.7%, Nasdaq Comp +14.1%, Nasdaq 100 +16.1%, and Russell 2000 +4.7%. As for sectors, Technology led the pack at +16.3% despite its recent retrenchment, followed closely by a resurgent Healthcare at +15.4%. At the bottom was Energy at -15.0% (as oil was down -18.7%) and Telecom at -6.4%. The rest of the sectors were essentially tightly bunched around the S&P 500 return. Homebuilders have been notably solid all year, up +21.5% during 1H2017.
The Russell 2000 small cap index appears to be back in gear now, buoyed by its overweight in a resurgent Financial sector, and the S&P 500 large cap index is challenging its highs once again, while volatility remains low. Technicians had been warning of a head-and-shoulders tip pattern in Financials just one month ago, which could have been disastrous for the broader market, but now Financial appears to have made a bullish reversal, at least in part due to the increasingly hawkish tone from the major central banks (implying higher interest rates ahead), along with US banks passing the Fed’s stress tests, which means they likely will be returning capital in the way of share buybacks, redeeming preferred stock, and boosting dividends. This will be important for offsetting the low interest rates that have hit banks’ net interest margins and low volatility that has hurt their trading volume and profits.
The CBOE Market Volatility Index (VIX), aka fear gauge, closed Wednesday at 11.07. The slow but steady melt-up in stocks has led to the lowest sustained volatility in 24 years. This complacency can persist for a long time. However, I want to continue to warn that, as an oscillator, VIX will eventually spike again.
The past few weeks have produced both the worst day of the year for Tech stocks and the best day of the year, and June was the worst month for the Nasdaq Comp since October. Tech and Healthcare provided leadership for the first half of the year, while Energy is still looking for a bottom from which to participate in the broader bull market, as well. Some observers are predicting an imminent major correction given that large-cap Tech has slumped after providing the fuel for the broader market for so long, but instead of a correction what we are getting (at least so far) is a rotation to other market segments. I don’t consider the pullback in Tech to be a warning sign of bad things to come. Rather, it was long overdue from a technical standpoint, which is why it has been so severe. I wouldn’t count out Tech quite yet – the rotation is simply allowing other segments to catch up a bit, which is what we all should want to see in a healthy bull market.
Europe has displayed a welcome resurgence this year that has attracted the attention of investors. The euro is +8.2% YTD versus the USD, while the Mexican peso is +13.7%. Including local currency strengthening versus the dollar, Greece is +38.5% in USD, Poland +32.9%, Mexico +24.7%, Spain +20.9%, Germany +16.2%, and Euro Stoxx 50 +13.2%.
Here at home, ISM Manufacturing index came in quite strong (57.8) on Monday, the first day of 2H2017, which gave a shot in the arm to many lagging segments. Notably, the New Orders component hit 63.5. And just this morning as I go to post this, ISM Nonmanufacturing came in strong at (57.4). The Q2 GDPNow estimate was raised to 3.0% on of July 3, with an update due later today. Friday brings the closely-watched jobs report. On the negative side, the International Monetary Fund (IMF) just lowered its forecast for US economic growth to 2.1%, mainly based on lowered expectations regarding President Trump’s ability to introduce fiscal stimulus. But even without it, year-over-year corporate EPS growth has been robust such that prices can increase further without multiple expansion, and equity investors have taken notice.
Highly-respected and widely-followed portfolio manager and prognosticator Jeffrey Gundlach of DoubleLine Capital has essentially called a bottom in Treasury yields, with an expectation that the 10-year will rise toward 3% this year and hit 6% by the next presidential election in 2020. Part of his reasoning likely accounts for QE programs globally starting to be reined in, thus reducing the profitability of the carry trade. On the other hand, the iShares 20+ Year Treasury Bond ETF (TLT) on June 19 formed a technical “golden cross” of the 50-day simple moving average, moving up through the 200-day, suggesting higher bond prices (and lower yields) ahead, which indeed we got for the ensuing five days, peaking on June 26. Although bond prices have retreated since TLT peaked, it may simply be a normal pullback to retest its 50-day SMA, much like what happened after a previous short-term peak on April 18, with lower yields ahead.
The 10-year Treasury closed June at 2.30%, after going straight up since June 26 when it closed at 2.14%. Still, this is unchanged versus the 2.30% it yielded on Dec 16, 2015 when the first rate hike was enacted. As of Wednesday, the 10-year yielded 2.33% and the 30-year 2.86%. On the short end of the yield curve, the 2-year closed at 1.41% and the 5-year at 1.93%. A popular way to measure the slope of the yield curve slope is the 2-10 spread, and the spread between the 10-year and 2-year is 92 bps (still under the 100-bps threshold), which is a good bit less than the 101 bps on Election Day but up from 78 bps spread that was hit during June. (For comparison, after the Brexit vote last summer, the 2-10 spread fell to 76 bps, later rising to 136 bps after the November election.) Furthermore, the spread between the 30-year and 5-year has fallen precipitously to just 93 bps (down from 111 bps one month ago), as the 30-year has held steady while the 5-year has risen. CME fed funds futures place the odds of the next rate hike coming at the July meeting at just 3%, and 19% in September, but it rises to 58% by December. Notably, the odds of seeing two more rate hikes this year are just 10%.
In any case, long-term Treasury yields remain persistently low from a historical perspective (in spite of the Fed’s latest actions and suggestions), which has been supportive of equity valuations. In last month’s FOMC meeting, the Fed raised interest rates by another quarter point, updated its “dot plot” to suggest another rate hike later this year (and perhaps three more next year), and laid out a detailed plan to start unwinding its massive balance sheet of debt securities later this year. It is evident that the Fed still believes in the Philips Curve, which is based on the idea that low unemployment always leads to inflation, and so it believes it needs to raise interest rates now to head off runaway inflation in the future. But from my standpoint there has been no evidence of inflation anywhere, in spite of inflationary policies of central banks around the world…and now we are starting to see a tightening bias among the major central banks.
In fact, as China has implemented tightening policies, its yield curve has become quite flat, and at times inverted. If this were to happen in the US, it would be a strong signal of impending recession, but lesser liquidity in China makes the situation a little harder to interpret. I wrote in my previous blog post about China’s huge credit bubble – and how its government goes about deflating it – as the biggest risk to continued global recovery. Since the Financial Crisis, the world has added over $50 trillion of new debt to stabilize markets and fuel growth, with China boosting its ratio of total debt to GDP far more than any other developing country, now standing at about 250% (and climbing). Indeed, at least some of the strength in stocks at times can be correlated with overnight liquidity injections by the People’s Bank of China to keep its balancing act going. Its latest injection last week was the largest since January, lifting the Shanghai Composite Index back above its 50-day moving average. It also seemed to correlate with an improvement in market breadth in US stocks.
I remain bullish on dividend payers given the persistently low interest rate environment, as yield-hungry investors seek alternatives to low-yielding fixed income. I also remain bullish on small caps, as well as on GARP (growth at a reasonable price) investing in general – which of course happens to be Sabrient’s primary focus. We believe GARP is what investing is all about, as opposed to momentum trading, deep value bottom-fishing, or aggressive-growth speculation – buying a fundamentally solid company with strong market position and growing earnings streams at an attractive price – and the market typically rewards good fundamentals over time. We have witnessed improving market internals, with greater breadth, falling sector correlations, and rising performance dispersion, which is a favorable environment for fundamentals-based investing. Small caps in particular can thrive in a pro-growth environment. So, if some of the President’s proposed fiscal policies can come to fruition, including tax cuts, regulatory rollbacks, infrastructure spending, and entitlement reform (including overhauling our rapidly imploding healthcare system), small caps stand to benefit the most.
To be sure, scaling back on entitlements and fixing our dysfunctional healthcare system will be no easy task. Whether there is a push for low-cost, single-payer healthcare for all, or minimum wage hikes, or the massive unfunded public and private pension liabilities that are already coming to roost, the list is long for all the things the Federal government might be expected to pay for. The siren song of entitlements always sounds so good to the well-meaning, but overpromising and overreaching always finds a way to come back to haunt us with negative consequences.
Keep in mind the observation attributed to Scottish judge and historian Alexander Tytler, circa 1800: “A democracy will continue to exist up until the time that voters discover that they can vote themselves generous gifts from the public treasury. From that moment on, the majority always votes for the candidates who promise the most benefits from the public treasury, with the result that every democracy will finally collapse due to loose fiscal policy.” Also, Alexis de Tocqueville is credited with quite a number of insights, circa 1850, including such gems as, “The American Republic will endure until the day Congress discovers that it can bribe the public with the public's money,” and “Democracy and socialism have nothing in common but one word: equality. But notice the difference: while democracy seeks equality in liberty, socialism seeks equality in restraint and servitude.”
Canada had the fortitude in the early 1990’s to institute austerity and entitlement reform, with good success. But it is usually considered political suicide in this country to try to take away a benefit once it has been bestowed upon a large group of citizens. Austerity is not in modern America’s DNA. But a US federal government shutdown might well be in the cards if an indulgent Congress insists upon raising the debt ceiling without significant entitlement reform, as the money will run out by October. In the 1990’s, President Clinton was able to introduce meaningful welfare reform, but it has been said that only a Democratic president can get away with any sort of entitlement reform without major pushback.
When President Trump was elected, my hope at the time was that his outsider status would allow him to more easily reach out to both parties for cooperation, without partisan ideology. But the reality has been quite the opposite, as both parties have resisted him vigorously. Although many had hoped that he would suddenly turn into a statesman worthy of the office, that’s not who he is or will ever be. But no matter how you feel about him, he is our duly-elected president. The extreme political dysfunction is weakening our country and hurting everyone, but especially those most in need. It seems to me that whether or not they voted for him, most of Middle America now simply wants to move forward and support efforts to stomp out terrorism, improve healthcare and education, and enact fiscal stimulus – aiming for job creation, rising wages, control of our porous borders, and infrastructure investment (including in our inner cities).
SPY chart review:
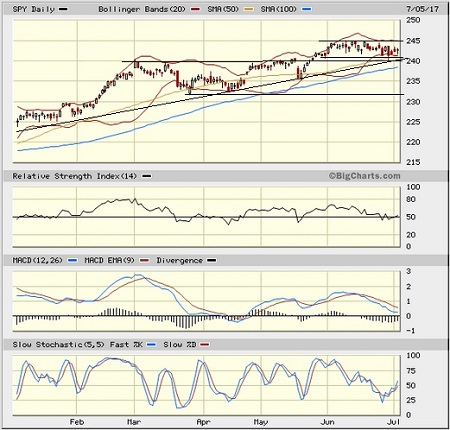
The SPDR S&P 500 ETF (SPY) closed Wednesday at 242.74. After breaking through tough psychological resistance at 240 (corresponding to 2,400 on the S&P 500 index) in late May, it appears to be stuck in a month-long sideways channel, awaiting a catalyst for the next breakout to new highs. Some chartists think they see a bearish head-and-shoulders formation, but to me it’s simply random movement within a neutral sideways channel. Oscillators RSI, MACD, and Slow Stochastic are all in neutral territory but pointing up in a bullish manner. The 50-day simple moving average has been providing additional support, while Bollinger Bands have pinched back together in a way that suggests an imminent move, one direction or the other. My expectation is for a move to the upside during this typically bullish month of July. Support levels include the 20-day SMA at the current price, and the convergence of the 50-day SMA with breakout resistance-turned-support and the rising long-term uptrend line at 240, followed by the 100-day SMA near 238, a minor low at 235, a prior low at 232, and the critical 200-day SMA (around 228). Overall, the technical picture continues to look promising, although I remain concerned about the amount of time since the last meaningful correction.
Latest sector rankings:
Relative sector rankings are based on our proprietary SectorCast model, which builds a composite profile of each of over 600 equity ETFs based on bottom-up aggregate scoring of the constituent stocks. The Outlook Score employs a forward-looking, fundamentals-based multifactor algorithm considering forward valuation, historical and projected earnings growth, the dynamics of Wall Street analysts’ consensus earnings estimates and recent revisions (up or down), quality and sustainability of reported earnings, and various return ratios. It helps us predict relative performance over the next 1-3 months.
In addition, SectorCast computes a Bull Score and Bear Score for each ETF based on recent price behavior of the constituent stocks on particularly strong and weak market days. High Bull score indicates that stocks within the ETF recently have tended toward relative outperformance when the market is strong, while a high Bear score indicates that stocks within the ETF have tended to hold up relatively well (i.e., safe havens) when the market is weak.
Outlook score is forward-looking while Bull and Bear are backward-looking. As a group, these three scores can be helpful for positioning a portfolio for a given set of anticipated market conditions. Of course, each ETF holds a unique portfolio of stocks and position weights, so the sectors represented will score differently depending upon which set of ETFs is used. We use the iShares that represent the ten major U.S. business sectors: Financial (IYF), Technology (IYW), Industrial (IYJ), Healthcare (IYH), Consumer Goods (IYK), Consumer Services (IYC), Energy (IYE), Basic Materials (IYM), Telecommunications (IYZ), and Utilities (IDU). Whereas the Select Sector SPDRs only contain stocks from the S&P 500, I prefer the iShares for their larger universe and broader diversity.
Here are some of my observations on this week’s scores:
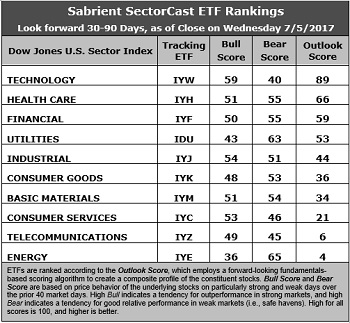
1. Technology yet again stands alone at the top of the pack with an Outlook score of 89. In aggregate, stocks within Technology display the best Wall Street sell-side analyst sentiment (i.e., net positive revisions to EPS estimates), the best insider sentiment (net open market buying), the highest return ratios, a mediocre forward P/E of about 17.2x (down from 18.3x last month, after the sector’s price correction), a strong forward long-term EPS year-over-year growth rate of 14.3%, and a low forward PEG of 1.20 (ratio of forward P/E to forward EPS growth rate). Healthcare has risen to the second spot due to its solid Wall Street sentiment, solid return ratios, the lowest forward P/E of 17.1x (up from last month’s 16.3x), and an attractive forward PEG of 1.69. Rounding out the top five are Financial (forward P/E of 17.5x and forward PEG of 1.67), Utilities, and Industrial.
2. Telecom and Energy remain in the bottom two with Outlook scores of 6 and 4, respectively. Telecom displays weak scores across the board, including the weakest analyst sentiment (i.e., net negative earnings revisions), as well as a high forward P/E of 28.1x and the second highest (next to Utilities) forward PEG of 2.84. Energy has generally poor factor scores across the board, including the worst return ratios and a high forward P/E of 29.2x (up from 26.8x last month), although it notably boasts the highest year-over-year forward EPS growth rate (28%) on weak comps and the lowest forward PEG of only 1.05.
3. Looking at the Bull scores, Technology boasts the top score of 59, as it has displayed relative strength on strong market days, while Energy is the lowest at 36. The top-bottom spread is 23 points, which reflects low sector correlations on strong market days, which is favorable for stock picking. It is desirable in a healthy market to see low correlations reflected in a top-bottom spread of at least 20 points, which indicates that investors have clear preferences in the market segments and stocks they want to hold (rather than broad risk-on behavior).
4. Looking at the Bear scores, we find Energy at the top with a score of 65, followed by Utilities at 63, which means that stocks within these sectors have been the preferred safe havens lately on weak market days. The retrenchment in Technology has given it (at least for the moment) the lowest score at 40, as investors have fled during market weakness. The top-bottom spread is 25 points, which reflects quite low sector correlations on weak market days. Ideally, certain sectors will hold up relatively well while others are selling off (rather than broad risk-off behavior), so it is desirable in a healthy market to see low correlations reflected in a top-bottom spread of at least 20 points.
5. Technology displays the best all-around combination of Outlook/Bull/Bear scores, while Telecom is the worst. Looking at just the Bull/Bear combination, Healthcare and Utilities share the best, followed closely by Financial, Industrial, and Materials, indicating superior relative performance (on average) in extreme market conditions (whether bullish or bearish), while Telecom by far scores the worst, as investors have generally avoided the sector recently.
6. This week’s fundamentals-based Outlook rankings still reflect a slightly bullish bias to me, given that four of the top five sectors are economically-sensitive or all-weather (Technology, Healthcare, Financial, and Industrial). Keep in mind, the Outlook Rank does not include timing, momentum, or relative strength factors, but rather reflects the consensus fundamental expectations at a given point in time for individual stocks, aggregated by sector.
ETF Trading Ideas:
Our Sector Rotation model, which appropriately weights Outlook, Bull, and Bear scores in accordance with the overall market’s prevailing trend (bullish, neutral, or defensive), displays a bullish bias and suggests holding Technology (IYW), Healthcare (IYH), and Industrial (IYJ), in that order. (Note: In this model, we consider the bias to be bullish from a rules-based trend-following standpoint when SPY is above both its 50-day and 200-day simple moving averages.)
Besides iShares’ IYW, IYH, and IYJ, other highly-ranked ETFs in our SectorCast model (which scores over 600 US-listed equity ETFs) from the Technology, Healthcare, Industrial sectors include First Trust NASDAQ-100 Tech Sector Index Fund (QTEC), PowerShares Dynamic Pharmaceuticals Portfolio (PJP), and US Global Jets ETF (JETS).
If you prefer a neutral bias, the Sector Rotation model suggests holding Technology, Healthcare, and Financial, in that order. On the other hand, if you are more comfortable with a defensive stance on the market, the model suggests holding Utilities, Healthcare, and Financial, in that order.
By the way, an assortment of other unique ETFs that happen to score well in our latest rankings include iShares MSCI Israel Capped ETF (EIS), Global X SuperDividend REIT ETF (SRET), iShares US Home Construction ETF (ITB), AlphaMark Actively Managed Small Cap ETF (SMCP), John Hancock Multifactor Technology ETF (JHMT), ALPS Buzz US Sentiment Leaders ETF (BUZ), First Trust NASDAQ ABA Community Bank Index Fund (QABA), SPDR S&P Transportation ETF Trust (XTN), and Direxion iBillionaire Index ETF (IBLN).
IMPORTANT NOTE: I post this information periodically as a free look inside some of our institutional research and as a source of some trading ideas for your own further investigation. It is not intended to be traded directly as a rules-based strategy in a real money portfolio. I am simply showing what a sector rotation model might suggest if a given portfolio was due for a rebalance, and I may or may not update the information on a regular schedule. There are many ways for a client to trade such a strategy, including monthly or quarterly rebalancing, perhaps with interim adjustments to the bullish/neutral/defensive bias when warranted, but not necessarily on the days that I happen to post this article. The enhanced strategy seeks higher returns by employing individual stocks (or stock options) that are also highly ranked, but this introduces greater risks and volatility. I do not track performance of the ideas mentioned here as a managed portfolio.
Disclosure: The author has no positions in stocks or ETFs mentioned.
Disclaimer: This newsletter is published solely for informational purposes and is not to be construed as advice or a recommendation to specific individuals. Individuals should take into account their personal financial circumstances in acting on any opinions, commentary, rankings, or stock selections provided by Sabrient Systems or its wholly-owned subsidiary Gradient Analytics. Sabrient makes no representations that the techniques used in its rankings or analysis will result in or guarantee profits in trading. Trading involves risk, including possible loss of principal and other losses, and past performance is no indication of future results.