Sector Detector: Abrupt rotation underway in response to surprise Trump victory
By Scott Martindale
President, Sabrient Systems LLC
Proving to be a better magician than either David Blaine or Criss Angel, Donald Trump pulled a giant rabbit out his hat with his improbable victory to become President-elect of the United States. But even those few prescient souls who predicted a Trump victory couldn’t foresee the immediate market rally. Everyone thought that the market preferred (and had priced in) a Clinton victory. But they were wrong. Small caps in particular have been on a tear.
I said in my previous article on 10/31 that I expected the Russell 2000 small caps to resume their outperformance once the election results had a chance to shake out. Going forward, I expect a greater focus on positive fundamentals to permeate investors’ psyche, leading once again to healthier market breadth, diverse leadership, and higher prices. I expect Trump’s policies, along with a mostly cooperative Republican-controlled Congress, to be mildly inflationary and favorable for business investment and earnings growth, with certain market segments that had been targeted by the Democrats now set to strengthen. This already has become a positive for Sabrient’s fundamentals-based portfolios.
In this periodic update, I give my view of the current market environment, offer a technical analysis of the S&P 500 chart, review our weekly fundamentals-based SectorCast rankings of the ten U.S. business sectors, and then offer up some actionable ETF trading ideas. Overall, our sector rankings look neutral as adjustments to sell-side forward estimates based on the election are only starting to trickle into our model (even though investors haven’t waited around for them), but the sector rotation model now suggests a bullish stance. Read on....
Market overview:
Many commentators are comparing the election of Trump to the Brexit vote. Certainly from the standpoint of populist undercurrent and defying the polls, this is true. But one difference I see is that many who voted for Brexit in the heat of the moment seemed to regret their decision after the fact, while Trump supporters have no such regrets. On the other hand, many of those on the losing side are not going down quietly. From the massive protests in the streets to the continued uncivil discourse among ostensibly educated and open-minded individuals, it appears very much to me to be a reflection of our cable/social-media sound-bite culture.
Nevertheless, I think most people are willing to give the new president-elect a chance. Even President Obama commented after their meeting that Trump seems to be more a pragmatist than an ideologue, which is encouraging to him. After all, we still have our Constitution and its system of checks and balances. And who knows, his outsider status and almost childlike can-do attitude about fixing our many problems might actually bring about some positive changes long sought by struggling segments of our society, including our violent and decaying inner cities, out-of-work factory workers, new immigrants, debt-laden college grads, and the over-burdened middle class.
As for the market impact, after a brief bout of risk-off behavior and narrow market performance that inordinately hurt small caps in the weeks leading into election day, and despite expectations of a severe market selloff in the event of a Trump victory, stocks have come roaring back – led in a major way by small caps. The Russell 2000 is up +9.0% from the close on election day through Tuesday (5 days) – and is now at an all-time high. Meanwhile, the S&P 500 large cap index is up only +1.9%. Moreover, Russell 2000 is +15% YTD, and an impressive +37% since the lows on February 11 (versus +20% for the S&P 500). Small caps are suddenly the place to be. They are expected to be the primary beneficiaries of things like lower tax rates, lower health insurance premiums, deregulation, and a strong dollar.
Furthermore, there has been an overnight transformation in investor preferences. Rarely has such a sudden sector rotation occurred amid an already-bullish trend. Since Tuesday’s market close on election day, Financial is far-and-away the biggest winner, followed by Industrial, Healthcare, Basic Materials, and Consumer Discretionary. But its notable that 300 NYSE stocks hit 52-week highs on Monday, while another 300 hit 52-week lows. All boats are not being lifted, which I think is a good thing for stock pickers. Technology, which had been the clear leader during most of the second half of the year, and Utilities, which was the clear leader during the first half, have both taken a backseat for the moment as these other sectors play catch-up. Year to date, Energy at +16%, Industrial +15%, and Basic Materials +14% have become the market leaders. And if you look at performance since the market bottomed on February 11, we find Financial at +31%, Energy +30%, Materials +28%, Industrial +27%, and Technology +25%.
Financial’s sudden surge is due to optimism about the big banks on the assumption that regulations like the Dodd-Frank Act and the new DOL fiduciary rule will be overturned, as well as the expectation for rising inflation, higher interest rates, and a steepening yield curve making it more profitable for banks to lend. Industrial is enjoying optimism about infrastructure and defense spending, as well as low oil prices (due to Trump’s support of the Energy sector) – and the important transportation segment within Industrial is suddenly flourishing, as well. Healthcare is mostly buoyed by relief in the pharmaceuticals segment that Clinton had been targeting so aggressively for its pricing practices. And overall, the idea of broad deregulation, lower tax rates (individual and corporate), and a tax holiday (for bringing home corporate cash held overseas) are seen as bullish in the near term for the jobs, the economy, and risk assets (like stocks). On the other hand, I would be remiss not to insert a cautionary note about potential risks associated with protectionist interventions into our free trade agreements.
I should mention that this sudden change in market conditions has given a marked boost to Sabrient’s portfolios, which are based on our numbers-driven, fundamentals-based, forward-looking GARP (growth at reasonable price) model. For one thing, the shift from a news-driven cloud of uncertainty and risk-off behavior to fundamentals-driven trading and valuations has been advantageous, and secondly, the neglected market segments that investors have shunned despite attractive forward valuations (like biotech, pharma, airlines) have suddenly come alive.
As I have been saying, if it weren’t for the uncertainty of the election, I think US stocks would have already been up double digits YTD across all major indexes. Corporate earnings have been firming up after several quarters of contraction, and Wall Street’s consensus now points to robust growth of over +6% for the S&P 500 in 2017 – and led by revenue growth, by the way, which is critical. Also, the retail sales report for October just came in much stronger than expected.
Most expert commentators and pollsters completely missed predicting this election, just as they did the Brexit vote. And just like Brexit, the recovery in stocks was seemingly as swift as the selloff – on huge volume – while the bond market has sold off on the expectation of rising inflation. But there were a few people (other than the commentators on Fox News) who saw the writing on the wall regarding a Trump victory. Notably, one of them was DoubleLine Capital’s Jeffery Gundlach.
Despite the knee-jerk selloff in bonds, Gundlach thinks the surge in yields is almost over. The 10-year Treasury closed Tuesday at 2.24%, but Gundlach thinks it won’t rise beyond 2.35% this year – a level he thinks would bring back the buyers. As bond holders moved to cash, yields have been climbing steadily since bottoming in July. The 30-year at 2.97%, while on the short end the 2-year is 0.99% and the 5-year is 1.67%. The spread between the 10-year and 2-year has steepened to 125 bps, while the spread between the 30-year and 5-year remains at 130 bps. Notably, Gundlach, who implored the Fed last year not to raise rates, now believes it should raise at the December 14 meeting. CME fed funds futures place the odds of a rate hike at 91% for the December FOMC meeting, but the Fed itself is telegraphing only another one or two hikes during 2017. In fact, the odds of a further hike don’t eclipse 50% until July.
The CBOE Market Volatility Index (VIX), aka fear gauge, closed at 13.37, which is back below the 15 threshold (between complacency and fear) after spiking to as high as 23 in advance of the election. It is interesting to note that the VIX fell below 15 immediately on the day after the election.
SPY chart review:
The SPY closed Tuesday at 218.28. During most of September-October, SPY had found itself stuck in a tight trading range between 212 and 217, awaiting a solid catalyst. In fact, during the second half of October, the noose tightened even further to between 212 and 215. Then, as election day approached, risk-off behavior broke the bottom support line before price found support at the 200-day simple moving average, near 208, on the Friday before election day. Then Monday-Tuesday brought a recovery into the election, as Clinton seemed like a sure bet. Wednesday brought huge volume and volatility starting in the middle of the night with S&P futures and Asian stocks, but the recovery was incredible. Former resistance at 215 fell easily, then 217 was breached, and now the bearish gap down from 218 on September 8 has been filled. Oscillators like RSI, MACD, and Slow Stochastic indicate that price could continue higher yet and challenge the highs near 220. But perhaps we will see a little consolidation at this point, perhaps into a bull flag continuation pattern. If you look at a similar chart of the small caps, they are in extreme overbought territory. I will reiterate what I have been saying: Overall, I continue to be optimistic about the technical picture, particularly given the healthy broadening and extreme outperformance of the small caps.

Latest sector rankings:
Relative sector rankings are based on our proprietary SectorCast model, which builds a composite profile of each of over 600 equity ETFs based on bottom-up aggregate scoring of the constituent stocks. The Outlook Score employs a forward-looking, fundamentals-based multifactor algorithm considering forward valuation, historical and projected earnings growth, the dynamics of Wall Street analysts’ consensus earnings estimates and recent revisions (up or down), quality and sustainability of reported earnings (forensic accounting), and various return ratios. It helps us predict relative performance over the next 1-3 months.
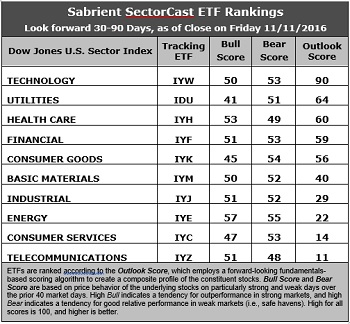
In addition, SectorCast computes a Bull Score and Bear Score for each ETF based on recent price behavior of the constituent stocks on particularly strong and weak market days. High Bull score indicates that stocks within the ETF recently have tended toward relative outperformance when the market is strong, while a high Bear score indicates that stocks within the ETF have tended to hold up relatively well (i.e., safe havens) when the market is weak.
Outlook score is forward-looking while Bull and Bear are backward-looking. As a group, these three scores can be helpful for positioning a portfolio for a given set of anticipated market conditions. Of course, each ETF holds a unique portfolio of stocks and position weights, so the sectors represented will score differently depending upon which set of ETFs is used. We use the iShares that represent the ten major U.S. business sectors: Financial (IYF), Technology (IYW), Industrial (IYJ), Healthcare (IYH), Consumer Goods (IYK), Consumer Services (IYC), Energy (IYE), Basic Materials (IYM), Telecommunications (IYZ), and Utilities (IDU). Whereas the Select Sector SPDRs only contain stocks from the S&P 500, I prefer the iShares for their larger universe and broader diversity.
Here are some of my observations on this week’s scores:
1. Adjustments to sell-side forward estimates based on the election are only starting to trickle into our rankings, even though investors haven’t waited around for them. For now, Technology retains the top spot with an Outlook score of 90. In aggregate, stocks within the sector display solid Wall Street sell-side analyst sentiment (net positive revisions to earnings estimates), strong return ratios, a reasonable forward P/E of about 16.2x, the highest forward long-term EPS growth rate of 14.4%/yr, and the lowest forward PEG of 1.1 (ratio of forward P/E to forward EPS growth rate). Utilities for the moment rank second with an Outlook score of 64, although it is tightly grouped with Healthcare (60) and Financial (59). However, none of the factor subscores for Utilities stands out other than a reasonable forward P/E of 16.4x, while Healthcare displays the lowest forward P/E of 15.2x and the second lowest forward PEG of 1.4, and Financial has solid Wall Street sentiment and a reasonable forward P/E of 16.3x. Notably, Energy has been gaining favor with the analyst community, although its forward P/E (30.2x) and forward PEG (2.6) have ballooned during the latest rally.
2. Consumer Services (Discretionary/Cyclical) and Telecom take the bottom two with Outlook scores of 14 and 11. Telecom displays weak analyst sentiment (net negative earnings revisions) and a relatively high forward P/E (24.6x) and forward PEG (3.2), while Consumer Services (Discretionary/Cyclical) has an elevated forward P/E (19.2x) and weak sentiment among both analysts and insiders (net selling).
3. Looking at the Bull scores, Energy has the top score of 57 as it displays relative strength on strong market days, while Utilities is the lowest at 41. The top-bottom spread is 16 points, which reflects modest sector correlations on strong market days, which is mostly favorable for stock picking. It is desirable in a healthy market to see low correlations reflected in a top-bottom spread of at least 20 points, which indicates that investors have clear preferences in the stocks they want to hold (rather than broad risk-on behavior).
4. Looking at the Bear scores, we find Energy with the top score of 55, followed closely by Technology, Financial, and Consumer Services (Discretionary/Cyclical), which means that stocks within these sectors have been the preferred safe havens lately on weak market days. Typically-defensive sector Telecom is the surprising low scorer at 48, followed by Healthcare, as investors have fled during market weakness. The top-bottom spread is down to only 7 points, however, which reflects high sector correlations on weak market days. Ideally, certain sectors will hold up relatively well while others are selling off (rather than broad risk-off behavior), so it is desirable in a healthy market to see low correlations reflected in a top-bottom spread of at least 20 points.
5. Technology displays the best all-around combination of Outlook/Bull/Bear scores, while Telecom is the worst. However, looking at just the Bull/Bear combination, Energy is by far the best, indicating superior relative performance (on average) in extreme market conditions (whether bullish or bearish), while Utilities is by far the worst.
6. This week’s fundamentals-based Outlook rankings look neutral to me, given that both defensive and economically-sensitive sectors populate the top of the rankings. However, the rankings simply cannot adjust immediately to such an abrupt change in investor expectations regarding EPS revisions for all the individual companies, but I would expect them to begin to rotate back to the bullish tilt that they previously displayed as the underlying data evolves. Keep in mind, the Outlook Rank does not include timing, momentum, or relative strength factors, but rather reflects the consensus fundamental expectations at a given point in time for individual stocks, aggregated by sector.
ETF Trading Ideas:
Our Sector Rotation model, which appropriately weights Outlook, Bull, and Bear scores in accordance with the overall market’s prevailing trend (bullish, neutral, or defensive), now displays a bullish bias and suggests holding Technology (IYW), Healthcare (IYH), and Energy (IYE), in that order. (Note: In this model, we consider the bias to be bullish from a rules-based trend-following standpoint when SPY is above both its 50-day and 200-day simple moving averages on the rebalance day.)
Besides iShares’ IYW, IYH, and IYE, other highly-ranked ETFs in our SectorCast model (which scores over 600 US-listed equity ETFs) from the Technology, Healthcare, and Energy sectors include iShares North American Tech-Multimedia Networking ETF (IGN), VanEck Vectors Biotech ETF (BBH), and PowerShares WilderHIll Progressive Energy Portfolio (PUW).
An assortment of other ETFs that are scoring well in our rankings include VanEck Vectors Mortgage REIT Income ETF (MORT), First Trust NASDAQ Rising Dividend Achievers ETF (RDVY), US Market Rotation Strategy ETF (HUSE), First Trust Technology AlphaDEX Fund (FXL), and PowerShares KBW Bank Portfolio (KBWB).
However, if you prefer a neutral bias, the Sector Rotation model suggests holding Technology, Utilities, and Healthcare, in that order. On the other hand, if you are more comfortable with a defensive stance on the market, the model suggests holding Technology, Healthcare, and Financial, in that order, which is identical to the neutral allocation.
IMPORTANT NOTE: I post this information periodically as a free look inside some of our institutional research and as a source of some trading ideas for your own further investigation. It is not intended to be traded directly as a rules-based strategy in a real money portfolio. I am simply showing what a sector rotation model might suggest if a given portfolio was due for a rebalance, and I may or may not update the information on a regular schedule. There are many ways for a client to trade such a strategy, including monthly or quarterly rebalancing, perhaps with interim adjustments to the bullish/neutral/defensive bias when warranted -- but not necessarily on the days that I happen to post this article. The enhanced strategy seeks higher returns by employing individual stocks (or stock options) that are also highly ranked, but this introduces greater risks and volatility. I do not track performance of the ideas mentioned here as a managed portfolio.
Disclosure: The author has no positions in stocks or ETFs mentioned.
Disclaimer: This newsletter is published solely for informational purposes and is not to be construed as advice or a recommendation to specific individuals. Individuals should take into account their personal financial circumstances in acting on any rankings or stock selections provided by Sabrient. Sabrient makes no representations that the techniques used in its rankings or selections will result in or guarantee profits in trading. Trading involves risk, including possible loss of principal and other losses, and past performance is no indication of future results.