Sector Detector: Bulls close out another solid year with expectation of further gains but higher volatility in 2015
 Another solid year for U.S. equities came to a close. But it’s not like everyone is jumping up and down with enthusiasm, which is a good thing. With plenty of bogeymen in the closet and under the bed, there is little in the way of irrational exuberance. Although some commentators noted that 2014 finished up much the same as 2013, there was really quite a bit of difference between the past two years, primarily in the way of lower correlations in 2014 as opposed to the all-boats-lifted environment of 2013. Looking ahead, 2015 looks promising for further gains, but not without bouts of volatility. In fact, it might look a lot like 2014.
In this weekly update, I give my view of the current market environment, offer a technical analysis of the S&P 500 chart, review our weekly fundamentals-based SectorCast rankings of the ten U.S. business sectors, and then offer up some actionable trading ideas, including a sector rotation strategy using ETFs and an enhanced version using top-ranked stocks from the top-ranked sectors.
Market overview:
As we see the close to yet another successful year for the U.S. stock market, we can look back on 2014 and recall the many bogeymen that caused investor consternation. There was the end of the Fed’s tapering of QE3 (although maturing securities are still being reinvested rather than retired). There was the huge collapse in oil prices (and still falling today), causing major disruptions in global markets. Then of course we had the slowdowns in China, Japan, and Europe -- and Greece is again in crisis mode. There was major turmoil in Russia and the Ukraine. We witnessed the sudden emergence of ISIS as a terrorist organization with its own army (and social media savvy). There was the fear of Ebola spreading into a global epidemic. And here at home, we had the uncertainty surrounding implementation of Obamacare, as well as the mid-term elections putting the GOP in control of both houses of congress. Did I miss anything?
The Dow Jones Industrials blue chips, the S&P 500 large cap index, and the NASDAQ 100 ended the year up about +7.5%, +11.3%, and +17.4% respectively, while the S&P MidCap 400 gained about +8% and the Russell 2000 small cap index gained only +3.7%. The Russell 2000 made an attempt to break out above strong resistance at 1200, but ultimately failed. NASDAQ Composite at one point looked ready to challenge the 5,000 level for the first time in nearly 15 years, but couldn’t gather enough bullish conviction before the year ended. The MSCI emerging markets index finished down -6%. Defensive strategies like low volatility and dividend yield outperformed in a general flight to quality.
Still, with leadership from large caps and defensive strategies, total capital in U.S. ETFs surpassed the $2 trillion mark. In addition, fixed income indexes rose in 2014 as long-dated yields continued to decline despite the Fed’s tapering of its quant easing (bond buying).
Among the ten U.S. business sectors, the top performers for the year were Utilities (+25%), Healthcare (+24%), and Technology (+19%), and all spent a lot of time during the year near the top of Sabrient’s forward-looking fundamentals-based SectorCast rankings. The worst performer by far was Energy, which is not surprising given the 50% haircut in oil prices. Also showing lackluster performance were Telecom and Basic Materials, which both spent a lot of time at the bottom of our sector rankings. Consumer Discretionary and Financial both showed good late year outperformance to make up some ground.
Economic reports continue to impress, at least domestically. Redbook weekly retail sales report showed a robust +5.4% year-over-year increase. Consumer confidence rose from 88.7 to 92.6, which is quite strong. Also, U.S. manufacturing activity continues to expand despite the struggles of overseas economies.
Leading economic indicators are strong, job growth is the strongest since the ‘90s, and corporate profits sit at all-time highs. Strong GDP growth is expected to continue into 2015 and beyond, which should propel equities to new heights, although the future for long-term bond prices is not as clear. Although the near-term will likely provide further flattening in the yield curve, eventually economic health will demand higher long-term rates and a steeper yield curve.
The IPO market last year was the busiest since 2000, and the Healthcare sector was buoyed by FDA approval of the most new drugs in 18 years, including many high-priced drugs that address rare conditions and orphan diseases.
For several years, oil production has been climbing in the U.S. and Canada, and there has been a lot of recovery among oil fields in Iraq and elsewhere. In addition, rising demand in China and India and other developing nations have kept supply/demand in balance. But North American production kept climbing far beyond expert predictions, while slowing growth and/or recession in China, Japan, and Europe along with rising fuel efficiencies in the U.S. led to reduced demand. With traders and speculators no longer willing to keep the price artificially high due to geopolitical concerns, oil prices plummeted quickly, plunging much further than anyone thought possible. Sell-side analysts covering the Energy sector began slashing earnings projections once it became clear that lower prices were likely here to stay.
But asset classes tend to overshoot in both directions, and I believe we will see oil stabilize soon. Energy stocks highly dependent on oil prices might be dead money for the foreseeable future, but it is not a bad idea to begin accumulating them in long-term accounts, particularly those stocks paying a reasonable dividend with hedges in place. And the toll-taker type companies with locked-in pricing (including pipeline MLPs), which were the proverbial babies thrown out with the bathwater, might be the best long-term accumulation targets of all. Although oil prices may decline further in the near term, they likely will return to a more normal trading range. And in any case, the overall impact is positive for virtually all other segments of the economy.
It is said that bull markets don’t die of old age but rather from euphoria (in which valuations get totally out of whack) or when the economy falls into recession. And there seems to be nothing that can prevent a strong 2015. However, there is no denying the cautious and often defensive behavior of investors -- as the little voice in the back of their heads tells them that something just doesn’t feel right about it all. Bu this is healthy skepticism that is helping to prevent an unhealthy euphoria (a.k.a., irrational exuberance).
The CBOE Market Volatility Index (VIX), a.k.a. fear gauge, closed Friday at 17.79, which is still well above the line of complacency at 15, but below the important 20 threshold that suggests real fear. It is indicating heightened volatility and some lingering investor worry going into the New Year. The 10-year U.S. Treasury yield closed at 2.11%, which is still quite low, indicating a continued flight to quality among global investors in spite of the Fed’s desire for a normalization of interest rates (i.e., higher fed funds rate and a steeper yield curve). Its 52-week range is 1.86-3.06. In addition, the US dollar continues to strengthen while the euro sinks to its lowest level since 2006 due to speculation that the ECB will soon begin a quantitative easing program by purchasing sovereign debt.
Any increase in interest rates here at home will serve to attract even more global capital into U.S. Treasuries, which keeps lending rates down here at home, helping boost the housing market, but it also further strengthens the dollar, which makes it harder for those countries with the weaker currencies to pay down their debt. While many are expecting the Fed to begin raising rates nominally sometime in the middle of 2015, the FOMC has taken a more dovish turn with its latest voter rotation, so some observers actually are speculating that we won’t see a boost in rates until 2016. I think this scenario is entirely possible. But in any case, rates will not rise rapidly.
Of course, persistently low bond yields also serve to support higher P/E multiples in equities. The forward P/E on the S&P 500 is only about 16, and the spread between the S&P 500 earnings yield and the 10-year Treasury yield is about 4% versus the historical norm of about 3%. Also, robust stock buybacks are likely to continue for a while at the prevailing ultra-low borrowing rates, which lowers the denominator in EPS and offsets new stock offerings and IPOs that typically serve to increase the denominator and dilute the overall profit pool. So, the market’s forward valuation is still quite reasonable -- particularly as corporate earnings continue to grow.
And with Q3 earnings season behind us and Q4 reports starting soon, sell-side analysts are anticipating EPS of $29.92 for the S&P 500 companies, which is an increase of +5.5% from Q4 2013, and total 2014 EPS growth is expected to come in at +7.5%, compared with +4.5% for 2013. This would be the best earnings growth since 2011’s +14.3%. Companies that generate real rising sales and earnings should outperform the speculative names, particularly in a global economy characterized by subdued demand and pricing pressures.
Yes, the U.S. is the main driver of global growth, while Europe slogs along, Japan slides into recession, and the BRIC countries appear to be destined for their slowest pace since emerging from the Great Recession. This performance gap between the U.S. and the rest of the world shows just how insulated we really are. Exports are just 14% of output, and big exporting countries like China, Germany, and Japan will be depending on us to help ignite their economies.
The New Year appears to be set to continue the path set in 2014. The end of QE3 is allowing asset classes to perform according to their fundamentals rather than rewarding highly-correlated risk-on/risk-off behavior. Lower equity correlations, higher volatility, and a modest increase in U.S. equity prices are likely in 2015. As a result, some market experts are suggesting greater exposure to long/short, long-hedged, and market neutral equity strategies. One choice in this regard is a recently-launched actively-managed ETF -- the First Trust Long Short ETF (FTLS), which employs as an input factor Sabrient’s Earnings Quality Rank (a.k.a., EQR), a pure accounting-based risk assessment signal based on the forensic accounting expertise of our subsidiary Gradient Analytics. We have found EQR quite valuable both for identifying short candidates and for helping to avoid higher-risk long positions.
As I predicted one year ago, 2014 ended up displaying a general flight to quality among investors in which the best companies with the most sustainable earnings growth and reasonable valuations got the most attention, while the speculative high-flyers that had been coat-tailing on bullish exuberance lost their luster. Sounds like rational investing. But this apparently made life for a lot of portfolio managers difficult. In fact, the Financial Times reported that only about 10% of stock pickers beat their benchmarks, and Morningstar reported that only about 13% of actively managed large-company mutual funds beat the S&P 500.
However, Sabrient’s annual Baker’s Dozen portfolio of 13 top picks finished its sixth straight strong year (since 2009 inception). It was up about +22% since its January 13 launch while the S&P 500 was up about +15% over the same timeframe. And going into 2015, as we finalize our new portfolio, the top of our forward-looking quantitative rankings once again reveals strength in airlines, semiconductors, and biopharma. Baker’s Dozen represents a sector-diversified group of stocks based on our Growth at a Reasonable Price (GARP) quant model and confirmed by a rigorous forensic accounting review by our subsidiary Gradient Analytics to help us avoid stocks at higher risk of issues that could result in a underperformance. It is packaged as a unit investment trust (UIT) by First Trust Portfolios (note: the new 2015 Baker’s Dozen portfolio will launch on January 14).
Also, many of the investment professionals who have embraced the Baker’s Dozen have asked for access to some of our institutional-level research but at a more affordable price. In response, we are launching a new set of web-based research products geared to investment professionals.
Looking ahead, companies that generate increasing sales and earnings will outperform, particularly in a global economy characterized by subdued demand and pricing pressures. Moreover, removing the Fed’s manipulation will eventually enable normalization to wider yield spreads, more profitable bank lending, increasing money supply, and robust economic growth.
SPY chart review:
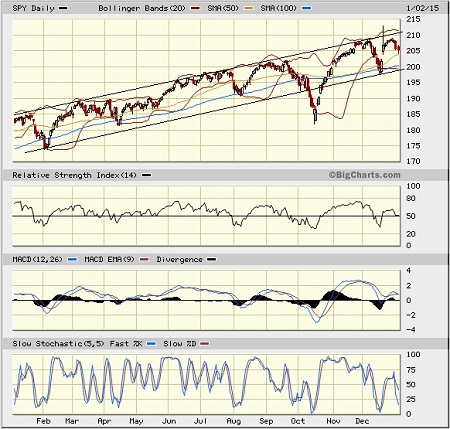
The SPDR S&P 500 Trust (SPY) closed last Friday at 205.43 after hitting a new 52-week high at the beginning of the week. I am still hopeful that the December technical pullback down to the lower trend line of the long-standing bullish rising channel was all the market needed in the way of a correction to avoid a more dramatic downside event in January, like the one we saw in Jan-Feb last year. Oscillators RSI, MACD, and Slow Stochastic are all in a neutral position and could either cycle a bit further down to oversold territory or turn upward from here. The 50-day simple moving average, 100-day SMA, and lower trend line have each provided reliable support levels over the past year, and should continue to do so. Only the October news-driven selloff violated all of these support levels before recovering quickly in a V-bottom. Price closed Friday right at the 20-day SMA, and support follows at the 50-day near 204, the 100-day SMA near 201, and the lower trend line that is now approaching 200. There is a mid-December gap acting as a bit of a magnet that could take price down to about 201 to fill the gap, which would correspond with the 100-day SMA. Overhead resistance could arise at the 52-week highs and then the upper trend line that is now approaching 211.
Latest sector rankings:
Relative sector rankings are based on our proprietary SectorCast model, which builds a composite profile of each equity ETF based on bottom-up aggregate scoring of the constituent stocks. The Outlook Score employs a forward-looking, fundamentals-based multifactor algorithm considering forward valuation, historical and projected earnings growth, the dynamics of Wall Street analysts’ consensus earnings estimates and recent revisions (up or down), quality and sustainability of reported earnings (forensic accounting), and various return ratios. It helps us predict relative performance over the next 1-3 months.
In addition, SectorCast computes a Bull Score and Bear Score for each ETF based on recent price behavior of the constituent stocks on particularly strong and weak market days. High Bull score indicates that stocks within the ETF recently have tended toward relative outperformance when the market is strong, while a high Bear score indicates that stocks within the ETF have tended to hold up relatively well (i.e., safe havens) when the market is weak.
Outlook score is forward-looking while Bull and Bear are backward-looking. As a group, these three scores can be helpful for positioning a portfolio for a given set of anticipated market conditions. Of course, each ETF holds a unique portfolio of stocks and position weights, so the sectors represented will score differently depending upon which set of ETFs is used. We use the iShares that represent the ten major U.S. business sectors: Financial (IYF), Technology (IYW), Industrial (IYJ), Healthcare (IYH), Consumer Goods (IYK), Consumer Services (IYC), Energy (IYE), Basic Materials (IYM), Telecommunications (IYZ), and Utilities (IDU). Whereas the Select Sector SPDRs only contain stocks from the S&P 500, I prefer the iShares for their larger universe and broader diversity. Fidelity also offers a group of sector ETFs with an even larger number of constituents in each.
Here are some of my observations on this week’s scores:
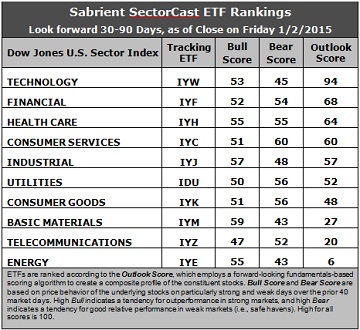
1. Technology ranks first with a robust Outlook score of 94. It displays the best return ratios, a good forward long-term growth rate and forward P/E, strong sell-side analyst sentiment (recent upward revisions to earnings estimates), and improving support among insiders (buying activity). Financial takes second place with a score of 68, displaying the best (lowest) forward P/E, and solid support among both sell-side analysts and insiders. Healthcare slips to third place with a 64, followed by Consumer Services/Discretionary and Industrial. This is a very bullish top five. Notably, the Consumer Services/Discretionary (a.k.a., Cyclicals) sector continues to display the greatest support from both analysts and insiders while also boasting the highest forward long-term growth rate.
2. Energy continues to hold the bottom spot after the plunge in oil prices, and Wall Street analysts continue to revise downward their earnings expectations. Joining Energy in the bottom two again is Telecom. Both sectors generally score poorly across the board in most factors in the Outlook model.
3. Looking at the Bull scores, Basic Materials displays the top score of 59, followed by Industrial. Telecom scores the lowest at 47. The top-bottom spread is only 12 points, which still reflects high sector correlations during particularly strong market days, i.e., highly-correlated risk-on action. But it is generally desirable in a healthy market to see low correlations and a top-bottom spread of at least 20 points, which indicates that investors have clear preferences in the stocks they want to hold, rather than the all-boats-lifted-in-a-rising-tide (risk-on) mentality.
4. Looking at the Bear scores, somewhat surprisingly it is Consumer Services/Discretionary that displays the highest score of 60 this week. Stocks within this sector have been the preferred safe havens on weak market days. Basic Materials and Energy share the lowest score of 43. The top-bottom spread is 17 points, reflecting moderately low sector correlations on particularly weak market days. In other words, certain sectors are holding up relatively well while others are selling off. Again, it is generally desirable in a healthy market to see low correlations and a top-bottom spread of at least 20 points.
5. Technology displays the best all-around combination of Outlook/Bull/Bear scores, while Energy is the worst. Looking at just the Bull/Bear combination, Consumer Services/Discretionary and Healthcare are the clear leaders, indicating superior relative performance (on average) in extreme market conditions (whether bullish or bearish). Energy, Technology, and Telecom have been the worst, indicating general investor avoidance (at least for the moment).
6. Overall, this week’s fundamentals-based Outlook rankings look quite bullish to me going into the New Year. The top five sectors are all economically-sensitive (or in the case of Healthcare, all-weather). Most impressive is the continued rise in Financial and Consumer Services/Discretionary. Keep in mind, the Outlook Rank does not include timing or momentum factors, but rather is a reflection of the fundamental expectations of individual stocks aggregated by sector.
Stock and ETF Ideas:
Our Sector Rotation model, which appropriately weights Outlook, Bull, and Bear scores in accordance with the overall market’s prevailing trend (bullish, neutral, or defensive), continues to indicate a bullish bias this week, and it suggests holding Industrial, Technology, and Basic Materials, in that order. (Note: In this model, we consider the bias to be bullish from a rules-based trend-following standpoint because on Friday, SPY remained above both its 50-day and 200-day simple moving averages. Even a brief violation doesn’t necessarily change the bias unless it is confirmed by another close below.)
Other highly-ranked ETFs from the Industrial, Technology, and Basic Materials sectors include SPDR S&P Transportation ETF Trust (XTN), iShares PHLX Semiconductor ETF (SOXX), and Vanguard Materials Index Fund ETF (VAW).
For an enhanced sector portfolio that enlists some top-ranked stocks (instead of ETFs) from within the top-ranked sectors, some long ideas from Industrial, Technology, and Basic Materials sectors include Hawaiian Holdings (HA), Huntington Ingalls Industries (HII), Brocade Communications Systems (BRCD), Tyler Technologies (TYL), Westlake Chemical (WLK), and Berry Plastics Group (BERY). All are highly ranked in the Sabrient Ratings Algorithm and also score within the top two quintiles (lowest accounting-related risk) of our Earnings Quality Rank (a.k.a., EQR), a pure accounting-based risk assessment signal based on the forensic accounting expertise of our subsidiary Gradient Analytics. We have found EQR quite valuable for helping to avoid performance-offsetting meltdowns in our model portfolios.
However, if you prefer to maintain a neutral bias, the Sector Rotation model suggests holding Technology, Financial, Healthcare, in that order. And if you prefer a defensive stance on the market, the model does not suggest holding Utilities this time around, but instead Consumer Services/Discretionary, Healthcare, and Financial, in that order.
IMPORTANT NOTE: Some readers have been asking for more specifics on how to trade our sector rotation strategy based solely on what I discuss in my weekly newsletter. Thus, I feel compelled to remind you that I post this information each week as a free look inside some of our institutional research and as a source of some trading ideas for your own further investigation. It is not intended to be traded directly as a rules-based strategy in a real money portfolio. I am simply showing what a sector rotation model might suggest if a given portfolio was due for a rebalance, and I may or may not update the information each week. There are many ways for a client to trade such a strategy, including monthly or quarterly rebalancing, perhaps with interim adjustments to the bullish/neutral/defensive bias when warranted -- but not necessarily on the days that I happen to post this weekly article. The enhanced strategy seeks higher returns by employing individual stocks (or stock options) that are also highly ranked, but this introduces greater risks and volatility. I do not track performance of the ETF and stock ideas mentioned here as a managed portfolio.
Disclosure: Author has no positions in stocks or ETFs mentioned.
Disclaimer: This newsletter is published solely for informational purposes and is not to be construed as advice or a recommendation to specific individuals. Individuals should take into account their personal financial circumstances in acting on any rankings or stock selections provided by Sabrient. Sabrient makes no representations that the techniques used in its rankings or selections will result in or guarantee profits in trading. Trading involves risk, including possible loss of principal and other losses, and past performance is no indication of future results.