Sector Detector: Fundamentals still look solid despite Brexit-induced volatility
After a nice little rally from mid-February until early June, investors started taking chips off the table, ostensibly in anticipation of Thursday’s Brexit vote. But Monday brought a fresh hint of optimism that Britain will vote to remain in the union, and the market responded with a healthy, broad-based rally. On balance, there appear to be good tailwinds for U.S. equities over the near term. I still see improving global stability (even with the impending Brexit vote), stable oil prices (in the range of $40-60, and currently near $50), and modest inflationary pressures on wages and prices.
I still think the S&P 500 will finish the year with a low double-digit return (currently up about +2.4% YTD as of Monday close). However, we likely will see continued sideways price action until a catalyst emerges -- perhaps improving forward guidance during 2Q earnings reports, which start next month, or perhaps when 3Q reports commence in October.
In this periodic update, I give my view of the current market environment, offer a technical analysis of the S&P 500 chart, review our weekly fundamentals-based SectorCast rankings of the ten U.S. business sectors, and then offer up some actionable ETF trading ideas.
Market overview:
From approximately June through February, stocks traded more based on news rather than fundamentals, which is not a healthy long-term approach to investing. But then in mid-February, the market reversed, starting with the usual short-covering and speculative rally that launches every bullish reversal. However, unlike the last big rally attempt last fall, this one began to rotate into more sustainable characteristics, such as improving breadth, lower sector correlations to the major index, and a flight to quality, which is a positive environment for anyone picking stocks based on fundamentals and forward valuation (including Sabrient).
Then on June 8, investors started taking chips off the table (in a return to their cautious, news-driven, risk-on/risk-off M.O.) in anticipation of any fallout from Thursday’s Brexit vote. But Monday’s broad-based relief rally helped breathe renewed life into those aforementioned positive market trends.
ConvergEx recently noted that monthly industry correlations to the index fell to around 70% for the past few months from the mid 90% range where they had lingered for much of the previous several months. In addition, by early June, broad indexes like the NASDAQ, Russell 2000, and the transports had all recaptured their 50-day and 200-day simple moving averages, and the equal weighted versions of the major indexes had been greatly outperforming the cap-weighted versions, with small caps greatly outperforming large caps. These are all positive signals for equities in general and fundamentals-based stock picking in particular.
Of course, the bogeyman of the moment is the Brexit vote in which U.K. voters decide whether to remain a part of the European Union (EU), which essentially was formed as a treaty among 28 European countries to create a more efficient economic zone through common trade policies and open borders for the unrestricted movement of people, goods, services, and capital among them. Britain has the fifth largest economy in the world, thus the anxiety of global investors as to what might come next. Indeed, the bond market has been signaling a flight to safety as the 10-year yield fell last week to around 1.60% and the 30-year to about 2.40%, while German 10-year bunds crossed into negative territory for the first time ever. So, for a little more than a week, it was risk-off. Oil fell and gold rallied. The average mutual fund’s cash holding reached nearly 6% (more than in 2008 or 2011).
However, I don’t think an exit decision will have a huge long-term impact on global trade or the equity markets. For one thing, the referendum is only advisory and not mandatory, so a vote to exit does not necessitate an exit. Secondly, Britain will still trade with its neighbors, whether as part of the EU or not, although it would need to set up alternative trade agreements. In fact, a definitive decision to exit the EU would trigger a lengthy 2-year exit process during which Britain would renegotiate everything with each of the other 27 countries.
Not to be overlooked, on Friday (the day after the Brexit vote) the widely-followed Russell Indices will implement their annual rebalance, so volatility is likely to reign later this week. After that, no matter what the result, I expect markets to eventually return to rational behavior, including broadening and low sector correlations in a general flight to quality and fundamentals-based investing.
Unfortunately, the Brexit vote is symptomatic of the broader move both globally and here at home towards populism, nationalism, and protectionism, as frustrations build about a lack of economic growth (pretty much everywhere). Globalization is a form of economic inclusion and integration that allows the greatest efficiencies, productivity, and entrepreneurial activity to flourish, wherever it is found. So, in my view, any attempt to break up the EU or other free trade treaties is more reflective of a failure to execute rather than a problem with the concept itself.
Most central banks seem to have lost their mojo. For example, in parts of the world where interest rates are negative there has been a decline in both economic activity and stock markets. The BOJ has failed for over 20 years to stimulate Japan’s moribund economy. They and the BOE both opted last week to keep rates steady. And here in the U.S., the Fed also held rates despite having previously telegraphed another rate hike to the market, and its cautiousness may be creating more fear and uncertainty than a more convicted tightening approach would.
CME fed funds futures are now indicating only a 12% probability of a rate hike in July (down from 60% just a couple of weeks ago). The probability rises to nearly 33% by September, and then 54% for at least one hike by December (and only 13% chance of two rate hikes by then), but all of these probabilities are significantly lower than two weeks ago. Unfortunately, this reflects perceived vulnerabilities in the economy, so equities are likely to display some elevated volatility.
Nevertheless, the 10-year Treasury yield remains as low as it has ever been, and of course low rates make stocks all the more attractive, whether an investor is seeking income or growth. A couple of Goldilocks conditions appear to be at work. One is economic growth sufficient enough to hold off a recession while not strong enough to prompt the Fed to raise rates (even though it is itching to do so). Another is oil between $40 and $60, which keeps energy firms in business (which is good for workers, suppliers, and the high-yield market) while not overburdening consumers.
After spiking to near 23 last Thursday, the CBOE Market Volatility Index (VIX), aka fear gauge, fell through Friday even though stocks were in the red, and then closed even lower on Monday at 18.37 as stock rallied. This is a positive signal. Also, there was a lot of insider buying last week as insiders evidently felt their companies were oversold and undervalued after some pre-Brexit vote profit-taking in fundamentally strong companies. Another positive. In addition, leadership of the market last week could be seen in Energy, Basic Materials, and Industrial sectors, which all depend upon economic growth. Even high yield bonds held up well last week.
I read somewhere that the average spread between the 10-year Treasury yield and the S&P 500 earnings yield going back to 1970 is essentially zero. But today, the earnings yield is about 4.2% while the 10-year yield hovers around 1.6%, i.e., a 2.6% spread. This further validates equity prices -- at least until either bond yields increase or earnings fall. But with low inflation and an accommodative Fed, coupled with Wall Street’s earnings expectations that 3Q 2016 will be the first positive year-over-year comp in seven quarters, the climate seems good for equities.
On the other hand, with the S&P 500 trading at a forward PEG (P/E to growth rate ratio) of at least 2.0, it may appear that stocks are fully valued for the modest growth expectations -- unless companies start guiding revenues higher to grow EPS from the top-line, rather from further cost-cutting, productivity gains, and stock buybacks. Nevertheless, as we were putting together our summer Forward Looking Value Portfolio of attractive GARP stocks (which launches on Thursday through First Trust Portfolios), we were able to find 35 companies with solid earnings forecasts for the next 12 months that, as a diversified portfolio, are selling at an average forward PEG of around 0.30. So unless the analyst community is way too optimistic, there are still some compelling investment opportunities to be found.
As a reminder, I will be attending the 21st annual IMN Global Indexing and ETFs Conference at the St. Regis Monarch Beach Hotel in scenic Dana Point, CA next week, June 26-28. IMN.org has provided me with a discount code to share with any of my readers who might want to attend: SD10.
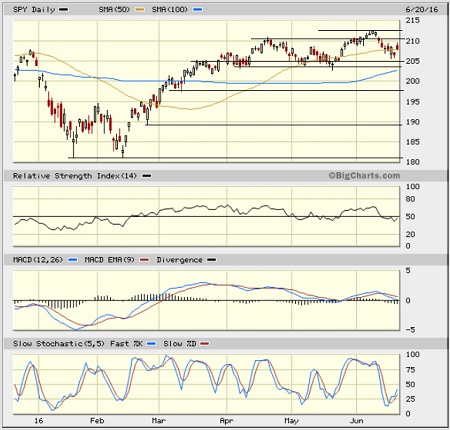
SPY chart review:
The SPY closed Monday at 207.85, making a nice recovery from a nasty bear attack, and is back above its 50-day, 100-day, and 200-day simple moving averages. It remains stuck in a sideways channel, or trading range, between 205 (where the early April breakout occurred) and 210 (roughly corresponding with S&P 500 index at 2100). Its June false-breakout high is 212.54, and its all-time high from May 2015 at 213.78. Last week, several bullish gaps were filled, and price approached the bottom of the channel at 205, where bulls mustered conviction and ultimately put together Monday’s bounce. I still believe that we are most likely in store for more sideways action during the summer, and Monday’s gap up will likely be filled. But I also believe we will see a new all-time high before year-end, and perhaps double-digit returns on the SPY (which, after considering dividends, would put it at or above 220). Oscillators RSI, MACD, and Slow Stochastic are all pointing up bullishly.
Latest sector rankings:
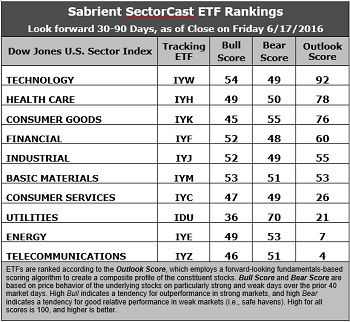
Relative sector rankings are based on our proprietary SectorCast model, which builds a composite profile of each equity ETF based on bottom-up aggregate scoring of the constituent stocks. The Outlook Score employs a forward-looking, fundamentals-based multifactor algorithm considering forward valuation, historical and projected earnings growth, the dynamics of Wall Street analysts’ consensus earnings estimates and recent revisions (up or down), quality and sustainability of reported earnings (forensic accounting), and various return ratios. It helps us predict relative performance over the next 1-3 months.
In addition, SectorCast computes a Bull Score and Bear Score for each ETF based on recent price behavior of the constituent stocks on particularly strong and weak market days. High Bull score indicates that stocks within the ETF recently have tended toward relative outperformance when the market is strong, while a high Bear score indicates that stocks within the ETF have tended to hold up relatively well (i.e., safe havens) when the market is weak.
Outlook score is forward-looking while Bull and Bear are backward-looking. As a group, these three scores can be helpful for positioning a portfolio for a given set of anticipated market conditions. Of course, each ETF holds a unique portfolio of stocks and position weights, so the sectors represented will score differently depending upon which set of ETFs is used. We use the iShares that represent the ten major U.S. business sectors: Financial (IYF), Technology (IYW), Industrial (IYJ), Healthcare (IYH), Consumer Goods (IYK), Consumer Services (IYC), Energy (IYE), Basic Materials (IYM), Telecommunications (IYZ), and Utilities (IDU). Whereas the Select Sector SPDRs only contain stocks from the S&P 500, I prefer the iShares for their larger universe and broader diversity. Fidelity also offers a group of sector ETFs with an even larger number of constituents in each.
Here are some of my observations on this week’s scores:
1. Technology solidified its hold on the top spot with a robust Outlook score of 92, displaying good scores across the board, including a strong forward long-term growth rate (13.8%), solid return ratios, the lowest forward PEG of 1.15, and the best Wall Street analyst sentiment (net positive revisions to earnings estimates). Healthcare takes second at 78 with generally good factor scores across the board, including a forward P/E of about 15.4x. Consumer Goods (Staples/Noncyclical) falls to third with a 76; however, the sector’s forward valuation remains pricey at about 18x while its forward long-term growth rate is a relatively low 9.5%, indicating a forward PEG of 1.89. Financial remains in fourth and still displays the lowest aggregate forward P/E (14.2x). Rounding out the top of the rankings are Industrial, Basic Materials, and Consumer Services (Discretionary/Cyclical).
2. Energy has lifted off the bottom as year-over-year growth comps start to look more favorable, and in fact Energy displays the highest YOY growth rate of 15.3% and improving sell-side sentiment. However, it still has the highest forward P/E at 27.5x. Telecom now takes the bottom spot with an Outlook score of 4, as it displays a forward P/E of 24.5x and a forward long-term growth rate of 9.8%, indicating a forward PEG of 2.50. Notably, Utilities has fallen to third-worst with an Outlook score of 21 and by far the highest forward PEG of 3.59.
3. Looking at the Bull scores, Technology has the top score of 54 as it displays relative strength on strong market days, while Utilities is the lowest at 36. The top-bottom spread is 18 points, which reflects relatively low sector correlations on strong market days, which can be good for stock picking. It is desirable in a healthy market to see low correlations reflected in a top-bottom spread of at least 20 points, which indicates that investors have clear preferences in the stocks they want to hold (rather than broad risk-on behavior).
4. Looking at the Bear scores, Utilities (as usual) displays the top score of 70, which means that stocks within this sector have been the preferred safe havens on weak market days. Financial scores the lowest at 48, as investors flee during market weakness. The top-bottom spread is 22 points, which reflects low sector correlations on weak market days, which can be good for stock picking. Ideally, certain sectors will hold up relatively well while others are selling off (rather than broad risk-off behavior), so it is desirable in a healthy market to see low correlations reflected in a top-bottom spread of at least 20 points.
5. Technology displays the best all-around combination of Outlook/Bull/Bear scores, while Telecom is the worst. However, looking at just the Bull/Bear combination, Utilities is the best on the strength of its huge Bear score, followed by the more balanced Basic Materials, indicating superior relative performance (on average) in extreme market conditions (whether bullish or bearish), while Consumer Services (Discretionary/Cyclical) is the worst.
6. This week’s fundamentals-based Outlook rankings still have a modestly bullish tilt, in my opinion, given the scoring strength in Technology, Healthcare (led by pharma), Financial, Industrial, and Basic Materials, and the worsening weakness in Utilities and Telecom. Keep in mind, the Outlook Rank does not include timing, momentum, or relative strength factors, but rather is a reflection of the fundamental expectations for individual stocks aggregated by sector.
ETF Trading Ideas:
Our Sector Rotation model, which appropriately weights Outlook, Bull, and Bear scores in accordance with the overall market’s prevailing trend (bullish, neutral, or defensive), now reflects a bullish bias and suggests holding Technology, Healthcare, and Financial, in that order. (Note: In this model, we consider the bias to be bullish from a rules-based trend-following standpoint when SPY is above both its 50-day and 200-day simple moving averages.)
Besides iShares’ IYW, IYH, and IYF, other highly-ranked ETFs in our SectorCast model from the Technology, Healthcare, and Financial sectors include VanEck Vectors Semiconductor ETF (SMH), SPDR S&P Pharmaceuticals ETF (XPH), and SPDR S&P Capital Markets ETF (KCE).
Others scoring near the top of the rankings with a strong combination of Outlook, Bull, and Bear Scores include Guggenheim Invest Shipping ETF (SEA), iShares US Home Construction ETF (ITB), and Direxion iBillionaire Index ETF (IBLN).
If you prefer a neutral bias, the Sector Rotation model suggests holding Technology, Healthcare, and Consumer Goods (Staples/Noncyclical), in that order. On the other hand, if you prefer a defensive stance on the market, the model suggests holding Utilities, Consumer Goods (Staples/Noncyclical), and Healthcare, in that order.
IMPORTANT NOTE: I post this information periodically as a free look inside some of our institutional research and as a source of some trading ideas for your own further investigation. It is not intended to be traded directly as a rules-based strategy in a real money portfolio. I am simply showing what a sector rotation model might suggest if a given portfolio was due for a rebalance, and I may or may not update the information on a regular schedule. There are many ways for a client to trade such a strategy, including monthly or quarterly rebalancing, perhaps with interim adjustments to the bullish/neutral/defensive bias when warranted -- but not necessarily on the days that I happen to post this article. The enhanced strategy seeks higher returns by employing individual stocks (or stock options) that are also highly ranked, but this introduces greater risks and volatility. I do not track performance of the ideas mentioned here as a managed portfolio.
Disclosure: Scott Martindale is president of Sabrient Systems, LLC. The author has no positions in stocks or ETFs mentioned.
Disclaimer: This newsletter is published solely for informational purposes and is not to be construed as advice or a recommendation to specific individuals. Individuals should take into account their personal financial circumstances in acting on any rankings or stock selections provided by Sabrient. Sabrient makes no representations that the techniques used in its rankings or selections will result in or guarantee profits in trading. Trading involves risk, including possible loss of principal and other losses, and past performance is no indication of future results.