Sector Detector: Sector rotation model stays bullish, but neutral rankings and technical resistance flash caution
Last week, stocks cycled bullish yet again. In fact, the S&P 500, NYSE Composite, and NASDAQ each closed at record highs as investors positioned for the heart of earnings season in the wake of strong reports from some of the Tech giants. Notably, Utilities stocks got some renewed traction as yield-starved investors returned to the sector. Although our trend-following sector rotation model remains bullish, strong overhead technical resistance and neutral rankings in our SectorCast quant model indicate that caution is in order, and this might not be the moment for a major upside breakout, particularly given the expected softness in earnings reports.
In this weekly update, I give my view of the current market environment, offer a technical analysis of the S&P 500 chart, review our weekly fundamentals-based SectorCast rankings of the ten U.S. business sectors, and then offer up some actionable trading ideas, including a sector rotation strategy using ETFs and an enhanced version using top-ranked stocks from the top-ranked sectors.
Market overview:
The previous record high for the NASDAQ of 5049 was hit on March 10, 2000, and now 15 years later, it has finally eclipsed the high -- but with much more reasonable valuation multiples. And it was the old-guard leadership from that former heyday that has set the tone, with Amazon (AMZN), Google (GOOGL), and Microsoft (MSFT) all putting out strong reports with successful initiatives outside of their traditional business models. There is also the expectation that the US dollar, which is up nearly 28% since last May’s low, is set to weaken a bit, which would give a much needed boost to corporate earnings.
But it is international markets that have performed the best this year, as they can avoid the headwinds that U.S. companies are facing with the strong U.S. dollar and slow sales and earnings growth. Looking beyond Europe and Japan, the Market Vectors Russia ETF (RSX) is up 36% YTD, iShares China Large-Cap (FXI) is up 25% (on the back of ultra high multiples and leverage, and Global X MSCI Argentina ETF (ARGT) is up 18%.
A variety of asset prices should benefit from a weaker dollar, including crude oil, gold, copper, and energy, materials, and mining stocks. Crude oil closed Friday at $57.15, which supports my prediction that oil would settle into the $50+ range for this year, after falling so far so fast last year. However, given the inverse correlation between oil and the dollar, continued strength will rely upon a weakening dollar, which might be possible if the Fed continues to look reluctant to start raising its short-term fed funds rate this year.
With the 10-year Treasury rate closing Friday at 1.92%, there is obviously no rush for the exit among fixed income investors, particularly yield-hungry global investors seeking safe havens for their cheap money (thanks to the largesse of so many central banks). Keep in mind that for the past 30 years, the 10-year U.S. Treasury yield has been in a persistent downward trend from over 10% in 1985 to under 2% today. This continues to be supportive of higher valuation multiples in equities, and even when the Fed finally makes its first move toward raising the fed funds rate, it will serve to further strengthen the dollar and attract global capital.
Notably, with central banks around the worlds racing to debase their currencies (while the Fed gears up to raise rates at some point), many institutional portfolio managers are starting to discretely accumulate positions in gold once again as both a global inflation hedge and a performing asset class, including using ETFs like the SPDR Gold Shares (GLD) and the iShares Gold Trust (IAU).
Wednesday’s Q1 GDP report will no doubt be weak (consensus estimate stands at just +0.1%), but it is surely priced in already as investors look forward to more robust economic growth in subsequent quarters. And as for earnings season, this week is the busiest week of the season for reports, with over 150 of the S&P 500 companies reporting, including bellwethers like Apple (AAPL), Visa (V), and Exxon Mobil (XOM). According to FactSet, Q1 2015 earnings overall are expected to fall -2.8% versus Q1 2014.
The CBOE Market Volatility Index (VIX), a.k.a. fear gauge, closed Friday at 12.29, its lowest close of the year and well below the 15 threshold between investor fear and complacency.
SPY chart review:
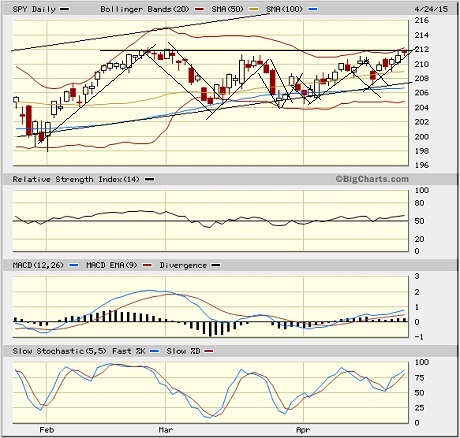
The SPDR S&P 500 Trust (SPY) closed Friday at 211.65 after a strong week. It has seemed to be creating a pattern of successive bull flag formations, each time bouncing from reliable support at the long-standing uptrend line. Now it finds itself challenging the February highs around 212, which should prove to be formidable resistance in the absence of a strong catalyst for a bullish breakout. In fact, the current flagpole might be forming a bullish ascending triangle, as shown. Nonetheless, oscillators RSI, MACD, and Slow Stochastic are all on a bullish trajectory, although Slow Stochastic might be ready to roll over, but of course bulls also must deal with the specter of the historically weak month of May lurking on the horizon. Overall, I don’t think there is sufficient fuel for breakout on this attempt. Support levels include the 50-day simple moving average (around 209), the uptrend line (approaching 208), the 100-day SMA just above 206, and the critical 200-day SMA (just above 202), followed by round-number support at the 200 price level.
Latest sector rankings:
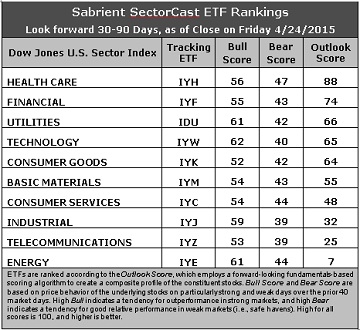
Relative sector rankings are based on our proprietary SectorCast model, which builds a composite profile of each equity ETF based on bottom-up aggregate scoring of the constituent stocks. The Outlook Score employs a forward-looking, fundamentals-based multifactor algorithm considering forward valuation, historical and projected earnings growth, the dynamics of Wall Street analysts’ consensus earnings estimates and recent revisions (up or down), quality and sustainability of reported earnings (forensic accounting), and various return ratios. It helps us predict relative performance over the next 1-3 months.
In addition, SectorCast computes a Bull Score and Bear Score for each ETF based on recent price behavior of the constituent stocks on particularly strong and weak market days. High Bull score indicates that stocks within the ETF recently have tended toward relative outperformance when the market is strong, while a high Bear score indicates that stocks within the ETF have tended to hold up relatively well (i.e., safe havens) when the market is weak.
Outlook score is forward-looking while Bull and Bear are backward-looking. As a group, these three scores can be helpful for positioning a portfolio for a given set of anticipated market conditions. Of course, each ETF holds a unique portfolio of stocks and position weights, so the sectors represented will score differently depending upon which set of ETFs is used. We use the iShares that represent the ten major U.S. business sectors: Financial (IYF), Technology (IYW), Industrial (IYJ), Healthcare (IYH), Consumer Goods (IYK), Consumer Services (IYC), Energy (IYE), Basic Materials (IYM), Telecommunications (IYZ), and Utilities (IDU). Whereas the Select Sector SPDRs only contain stocks from the S&P 500, I prefer the iShares for their larger universe and broader diversity. Fidelity also offers a group of sector ETFs with an even larger number of constituents in each.
Here are some of my observations on this week’s scores:
1. Healthcare remains in first place with a solid Outlook score of 88. Healthcare displays good sell-side analyst sentiment (net revisions to earnings estimates) and above average scores in most factors in the model, including return ratios, forward long-term growth rate, and insider sentiment (buying activity). Financial takes second with a score of 74, with reasonably good insider sentiment and the lowest forward P/E. Utilities rises to third this week with a 66, displaying good analyst sentiment and a relatively low forward P/E.
2. Energy continues to hold the bottom spot with an Outlook score of 7, given the persistent weakness in oil prices and the downward earnings revisions from Wall Street (although it is leveling off). Energy ranks among the worst in all factors in the model, including a forward long-term growth rate near zero and by far the highest forward P/E. Telecom remains in the bottom two with a score of 25 despite new positive sell-side earnings revisions.
3. Looking at the Bull scores, Technology displays the top score of 62, followed by Energy and Utilities (after a bullish week) at 61. Consumer Goods (Staples/Noncyclical) sports the lowest Bull score of 52. Once again, all scores are above 50, and the top-bottom spread remains relatively narrow at only 10 points, which reflects elevated sector correlations (i.e., broad risk-on buying). It is generally desirable in a healthy market to see low correlations reflected in a top-bottom spread of at least 20 points, which indicates that investors have clear preferences in the stocks they want to hold.
4. Looking at the Bear scores, Healthcare displays the highest (i.e., best) score of 47, which means that stocks within this sector have been the preferred safe havens (relatively speaking) on weak market days. Industrial and Telecom rank the lowest at 39. The top-bottom spread remains a narrow 8 points, which reflects high sector correlations on particularly weak market days (i.e., broad risk-off selling). Ideally, certain sectors will hold up relatively well while others are selling off, so it is generally desirable in a healthy market to see low correlations reflected in a top-bottom spread of at least 20 points.
5. Healthcare displays the best all-around combination of Outlook/Bull/Bear scores, while Energy is the worst. Looking at just the Bull/Bear combination, Energy is the best, followed by Utilities and Healthcare, indicating superior relative performance (on average) in extreme market conditions (whether bullish or bearish), while Telecom ranks the worst.
6. Overall, this week’s fundamentals-based Outlook rankings continue to look neutral, with Utilities and Consumer Goods (Staples/Noncyclical) in the top five and lower scores for Technology and Industrial. Keep in mind, the Outlook Rank does not include timing or momentum factors, but rather is a reflection of the fundamental expectations of individual stocks aggregated by sector.
Stock and ETF Ideas:
Our Sector Rotation model, which appropriately weights Outlook, Bull, and Bear scores in accordance with the overall market’s prevailing trend (bullish, neutral, or defensive), retains its bullish bias and suggests holding Technology, Utilities, and Healthcare in that order. (Note: In this model, we consider the bias to be bullish from a rules-based trend-following standpoint when SPY is above both its 50-day and 200-day simple moving averages.)
Other highly-ranked ETFs in SectorCast from the Technology, Utilities, and Healthcare sectors include iShares NASDAQ Biotechnology ETF (IBB), and Guggenheim Invest S&P 500 Equal Weight Utilities ETF (RYU), PowerShares Dynamic Semiconductors Portfolio (PSI).
For an enhanced sector portfolio that enlists some top-ranked stocks (instead of ETFs) from within the top-ranked sectors, some long ideas from Technology, Utilities, and Healthcare sectors include Receptos (RCPT), Shire plc (SHPG), Level 3 Communications (LVLT), Exelon (EXC), Cavium (CAVM) and Cirrus Logic (CRUS). All are highly ranked in the Sabrient Ratings Algorithm.
If you prefer to maintain a neutral bias, the Sector Rotation model still suggests holding Healthcare, Financial, and Utilities, in that order. But if you prefer a defensive stance on the market, the model suggests holding Healthcare, Financial, and Consumer Services (Discretionary/Cyclical), in that order.
IMPORTANT NOTE: I post this information each week as a free look inside some of our institutional research and as a source of some trading ideas for your own further investigation. It is not intended to be traded directly as a rules-based strategy in a real money portfolio. I am simply showing what a sector rotation model might suggest if a given portfolio was due for a rebalance, and I may or may not update the information each week. There are many ways for a client to trade such a strategy, including monthly or quarterly rebalancing, perhaps with interim adjustments to the bullish/neutral/defensive bias when warranted -- but not necessarily on the days that I happen to post this weekly article. The enhanced strategy seeks higher returns by employing individual stocks (or stock options) that are also highly ranked, but this introduces greater risks and volatility. I do not track performance of the ETF and stock ideas mentioned here as a managed portfolio.
Disclosure: Author has no positions in stocks or ETFs mentioned.
Disclaimer: This newsletter is published solely for informational purposes and is not to be construed as advice or a recommendation to specific individuals. Individuals should take into account their personal financial circumstances in acting on any rankings or stock selections provided by Sabrient. Sabrient makes no representations that the techniques used in its rankings or selections will result in or guarantee profits in trading. Trading involves risk, including possible loss of principal and other losses, and past performance is no indication of future results.