Sector Detector: Stocks take a bullish rotation into neglected market segments, but will it last?
 by Scott Martindale
President, Sabrient Systems LLC
In case you didn’t notice, the past several days have brought an exciting and promising change in character in the US stock market. Capital has been rotating out of the investor darlings – including the momentum, growth, and low-volatility factors, as well as Treasury bonds and “bond proxy” defensive sectors – and into the neglected market segments like value, small-mid caps, and cyclical sectors favored by Sabrient’s GARP (growth at a reasonable price) model, many of which have languished with low valuations despite solid forward growth expectations. And it came just in the nick of time.
In Q3 of last year, the S&P 500 was hitting new highs and the financial press was claiming that investors were ignoring the trade war, when in fact they weren’t ignoring it at all, as evidenced by narrow leadership coming primarily from the mega-cap secular Technology names and large cap defensive sectors (risk-off). In reality, such market behavior was unhealthy and doomed to failure without a broadening into higher-beta cyclical sectors and small-mid caps, which is what I was opining about at the time. Of course, you know what happened, as Q4 brought about an ugly selloff. And this year, Q3 was looking much the same – at least until this sudden shift in investor preferences.
Last month, as has become expected given its typically low-volume summer trading, August saw increased volatility – and also brought out apocalyptic commentaries similar to what we heard from the talking heads in December. In contrast to the severely overbought technical conditions in July when the S&P 500 managed to make a new high, August saw the opposite, with the major indices becoming severely oversold and either challenging or losing support at their 200-day moving averages or even testing their May lows, as investors grew increasingly concerned about a protracted trade war, intensifying protectionist rhetoric, geopolitical turmoil, Hard Brexit, slowing global economy, and US corporate earnings recession. Utilities and Real Estate led, while Energy trailed. Bonds surged and yields plunged. August was the worst month for value stocks in over 20 years.
But alas, it appears it we may have seen a blow-off top in bonds, and Treasury yields may have put in a bottom. All of a sudden, the major topic of conversation among the talking heads this week has been the dramatic rotation from risk-off market segments to risk-on, which has been a boon for Sabrient’s Baker’s Dozen portfolios, giving them the opportunity to gain a lot of ground versus the S&P 500 benchmark. The Energy sector had been a persistent laggard, but the shorts have been covering as oil prices have firmed up. Financials have caught a bid as US Treasury prices have fallen (and yields have risen). Small cap value has been greatly outperforming large cap growth. It seems investors are suddenly less worried about a 2020 recession, ostensibly due to renewed optimism about trade talks, or perhaps due to the apparent resilience of our economy to weather the storm.
The question, though, is whether this is just a temporary reversion to the mean – aka a “junk rally,” as some have postulated – or if it is the start of a healthy broadening in the market and a rotation from the larger, high-quality but high-priced stocks (which have been bid up by overly cautious sentiment, passive index investing, and algorithmic trading, in my view), into the promising earnings growers, cyclicals, and good-quality mid and small caps that would normally lead a rising market. After all, despite its strong year-to-date performance, the S&P 500 really hasn’t progressed much at all from last September’s high. But a real breakout finally may be in store if this risk-on rotation can continue.
I think the market is at a critical turning point. We may be seeing a tacit acknowledgment among investors that perhaps the economy is likely to hold up despite the trade war. And perhaps mega-caps with a lot of international exposure are no longer the best place to invest. And perhaps those mega-caps, along with the defensive sectors that have been leading the market for so long, are largely bid up and played out at this point such that the more attractive opportunities now lie in the unjustly neglected areas – many of which still trade at single-digit forward P/Es despite solid growth expectations.
September is historically a bad month for stocks. It is the only month in which the Dow Jones Industrials index has averaged negative performance over the past 100 years, showing positive returns about 40% of the time (according to Bespoke Investment Group). But this budding rotation may be setting up a more positive outcome. I was on the verge of publishing this month’s article early last week, but the market’s sudden (and important!) change in character led me to hold off for a few days to see how the action unfolded, and I have taken a new tack on my content.
In this periodic update, I provide a detailed market commentary, offer my technical analysis of the S&P 500, review Sabrient’s latest fundamentals based SectorCast rankings of the ten US business sectors, and serve up some actionable ETF trading ideas. In summary, our sector rankings look defensive to me, while the technical picture is short-term overbought but longer-term bullish, and the sector rotation model takes to a solidly bullish posture. Read on…
Market Commentary:
I’d like to welcome my readers back after what was hopefully a pleasant summer. I know that many of you were impacted by severe weather events and I hope you and your friends and loved ones came through in good shape. Please know that when I see these things in the news, whether in Florida or South Dakota or wherever they may be, I am thinking of you and wishing the best for you. For my part, although I now live in Scottsdale (and work out of Gradient Analytics’ Phoenix office), my wife Laura and I escaped the heat by spending the month of August living and working in the Ventura/Santa Barbara area where Sabrient is based. 40 degrees cooler was quite pleasant.
Sorry if I am even more long-winded this month than usual, but the past week’s sudden turn of events has given me a lot to talk about.
The fledgling risk-on rotation:
Starting with my July 2018 article, I have been consistently writing about the market bifurcation that began in mid-June 2018 – driven by a stark escalation in the trade war with China and an “autopilot” Federal Reserve – leading to defensive sectors, low-volatility, “bond proxies,” and secular-growth big-cap Tech getting the capital flows at the expense of the typical market segments that lead in a strong economy, like cyclical sectors (Financials, Industrials, Energy, Materials), small-mid caps, and high-beta. And even as the S&P 500 hit new highs this summer, S&P Global has termed it a “low conviction rally” led by Minimum Volatility and Low Volatility (i.e., risk-off) factors, opining that the significant outperformance of the S&P 500 Low Volatility Index (SPLV) versus the S&P 500 Index is “unusually strong performance for a defensive index in a rising market.” And while large cap indexes continued to hit new highs through July, the S&P 600 small cap index has remained at least 10% below its high from August 2018.
This piece from First Trust illustrates the extreme relative outperformance of large caps and defensive sectors during the roughly 18 months spanning 3/8/18-8/26/19, in which there were really only about three months in which cyclicals and small caps provided leadership (mostly during the post-meltdown rally 12/24/18-3/1/19). And over the past year (ever since small caps peaked on 8/31/18 through 8/31/19), small cap value trailed large cap growth by more than 20 percentage points (pps). Moreover, as Simeon Hyman of ProShares noted in his latest market commentary, the relative valuation of US small caps versus large caps actually has been steadily declining for the past 10 years, with the aggregate price-to-book (P/B) ratio for small caps having fallen from near parity with large caps to a 40% discount today. One would think that falling interest rates would benefit small caps given their typically higher leverage.
The top four sector ETFs for asset flows for most of this year have been Real Estate, Telecom, Utilities, and Consumer Staples, which all serve as “bond proxies” given their attractive dividend yields. As a result, the forward P/E on the low-growth Utilities Select SPDR (XLU) was at 18.9x heading into September while the higher-growth Energy Select SPDR (XLE) languished at 15.5x, and the broad S&P 500 was at 16.5x. This was not indicative of a healthy stock market.
Although the market’s YTD performance looks really good – with the S&P 500 total return an impressive +21.6% while the Russell 2000 is up +18.2% as of 9/13/19 – much of it simply has been recovering ground that was lost during 4Q18. Once the S&P 500 hit its 2018 peak on 9/20/18, it has really only gone sideways ever since, with a few failed attempts to break out to the upside. It couldn’t achieve a new high until July, and even now on this latest breakout attempt is only about 2.6% above that previous high, while the Russell 2000 is still nearly 10% below its 8/31/18 high.
Last September, I opined that the market would not be able to progress much higher without a rotation back into risk-on market segments, and I have felt the same way this year. This all has been hard on Sabrient’s GARP portfolios, including our monthly Baker’s Dozens. But our model-driven approach has consistently indicated to us that those “risk-on” market segments showed little in the way of reduced forward guidance, and so their forward valuations (e.g., P/E and PEG ratios) kept falling (i.e., even more attractive) as share prices fell while earnings expectations held up, reflecting cautious investor sentiment and an apparent belief that things were bound to take a turn for the worse. Eventually the trade war’s impact on the psyche of corporate leaders indeed began to bring down forward guidance, as capital investment was put on hold, even though consumer sentiment has remained robust and the driver of solid economic growth while the manufacturing segment has fallen into contraction.
But despite the persistent risk-off sentiment, an underlying strength and optimism in our economy has remained intact, bolstered by the Fed’s dovish reversal on monetary policy, such that every time there are signs of optimism about trade negotiations, investors have shown a readiness for that risk-on rotation. In fact, much of the leadership during the initial post-selloff recovery (12/24/18-3/1/19) was provided by the risk-on market segments, and so far, they are driving this latest breakout attempt. Indeed, we finally might be getting a sustained rotation, and everyone seems to be talking about the market’s sudden change of character.
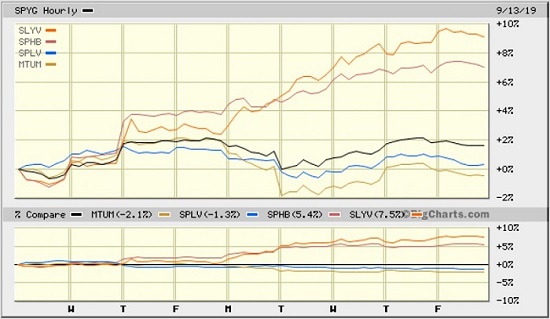
The chart below illustrates September’s dramatic rotation from the investor darlings from momentum, growth, low-volatility defensive sectors, and Treasury bonds, and into the long-neglected risk-on market segments like value, high beta, small-mid caps, and cyclical sectors. Note the approximate +7 percentage points (pps) outperformance of SPDR S&P 600 Small Cap Value (SLYV), up +9%, versus SPDR S&P 500 Growth (SPYG), up less than +2%, in just the first two weeks of September. Also shown for comparisons are the Invesco S&P 500 High Beta (SPHB) outperforming both the Invesco S&P 500 Low Volatility (SPLV) and iShares Edge MSCI USA Momentum (MTUM) by about 7 and 8 pps, respectively. And here is another interesting comparison not shown on the chart: Over the same timeframe, the highly cyclical VanEck Vectors Steel ETF (SLX) is up +14% while the iShares 20+ Year Treasury Bond ETF (TLT) is down about -7% – a performance gap of +21 pps in two weeks! This promising turn in investor preferences has helped Sabrient’s portfolios gain significant ground against the SPY benchmark.
So, the logical question is whether this fledgling rotation is likely to persist. Let’s explore this in greater depth.
In my view, investors have chosen to largely ignore fundamentals in favor or news-driven (or tweet-driven) trading pretty consistently over the past four years, essentially starting in mid-2015 when the last presidential election campaign commenced and the Fed began signaling its intentions to tighten – with the exception being the 15 months of post-election rally from November 2016 until the February 2018 correction. So, we might be inclined to blame the populist movement that has embraced out-of-the-mainstream characters like Donald Trump and Bernie Sanders here in the US (and many others around the world) as the reason investor preferences have become so fickle, cautious, and defensive (or as BlackRock calls it, “portfolio resilience”). But other culprits may be the rapid emergence of passive investing, which favors large caps due to market-cap weighting, and systematic equity strategies (aka algorithmic trading), which requires maximum liquidity.
Michael Burry of Scion Asset Management, who was profiled in the Michael Lewis book The Big Short for his profitable short trade on mortgage-backed securities that led to the Financial Crisis, has suggested that the combination of record inflows to passive indexes and outflows from active strategies have distorted prices for both stocks and bonds in much the same way that CDOs did for subprime mortgages. (In fact, BAML predicts passive funds will surpass active in total assets by 2022.) Burry recently said, “The bubble in passive investing through ETFs and index funds as well as the trend to very large size among asset managers has orphaned smaller value-type securities globally,” which have little to no representation in passive indexes. So, he has made his own activist investments in several small cap companies – as much for what he sees as their limited downside (particularly in the event of a market selloff and massive liquidation of passive funds) as for their upside potential.
Similarly, as I touched on in last month’s article, JP Morgan quant strategist Marko Kolanovic described in July what he sees as a historically large relative valuation divergence between Low Volatility/Defensives over Value/Cyclicals, calling it the largest such bubble in market history, unsustainable, and a rare opportunity to position for a re-convergence, with the main beneficiaries being Energy, Materials, small caps, and value stocks (displaying low P/E and P/B). More recently, he observed that his small cap momentum indicator reached its maximum negative reading at the same time his large cap momentum indicator hit its maximum positive reading. He has seen such an extreme divergence between small and large caps only one other time: during the Internet bubble of 2000.
Likewise, at the beginning of the month, Jim Paulsen of Leuthold Group postulated on a “fear bubble.” He said, “If we find out it turns out better than feared, many, many portfolios are under-allocated to risk assets and will have to re-adjust themselves trying to get more risk, which could drive risk assets a lot higher.” Today, he agrees that the market is showing the beginnings of a sustainable change of character in bond yields and stock market leadership.
In addition, BAML’s latest note to clients stated that its flagship positioning model just triggered a contrarian buy signal for risk assets, which was its first such buy signal since January 3 of this year.
So, I am in good company with my own observations over the past 15 months, and indeed it appears that an overdue risk-on rotation might be underway. The elusive catalyst to really kick this move into gear might be a resurgence in manufacturing activity, which has been badly lagging (mainly due to the trade war uncertainty) while consumer spending has been driving the economy.
Interest rates may have found a bottom:
The shaky global bond markets and the nearly $17 trillion in negative-yielding sovereign debt are in part reflecting a pervasive fear about shrinking monetary policy capacity among central banks. Outside of the US, about 45% of bonds now offer negative yields. Until this past week, the entire German yield curve “paid” negative yields. Moreover, Japan owns about 50% of its own bonds, and the ECB owns 30% of its bonds. Remarkably, a large Denmark bank just launched the world’s first negative interest mortgage, a 10-year loan at -0.5% – i.e., they will pay you to take out a home mortgage by reducing your outstanding balance by more than your payment. (Sign me up!) In fact, companies and governments alike around the world are starting to take advantage of the ultra-low rate environment by issuing 50- and 100-year bonds. As a result, corporate bonds have become hot items for yield-starved global investors, and with nearly 95% of the world’s positive-yielding investment-grade corporate debt found in the US, the money is flowing here.
The 30-year Treasury yield closed Friday at 2.37%, while the 10-year T-note is at 1.90%, the 2-year T-note 1.80%, and the 3-month T-bill 1.97%. So, the 3-month/10-year spread is inverted by just -7 bps, while the 2-10 spread is +10 bps and not inverted. Nevertheless, the US still looks quite attractive compared with other developed market yields, and that relative appeal continues to attract capital and suppress rates, as global investors seek higher risk-free yields. Troubled Italy’s 10-year pays only +0.87%, while Canada is +1.51%, Australia +1.23%, UK +0.76%, France at -0.17%, Japan -0.16%, and Germany -0.45%.
As I discussed last month, given such low interest rate levels keeping debt service modest, and given the distortion of overseas rates from massive QE and other central bank monetary policies driving abundant global liquidity into our bond market, I view the inverted 3-month/10-year yield curve as a false signal and not a clear recessionary signal that history would normally suggest. And it is also important to note that the closely followed 2-year/10-year spread is not inverted. I think these days the sensational media, as well as the shrill political climate, seek to espouse the most ominous interpretation of every data point, despite generally positive economic data and despite the fact that the 3-month yield is driven by Fed actions while the 10-year is driven primarily by global market forces. And this perpetuates an unfounded cycle of fear and caution, at least until investors begin to realize that perhaps the boy has cried wolf a few too many times.
But the fear-laced headlines continue, and they can be self-fulfilling. Indeed, despite generally favorable numbers, the media talks incessantly about yield curve inversion and other signs of impending recession such that the University of Michigan sentiment index has suddenly fallen to its lowest level since January (which by the way is when the BAML positioning model triggered its previous contrarian buy signal, as I mentioned earlier). It’s as if the talking heads are deliberately trying to talk us into a recession by scaring the bejeezus out of the populace (aka electorate).
It would be more concerning if the inversion were caused by short-term rates rising faster than long-term rates (from an aggressively hawkish Fed), but instead all rates across the yield curve fell precipitously (with long rates falling the fastest). And as Jim Paulsen of Leuthold Group has pointed out, since 1950 we’ve had 10 recessions and all 10 were preceded by fiscal tightening (e.g., higher taxes), which is decidedly not the case today. Typically, if we are headed toward the end of an economic expansion, resources become scarce in an overheated economy leading to surging inflation so that the Fed has to swoop in to cool things off by raising rates and pulling liquidity out of the financial system. Clearly that’s not what’s happening today. To the contrary, we have quite low short-term rates, modest-but-positive growth and low inflation, and abundant liquidity with $1.3 trillion in excess bank reserves and rising M2 money supply (hitting a record $14.92 trillion last month), as the Fed has halted unwinding of its balance sheet of bonds. The real reason the curve is inverted is because long-term interest rates are extraordinarily low due to massive global demand for the safety and higher yields in the US.
My regular readers know that I have long predicted that US rates would continue to find a bid given the ultra-soft rates elsewhere and the global demand for safe yield, driven by the carry trade, aging demographics, and automatic strategic allocations to fixed income funds from a world awash in liquidity. In fact, when pressed last fall on a speaking trip, I suggested that the US 10-year at anything over 3.0% would catch a strong bid but agreed that it might reach as high as 3.20% before reversing – and indeed that’s about where it peaked, and it has been falling ever since.
The FOMC meets next week, and although CME Group fed funds futures are no longer showing 100% probability of another 25-bp rate cut, the odds are still strong at 80%, which would bring the rate down to the 1.75-2.00% range. By the January meeting, there’s a 68% chance of another cut, and a 28% chance of two more cuts that would bring the fed funds rate down to the 1.25-1.50% range.
I believe that the Fed did the right thing by listening to the market and unwinding some of their previous rate hikes to better approximate the elusive “neutral rate,” aka the natural rate of interest. As the bond experts at PIMCO opined, "The two most important secular drivers are demographics and technology. Rising life expectancy increases desired saving while new technologies are capital-saving and are becoming cheaper – and thus reduce ex ante demand for investment. The resulting savings glut tends to push the ‘natural’ rate of interest lower and lower.” Nevertheless, I think now, after the next rate widely expected next week, the Fed should refrain from further perpetuating the “race to the bottom” among central banks. Indeed, with most central banks having pretty much used up all their stimulus ammunition, today there is little choice other than to pass the baton back to their governments to enact meaningful fiscal stimulus – both tax reform and deregulation.
Central banks have few tools at their disposal, and as the saying goes, “When all you have is a hammer, every problem looks like a nail.” But there is already plenty of liquidity and the cost of debt is low enough to fund worthy projects. Ultra-low rates perpetuate a misallocation of capital to unproductive uses, in my view. For example, S&P reports that many small oil companies took on way too much cheap debt to fund marginal projects, and now face an enormous $137 billion that must be refinanced between 2020-2022. The real problem is not liquidity but uncertainty. The world is already overleveraged. For businesses to invest in their futures, they need some semblance of clarity about the future rules of the game to justify capital projects – which in turn generate solid returns that allow debt to be paid down. Then perhaps someday the Fed and other central banks can again try to normalize rates. One can only hope.
Solid outlook for GDP and corporate earnings, despite ongoing trade war:
As the trade war with China persists, it is evident that it is taking a massive toll on China’s growth. In another desperate attempt to staunch the slowdown, the PBOC said it would cut the reserve requirement ratio (RRR) for all banks for the seventh time since early 2018, which will free up 900 billion yuan in liquidity (or about $126 billion). This will help reduce business borrowing expenses, which had been rising with the new restrictions on riskier types of “shadow banking” or off-balance sheet financing, including “wealth management products” through trust companies. In addition, local governments will be allowed to issue “special purpose bonds” to offset the reduced revenues from the recent tax cuts and general economic slowdown. However, much like everywhere else around the developed world, the problem is not liquidity, which has been abundant, but rather it is weakening business and consumer confidence due to the intractable trade war.
In another subtle sign of desperation (on both sides, actually), China lifted tariffs on some US goods last week as an olive branch, and then President Trump responded by postponing some new tariffs that he had planned to impose on October 1 – also stating that he might be willing to accept an “interim” trade deal. This helped restore optimism and provide fuel to the fledgling risk-on rotation. However, Peter Navarro, one our lead negotiators, has listed what he called China’s “the seven deadly sins” that must be addressed in a final trade deal, including cyberattacks, forced technology transfer, IP theft, product dumping, subsidizing of state-owned enterprises, currency manipulation, and exports of fentanyl. So, the best we might be able to hope for in the near-term is that interim deal Trump mentioned, or at least a détente on tariffs.
Because ultimately, it seems to me that after several decades of rapidly growing more intertwined economically, but with China leveraging those nefarious trade practices outlined by Navarro to accelerate its amazing growth story, this trade war has fundamentally changed that direction to one in which we are now moving structurally apart. With China now challenging the US for economic, technological, and military strength and hegemony, there may be little choice for either side.
The Fed’s latest Beige Book indicates that the US economy is expanding at a “modest pace,” with agriculture and manufacturing cited as weak sectors, but it also said that the majority of business owners remain optimistic. We have low inflation, historically low interest rates, solid if not spectacular GDP growth, historically low unemployment, rising labor participation, 7 million unfilled jobs, slow but steady wage growth, vibrant retail sales, and strong consumer confidence. Median US household income has hit an all-time high, while the poverty rate has declined to its lowest level since 2001. M2 money supply continues to expand. Global capital flows to the strength and safety of the US, keeping the dollar strong. The TED Spread is a calm 17 bps (indicating very low risk of bank defaults or economic instability). At around $55, oil price sits comfortably in what I consider the Goldilocks range (between $40-80). Productivity has accelerated, growing at a 1.7% annualized rate since the start of 2018 and at a faster 2.9% annualized rate this year. And the latest AAII survey indicates bullish sentiment has fallen to 26.1%, and such low readings have proven to be a bullish contrarian indicator.
As for all the handwringing about contraction in manufacturing activity, Ian Shepherdson of Pantheon Macroeconomics recently noted: “It's entirely possible for manufacturing to be in recession – as it is now, and as it was from Q1 2015 through Q2 2016 – while GDP growth runs at 2% or more.… Manufacturing now accounts for only about 12% of GDP, 15% of capex, and less than 9% of payrolls.” Over the years, the US economy has gradually transitioned from manufacturing-driven to more services-driven, which is in much better shape. And whereas the ISM Manufacturing index dropped to 49.1, the ISM Services index surprised on the high side at an impressive 56.4.
First Trust recently observed that total US trade in goods and services as risen from $4.9 trillion in 2016 to $5.7 trillion over the past 12 months, an increase of 16.3% that is much faster growth than reflected in GDP, suggesting that global trade is robust in spite of the trade war. Evidently, supply chains are moving to compensate. This year alone, US imports from China are down -12.3% while imports from Vietnam are up +33.2%, Taiwan +20.2%, South Korea +9.8%, India +9.7%, and Mexico +6.3%.
As for US GDP, following Q1 growth of +3.1%, the BEA’s second estimate of Q2 growth (as of 8/29/19) is +2.0%. For 3Q2019, the Atlanta Fed’s GDPNow model issued an updated estimate (as of September 13) of 1.8% GDP growth, while the NY Fed’s NowCast sees 1.6% for Q3 (as of September 13) and 1.1% for Q4, and the St. Louis Fed NowCast sees a more robust 2.6%. Both the Atlanta and NY Fed models are calling for weaker Q3 growth versus the Blue Chip Economists consensus of 2.0%, but these estimates have been quite volatile given trade wars, Fed rate adjustments, and political winds. It is clear that the consumer must keep spending while we wait for business investment to kick back into gear, and the latter likely depends upon the trade negotiations.
FactSet’s summary of Q2 corporate earnings observes that the S&P 500 companies in aggregate reported a -0.4% decline in earnings (albeit on rising revenues), which is the second straight quarter of declining earnings. However, 75% of companies exceeded analyst consensus EPS estimates, but 88 companies (17%) issued negative forward guidance. Companies with higher domestic exposure have performed much better, and in particular, the Healthcare sector was the star performer, posting +9% aggregate earnings growth. Looking ahead to Q3, the forecast is for a continued struggle with an earnings decline of -3.6% (albeit on positive revenue growth of +2.9%). But for Q4 and beyond, the picture is brighter, with projected earnings growth of +3.4% (on revenue growth of 3.8%), and for full-year 2020, earnings growth of +10.7% (on revenue growth of 5.6%). For 2021, Bloomberg has indicated continued earnings growth in excess of +10%. This does not suggest to me either a recession or a bear market in equities.
According to FactSet, sell-side analysts are most optimistic on the Energy sector with the highest percentage (66%) of stocks holding Buy ratings and the largest expected earnings growth (30.2%) of all 11 sectors for CY 2020. But they are most pessimistic about the Consumer Staples sector with the lowest percentage (40%) of stocks holding Buy ratings and the highest percentage (12%) holding Sell ratings.
As a reminder, DataTrek recently pointed out that this year’s market has been looking a lot like the period from 2014-2016 when S&P 500 earnings was stuck right around $119/share and yet the index still rose +28% thanks primarily to falling interest rates, which supported a higher valuation multiple. Similarly, JP Morgan thinks the prevailing macro environment is similar to the 2015-2016 “mid-cycle” correction rather than to a late cycle climate, supported by the better earnings and robust buyback activity.
The 10-year TIPS breakeven has fallen to 1.63%, and the 5-year breakeven is 1.43%, both of which indicate little in the way of expected inflationary pressure (despite the latest core CPI year-over-year increase of 2.4%). Perhaps this isn’t surprising given the secular disinflation of new technologies and rising productivity. Although many smart investors, economists, and commentators see the potential for US inflation to rise due to tariffs, trade war impacts on production capacities, rising wages, etc., I still see persistent disinflationary pressure from new technologies, manufacturing efficiencies, and rising productivity. For example, when I was in the oil business at Chevron, I believed in “Peak Oil” theory in which global demand rises inexorably while reserves fall, pushing up oil price toward $200/bbl before “tight” formations like shale oil and tar sands became economically viable. But instead, technological innovation has found a way to make those hard-to-extract hydrocarbons viable at an oil price as low as $40.
From shale oil extraction to cloud computing, robotics, rideshare apps, and so forth, costs keep falling while capabilities keep growing. This, along with a highly indebted global economy that cannot easily absorb rising interest rates, suggests to me that low interest rates are indeed here to stay for the foreseeable future, which supports a higher forward valuation multiple than many long-time investors are comfortable with.
Summing it all up:
The economy remains solid, with expectations of strengthening corporate earnings growth. Despite a distorted yield curve caused by massive capital flows into the strength and safety of the US, the reality is that recessions are usually preceded by a hawkish Fed or surging oil prices, neither of which are in play. Corporate insiders recognize the attractive valuations, particularly among those neglected market segments, and are buying up shares with their own money. Moreover, the dividend yield on the S&P 500 is 1.82%, which exceeds the 10-year Treasury yield, and share buyback programs may approach $1 trillion again this year, according to BAML (so far, led by value-oriented Financial sector), which is 4% of the S&P 500 – implying a total returned capital yield to investors of 5.82%. IPO activity has been robust and on pace to be the most since 2014, according to Renaissance Capital. Bonds are pricey and are starting to see capital rotate into equities. And cash hordes are plentiful, while both hedge funds and individual investors are under-allocated to equities. It seems appropriate that the market is finally ready to look to the neglected market segments like value, cyclicals, and small-mid cap.
In fact, whenever optimism rises about a trade deal, investors have shown signs of readiness for a risk-on rotation. Jeff Saut, who until recently was the Chief Investment Strategist at Raymond James, thinks the market bottomed in August and that a breakout is “officially here.” Overall, he thinks “… we’re in the sixth inning … the secular bull market that we’re in … has years left to run….” He also thinks the market can support a forward P/E on the S&P 500 of 19x (versus the current 17.3x), given the low interest rate climate. I think 18x might be a more realistic target. Recall that it hit 18.5x at the start of 2018, following passage of Trump’s tax reform bill that had everyone excited about an imminent surge in capital investment.
My view has been that the August volatility provided investors with yet another buy-the-dip opportunity. Persistent investor preference for defensive sectors and mega-caps (at the expense of cyclical sectors and small-mid caps) as well as for US Treasuries (which has caused yields to plunge and flattened the yield curve) has been driven mostly by geopolitical uncertainty and a desperate desire among global investors for yield, which has driven up valuation multiples in defensive stocks and created a historically large relative valuation divergence between Low-Volatility/Defensive sectors and Value/Cyclicals, as described by JP Morgan’s Marko Kolanovic. But a gradual re-convergence of this historic divergence may have commenced last week, and when combined with the high cash balances and sky-high bond valuations that appear ripe for capital rotation (which, again, may have already commenced), it just might be the recipe for a powerful and sustainable risk-on rally.
As a reminder, David Brown and his team here at Sabrient don’t force cyclicals and small caps to be in our GARP portfolios, but rather our quantitative model identifies stocks having good earnings quality (and acceptable accounting practices) that are expected to achieve solid earnings growth while still selling at an attractive price – and those names tend to come from the cyclical sectors when we are in a growing economy. But fickle investor behavior has been common for much of the past 4 years – essentially since mid-2015 when the last presidential campaign commenced and the Fed began signaling its intentions to tighten (with the main exception being the 15 months of post-election risk-on rally from November 2016 until the February 2018 correction). Such behavior has allowed many quality companies with solid earnings growth expectations to fall to single-digit forward P/Es.
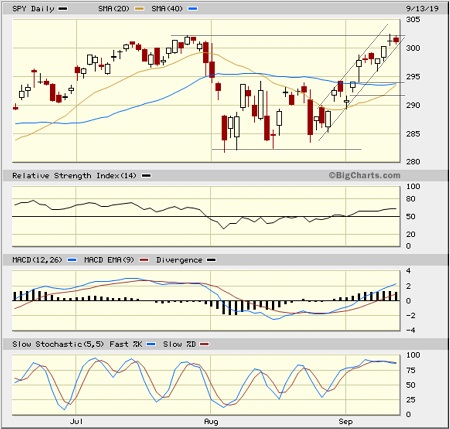
SPY Chart Review:
After a volatile August in which it tested the 282 support level multiple times, the SPDR S&P 500 ETF (SPY) has come roaring back to once again surpass psychological resistance at 300 and hit a new high of 302.46, before settling the week near 301. August saw extreme oversold conditions, and the risk-on rally in September has brought extreme overbought conditions. Oscillators RSI, MACD, and Slow Stochastics are all in overbought territory, and price is stretched well above its 20-day simple moving average (SMA). So, I think the SPY will need to pull back a bit to consolidate gains before a sustained breakout above that July high can take hold. If the pullback is significant, there are a couple of bullish gaps that might get filled down around 294 and 292, but recent minor support at 298 might be as far as it falls.
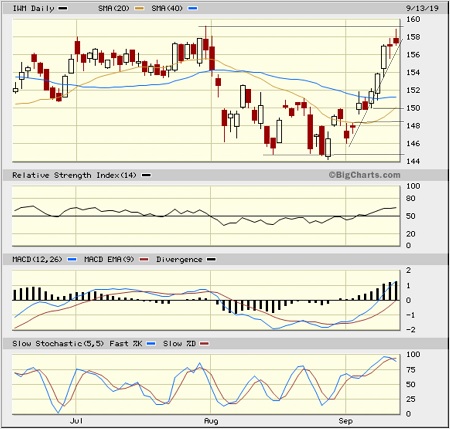
The iShares Russell 2000 small cap ETF (IWM) looks similar but even more stretched and overbought, as capital rotated in last week in a big way – the most in almost a year. Price is challenging the July high but is still 9% below its all-time high of 173.02 on 8/31/18. Oscillators are rolling over from severely overbought territory, and the bearish “shooting star” candlestick pattern on Friday suggests a pullback is in the cards and could bring price down to minor support at 154, 152 or even 150. There is also an open gap just above 148.
Latest Sector Rankings:
Relative sector rankings are based on our proprietary SectorCast model, which builds a composite profile of each of nearly 500 equity ETFs based on bottom-up aggregate scoring of the constituent stocks. The Outlook Score employs a forward-looking, fundamentals-based multifactor algorithm considering forward valuation, historical and projected earnings growth, the dynamics of Wall Street analysts’ consensus earnings estimates and recent revisions (up or down), quality and sustainability of reported earnings, and various return ratios. It helps us predict relative performance over the next 2-6 months.
In addition, SectorCast computes a Bull Score and Bear Score for each ETF based on recent price behavior of the constituent stocks on particularly strong and weak market days. A high Bull score indicates that stocks within the ETF recently have tended toward relative outperformance when the market is strong, while a high Bear score indicates that stocks within the ETF have tended to hold up relatively well (i.e., safe havens) when the market is weak.
Outlook score is forward-looking while Bull and Bear are backward-looking. As a group, these three scores can be helpful for positioning a portfolio for a given set of anticipated market conditions. Of course, each ETF holds a unique portfolio of stocks and position weights, so the sectors represented will score differently depending upon which set of ETFs is used. We use the iShares that represent the ten major U.S. business sectors: Financial (IYF), Technology (IYW), Industrial (IYJ), Healthcare (IYH), Consumer Goods (IYK), Consumer Services (IYC), Energy (IYE), Basic Materials (IYM), Telecommunications (IYZ), and Utilities (IDU). Whereas the Select Sector SPDRs only contain stocks from the S&P 500 large cap index, I prefer the iShares for their larger universe and broader diversity.
Here are some of my observations on this week’s scores:
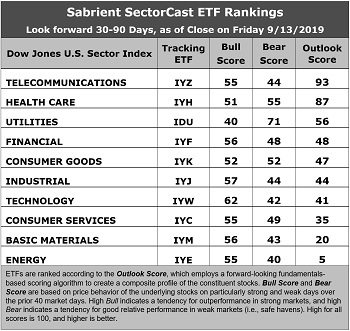
1. Telecom is in the top spot with an Outlook score of 93, primarily due to sell-side analyst upward revisions to EPS estimates and the lowest forward P/E (14.4x). It also displays strong return ratios and good insider sentiment (open market buying activity). (It is worth noting that over 43% of the IYZ ETF is made up of just two stocks: VZ and CSCO.) However, its pure GARP metrics are only average, with projected year-over-year EPS growth rate of 7.5% and a forward PEG ratio (forward P/E divided by projected EPS growth rate) of 1.92. Taking second is Healthcare with a score of 87, followed by Utilities, Financial, Consumer Goods (Staples/Noncyclical), Industrial, and Technology.
2. At the bottom of the rankings we find three cyclical sectors: Energy, Basic Materials, and Consumer Services, primarily because these sectors have seen significant net reductions to their earnings estimates from the sell-side analyst community. Notably, Energy no longer displays the best projected year-over-year EPS growth rate, as it has fallen to 9.3% due to a rash of analyst negative revisions, so its forward PEG has jumped up to 1.80.
3. Looking at the Bull scores, Technology enjoys the top score of 62, followed by Industrial at 57, as stocks within these sectors have displayed relative strength on strong market days. Defensive sector Utilities scores the lowest at 40. The top-bottom spread is a healthy 22 points, which reflects low sector correlations on strong market days. It is desirable in a healthy market to see low correlations reflected in a top-bottom spread of at least 20 points, which indicates that investors have clear preferences in the market segments and stocks they want to hold (rather than broad risk-on behavior).
4. Looking at the Bear scores, as usual we find defensive sector Utilities alone in the top spot with a score of 71, followed by Healthcare at 55, which means that stocks within these sectors have been the preferred safe havens lately on weak market days. Energy has the lowest score of 40, as investors have fled during recent market weakness. The top-bottom spread is 31 points, which reflects very low sector correlations on weak market days. Ideally, certain sectors will hold up relatively well while others are selling off (rather than broad risk-off behavior), so it is desirable in a healthy market to see low correlations reflected in a top-bottom spread of at least 20 points.
5. Healthcare displays the best all-around combination of Outlook/Bull/Bear scores, followed by Telecom, while Energy is the worst. Looking at just the Bull/Bear combination, Utilities is the best, followed by Healthcare. Actually, Healthcare displays the best balance between Bull and Bear scores, indicating superior relative performance (on average) in extreme market conditions (whether bullish or bearish). Energy scores the worst.
6. I would say this week’s fundamentals-based Outlook rankings now reflect a defensive bias, given that the bottom of the rankings is populated by cyclical sectors Energy, Materials, Consumer Services, and Technology, while defensive sectors Utilities and Consumer Goods are in the top five, along with all-weather Telecom and Healthcare. Keep in mind, the Outlook Rank does not include timing, momentum, or relative strength factors, but rather reflects the consensus fundamental expectations at a given point in time for individual stocks, aggregated by sector.
ETF Trading Ideas:
Our Sector Rotation model, which appropriately weights Outlook, Bull, and Bear scores in accordance with the overall market’s prevailing trend (bullish, neutral, or defensive), moved back to a bullish bias during the latest rally and suggests holding Telecom (IYZ), Industrial (IYJ), and Healthcare (IYH), in that order. (Note: In this model, we consider the bias to be bullish from a rules-based trend-following standpoint when SPY is above both its 50-day and 200-day simple moving averages.)
Besides iShares’ IYZ, IYJ, and IYH, other highly-ranked ETFs in our SectorCast model (which scores nearly 500 US-listed equity ETFs) from the Telecom, Industrial, and Healthcare sectors include SPDR S&P Telecom (XTL), First Trust RBA American Industrial Renaissance (AIRR), and VanEck Vectors Pharmaceutical (PPH).
If you prefer a neutral bias, the Sector Rotation model suggests holding Telecom, Healthcare, and Utilities, in that order. On the other hand, if you are more comfortable with a defensive stance on the market, the model suggests holding Utilities, Healthcare, and Telecom, in that order.
An assortment of other interesting ETFs that are scoring well in our latest rankings include iShares Nasdaq Biotech (IBB), Arrow QVM Equity Factor (QVM), WBI BullBear Yield (WBIG), SPDR MFS Systematic Growth Equity (SYG), Alps Alerian MLP (AMLP), iShares Global Healthcare (IXJ), VanEck Vectors Uranium Nuclear Energy (NLR), First Trust Dow Jones Select MicroCap (FDM), SPDR S&P Homebuilders (XHB), iShares US Insurance (IAK), and Direxion All Cap Insider Sentiment (KNOW, which tracks a Sabrient index).
IMPORTANT NOTE: I post this information periodically as a free look inside some of our institutional research and as a source of some trading ideas for your own further investigation. It is not intended to be traded directly as a rules-based strategy in a real money portfolio. I am simply showing what a sector rotation model might suggest if a given portfolio was due for a rebalance, and I do not update the information on a regular schedule or on technical triggers. There are many ways for a client to trade such a strategy, including monthly or quarterly rebalancing, perhaps with interim adjustments to the bullish/neutral/defensive bias when warranted, but not necessarily on the days that I happen to post this article. The enhanced strategy seeks higher returns by employing individual stocks (or stock options) that are also highly ranked, but this introduces greater risks and volatility. I do not track performance of the ideas mentioned here as a managed portfolio.
Disclosure: At the time of this writing, the author held both long and short options on the SPY and IWM (long-term bullish, short-term bearish) and a short position on the TLT.
Disclaimer: This newsletter is published solely for informational purposes and is not to be construed as advice or a recommendation to specific individuals. Individuals should take into account their personal financial circumstances in acting on any opinions, commentary, rankings, or stock selections provided by Sabrient Systems or its wholly owned subsidiary Gradient Analytics. Sabrient makes no representations that the techniques used in its rankings or analysis will result in or guarantee profits in trading. Trading involves risk, including possible loss of principal and other losses, and past performance is no indication of future results.