Sector Detector: Tech and Healthcare lead a surging market to new heights
 By Scott Martindale
President, Sabrient Systems LLC
July lived up to its history as a typically solid month for stocks, and 2H2017 is off to a strong start. Technology and Healthcare sectors continue to be the year-to-date leaders, and lately Utilities has gotten into the act on an income play as interest rates stay low. Large cap, mid cap, and small cap indices all continue to set all-time closing highs, while the CBOE Volatility Index (VIX) hit an all-time low last week. The 22,000 level on the Dow was just surpassed on a closing basis on Wednesday, and the 2,500 level on the S&P 500 beckons. Nasdaq has now shown positive performance in 11 of the past 13 months, so a little retrenchment is no surprise – if for no other reason but to take a breather and let other market segments play catch-up.
Although there are of course worrisome issues everywhere you look, the good news is that the global economy is strengthening, the Fed and other central banks are taking pains not to screw things up on their paths to “normalization,” and as a successful Q2 earnings season winds down, a weaker dollar should lead to a better Q3 than is currently forecasted. So, I would say that on balance, things continue to look encouraging. But as valuations in the mega caps (e.g., FAAMG) continue to rise, it finally may be time for small caps to seize the baton and start to outperform.
In this periodic update, I give my view of the current market environment, offer a technical analysis of the S&P 500 chart, review Sabrient’s weekly fundamentals-based SectorCast rankings of the ten U.S. business sectors, and then offer up some actionable ETF trading ideas. In summary, our sector rankings still look bullish, while the sector rotation model maintains its bullish bias, and the climate overall still seems favorable for risk assets like equities. However, while I was optimistic about solid market performance going into July, I think August might be a different story if the new levels of psychological resistance fail to break and volatility rears its head in this typically-languid month. Read on....
Market overview:
Overall, the signs are positive for stocks and only a significant rise in short-term interest rates leading to an inverted yield curve or a marked deterioration in corporate earnings would suggest an imminent end to the bulls’ party. Let’s explore the likelihood of these eventualities.
With about 60% of the S&P 500 companies having announced 2Q2017 results, 71% have beaten analyst consensus top-line estimates and 73% have beaten earnings estimates. Average year-over-year sales growth is 5.0% (with a big boost from the Energy sector), and average YOY earnings growth is 10.8%. We are seeing how a weaker dollar can support organic sales and earnings growth. The Technology and Healthcare sectors have been the leaders, at least partly due to investors seeking market segments that can thrive with or without fiscal stimulus.
Technology is up +21.4% YTD through Wednesday, followed by Healthcare at +15.6%, while Energy is the worst at -12.9%. Apple (AAPL) certainly continues to set the world on fire, posting stellar revenue growth and getting a nice pop (and it is +35.7% YTD). Tech is the only sector that is expected to see double-digit growth, and yet overall it still isn’t too overvalued in comparison with the broad market, with the exception of a few names. Just when you think it can’t continue its torrid growth rate, it surprises. Still, like many of the mega-caps, one would think that the law of large numbers will eventually slow the rate of growth (as one would expect for China’s growth rate).
One such name is Amazon.com (AMZN), which sports a trailing P/E of 187 and a forward P/E of 88 while ploughing its own unique path of destruction in search of world dominance, with Jeff Bezos playing the role of Dr. Evil (from the Austin Powers movie). Although it has been struggling to regain the $1,000 price level and its 50-day simple moving average since falling below both after a disappointing earnings report and forward guidance, Amazon has been laying waste to the retail sector with its take-no-prisoners scorched-earth policy of gobbling up market share no matter the cost, and it is up +32.8% YTD.
Remember when big box stores and discounters like Walmart (WMT), Costco (COST), Target (TGT), and Home Depot (HD) first came on the scene and the public lamented how they were savagely wiping out the mom-and-pop retailers? Amazon puts them all to shame in this regard. I saw some statistics on announced retail store closures this year alone from Business Insider. They counted 6,375 closure announcements in 2017, including 1,430 Radio Shacks and 808 at Payless, plus the likes of Gymboree, The Limited, Kmart, Gamestop, JCPenney, Sears, Staples, and Macy’s, among others. Next, Amazon has targeted the grocery business with its acquisition of Whole Foods Market (WFM), and some are suggesting that the juggernaut may soon test the competitive moat that Ulta Beauty (ULTA) has established.
Then there is the distressing drop in sales among automakers, when comparing monthly sales this year to last year’s. For example, Ford Motor (F) saw a -7.5% drop in July sales versus July 2016, including -7% in trucks and -19% in cars. This is one upset that can’t be blamed on the Amazon effect, in which sales are simply shifting from one retailer to Amazon. On the other hand, many chalk up the fall to the “hangover” after the buying spree from the pent-up demand and the extreme sales incentives being offered. But what can’t be ignored is the likely impact on middle America of the growing wealth gap and lack of wage inflation brought about by our singular reliance on monetary stimulus (and its associated asset inflation) to prop up the economy without complementary fiscal stimulus.
Sabrient’s wholly-owned subsidiary Gradient Analytics, a forensic accounting and earnings quality research firm, has written a number of negative reports this year on firms from the retail and apparel industry. These reports are sent to a clientele of mostly long/short hedge funds that might put short positions on these names. But it’s not that Gradient has made a top-down macro call on the retail industry like an activist short-seller might. Rather, the firm’s bottom-up process – identifying things like outsized growth in receivables and inventories relative to sales, along with fundamental drivers that suggest these issues might worsen in the near term – continues to flag names in this space.
Other worries include the sudden weakness in the Dow Transportation Average. After hitting an all-time high on July 14, it has since fallen nearly -7% in precipitous fashion, cutting straight through its 50-day and 100-day simple moving averages like they offered no support at all, and now seeking support from the critical 200-day. Its -3.5% overall July performance was its worst month since the Brexit vote in June 2016. Also, the US dollar continues to fall and is now at levels not seen since 2014. This is the dollar’s longest losing streak since 2011 when S&P downgraded US debt on the budget impasse. In addition, credit card companies (including many banks) may be feeling nervous as their net charge-off rate has been rising for several quarters, reaching its highest level in four years. Despite the increase, it still sits at only 3.3% -- well below the peak of 10% (in 2010).
Of course, political dysfunction and backstabbing continues, with disgraceful pandering by the media to the fringe elements of the political spectrum in search of ratings, and with too much focus on conspiracy theories and special prosecutors – to the detriment of the enactment of pro-growth fiscal policies that might actually help the average American who is struggling with stagnant wages, too much debt and tax burden, and too little in the way of appreciating assets.
And then we have the many other intractable problems here at home and around the world, like ICBM launches from North Korea, heated rhetoric/sanctions with both Russia and China, suffocating municipal and corporate pension liabilities, health care in turmoil, a looming crisis with the federal budget and debt ceiling, crumbling US infrastructure, the daily threat of global terrorism, Venezuela moving toward civil war, and the growing credit bubble in China. Talk about a market climbing a “Wall of Worry.”
Speaking of China, its National Bureau of Statistics announced that GDP expanded at a 6.9% annual rate in Q2. This acceleration in growth was boosted by a surge in both exports and imports, so for now, all appears to be well. Nonetheless, I continue to see China as the primary risk factor to the global economy, given the ever-growing credit bubble and the threat of a large currency devaluation at some point. The Chinese government instituted stricter capital controls to prevent outflows, reducing pressure on its currency. As the country’s total debt-to-GDP rises and ROI continues to fall, its economy requires accelerating credit growth just to maintain its GDP growth rate. This has already contributed to increased volatility in the currency markets … while US stock market volatility remains at historic lows.
The CBOE Market Volatility Index (VIX), aka fear gauge, closed July at 10.07 after hitting an all-time low 8.84 the prior week. The slow but steady melt-up in stocks has led to the lowest sustained volatility in 24 years. Although such complacency can persist for a long time, I will continue to warn that as an oscillator, VIX will eventually spike again.
The 10-year Treasury closed Wednesday at 2.25%. Compare this to the 2.30% it yielded on Dec 16, 2015 when the first rate hike was enacted. On the short end of the yield curve, the 2-year closed at 1.35%. A popular way to measure the slope of the yield curve is the 2-10 spread, and that spread is now 90 bps, which is still well under the 100-bps threshold and the 101 bps on Election Day, not to mention the relatively steep 136 bps spread achieved after the November election.
At the June FOMC meeting, the Fed raised interest rates by another quarter point, updated its “dot plot” to suggest another rate hike later this year (and perhaps three more next year), and laid out a detailed plan to start unwinding its massive balance sheet of debt securities later this year. The meeting minutes suggested that participants are also worried about financial instability created by persistently low interest rates, rather than solely focusing on unemployment and inflation. Then at the latest meeting in July, the Fed made no changes to interest rates and virtually no change to its previous statement about economic conditions and its plan for “renormalization.” CME fed funds futures now place the odds of the next rate hike coming at the September meeting at virtually zero, but it rises to 44% by December (down from 58% just one month ago), and only a 2% likelihood of seeing two more rate hikes this year.
Still, even one rate hike puts upward pressure on the short end of the curve, while global demand for U.S. Treasuries is likely to remain strong, putting downward pressure on the long end of the curve, which is why the Fed is likely to start unwinding its $4.5 trillion balance sheet after its next meeting on September 20 to put some offsetting upward pressure on long-term rates and try to prevent the yield curve from flattening. This should result in a somewhat tighter monetary policy, but the economy should continue to grow so long as the Fed takes it slow and easy. The Fed’s intention is to take 5+ years to reduce the balance sheet to $2.5 trillion, which is about as low as it can go to still meet global currency demand. Other global central banks have discussed a similar intention toward normalization and a tightening bias.
Bond guru Bill Gross said the other day that a highly-levered economy must not be confronted with a flattening yield curve, and he thinks the Fed is onboard with that. He doesn’t think the planned slow pace of unwinding will have much impact on longer term rates. Indeed, despite the Fed’s announced intentions, long-term Treasury yields remain persistently low from a historical perspective, which has been supportive of equity valuations. On the other hand, highly-respected and widely-followed portfolio manager and prognosticator Jeffrey Gundlach of DoubleLine Capital has essentially called a bottom in Treasury yields, with an expectation that the 10-year will rise toward 3% this year and hit 6% by the next presidential election in 2020. Part of his reasoning likely accounts for QE programs globally starting to be reined in, thus reducing the profitability of the carry trade. Nevertheless, I still think it is likely that a careful Fed will mean that short-term interest rates remain quite low for the foreseeable future while long-term interest rates stay range-bound near current levels.
Credit spreads, which measure the difference between “risk-free” Treasury yields and the yields of other fixed income investments of similar duration (like high yield, for instance), are tight from a historical standpoint. But there are many reasons other than pure complacency for the tighter spreads. While the market has grown from about $950 billion at the end of 2008 to $1.6 trillion today, the overall quality of high-yield bonds has improved significantly. Rather than LBO firms, larger companies with stronger credit profiles have become the most active issuers such that LBOs have fallen from 25% to 5% of the market. Many of these higher-quality companies are publicly traded, and more than half of the new issuances in the past two years has been rated BB or better. Also, high-yield capital structures are usually simpler today, and most companies borrow either through bank loans or high-yield bonds, but not both like they did in the past.
A weaker U.S. dollar, improving crude oil, and natural gas production were cited as the primary reasons that industrial production has risen for five straight months. The Conference Board announced that consumer confidence rose to 121.1 in July (up from a revised 117.3 in June), which is the second highest reading for consumer confidence since 2000. State Street Investor Confidence leapt from 101.0 to 108.9. PMI reports have been strong, reflecting accelerating rates of production and hiring as the capacity of manufacturers and service providers is challenged. And the Atlanta Fed's GDPNow model just announced a real GDP growth forecast for Q3 of 4.0%.
Notably, the investment team at JP Morgan Asset Management has suggested that the US economy is “entering the later stages of an economic cycle.” But to me, the slow growth of the past 8 years, inhibited by the lack of fiscal stimulus and our sole reliance on monetary policy, has created an unusual situation in which the economic cycle may still be quite young, as corporate earnings are finally getting into gear, and will only strengthen if and when fiscal stimulus is enacted (e.g., tax cuts, regulatory reform, infrastructure spending).
I have written often about the undesirable impacts of our singular reliance on Fed monetary policies like ZIRP and QE for the past several years – including a recession in capex, asset inflation without wage inflation, the widening wealth gap, class warfare, and a dangerous populist movement – without any complementary pro-growth fiscal stimulus. The one silver lining is that our economy may still be in the early expansion phase of the business cycle, just plodding along on the back of asset inflation while awaiting the next stage of earnings-driven growth, which finally seems to be underway. Thus, an extended expansion cycle, with a lack of inflation keeping the Fed at bay, is one benefit of our sluggish but steady growth since 2009, and the peak phase of the business cycle (which would generally foreshadow a recession) may still be years away. Nearly all recessions in the U.S. have started with the Fed over-tightening monetary policy. If the Fed continues to be patient on its path toward normalization, the current business cycle may continue for years. The Conference Board Leading Economic Index (LEI) offers some corroborating evidence, having recently moved above its previous peak, which has historically indicated that a recession is years away.
Stocks continue to be supported by persistently low interest rates, record share buybacks, solid economic reports, and continued organic growth in corporate earnings. But even without fiscal stimulus, year-over-year corporate EPS growth has been robust (in the 10-12% range) such that prices can still increase without further multiple expansion. Moreover, M&A activity has been robust, with some of the biggest takeovers so far this year including $49 billion for Reynolds America (RAI), $24 billion for C.R. Bard (BCR), $17.9 billion for Mead Johnson (MJN), $15.3 billion for Mobileye (MBLY), $13.7 billion for Whole Foods Market (WFM), $7.5 billion for Panera Bread (PNRA), and $6.9 billion for Staples (SPLS), among others.
Smart beta strategies (aka, strategic beta), including position weightings based on factors like value, quality, minimum volatility, yield, or momentum, continue to gain investor interest, particularly in the form of ETFs. The low volatility climate has led to underperformance so far this year in the minimum-volatility factor strategies, as well as in yield and value factors, while momentum has been quite strong so far in 2017, as you might have noticed.
The outperformance of growth stocks relative to value this year has gotten extreme by historical standards, and it is rare to have this much divergence, as mean reversion is a powerful force. My view is that so long as the business cycle has plenty of room to run, as I think it does, investors will favor growth at a reasonable price, which seeks both attractive “forward value” and strong growth expectations, e.g., a modest forward P/E and a low forward PEG (ratio of forward P/E to forward EPS growth rate). This happens to be Sabrient’s preferred approach to stock-picking.
It remains to be seen whether small caps can outperform without the benefits of fiscal stimulus, particularly tax and regulatory reform. If July is any indication, the internal rotation within the bull market is making its way in fits and starts, with small caps showing signs that they want to seize the baton and lead the “next leg up,” as a follow-up to their initial post-election surge. But the reality is that a lack of fiscal stimulus (which could help break down the “moat” enjoyed by large caps) and the weak dollar both tend to favor larger multinationals.
You may have heard about the JPMorgan Chase earnings call and the comments made by CEO Jamie Dimon. He said, “We’ve been growing at 1.5 to 2% in spite of stupidity and political gridlock, because the American business sector is powerful and strong … it would be much stronger growth had we made intelligent decisions and were there not gridlock.” Moreover, he asserted that the US has become “one of the most bureaucratic, confusing, litigious societies on the planet” – to the detriment of the average American citizen and our country’s economic growth.
For my part, I do not expect that the press and the Hollywood elite will back off of their attacks on the President. Their personal fortunes do not rely on enactment of pro-growth fiscal stimulus. Rather they actually benefit from stirring up political chaos, gaining lots of attention, viewers, and Twitter followers. Nor do I expect the President to stop his counter-attacks and Twitter rants, as that is his unfortunate nature – of which the electorate was well aware from the beginning. But my hope is that average Americans will stop feeding the shark frenzy and instead demand that Congress – on both sides of the aisle – works together to institute some of the stimulus policies the new Administration (warts and all) is trying to implement, because that would indeed serve them well.
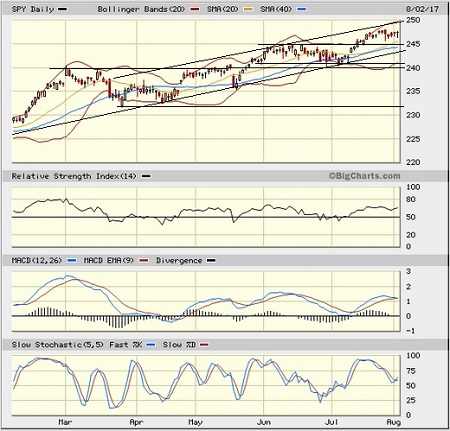
SPY chart review:
The SPDR S&P 500 ETF (SPY) closed Wednesday at 247.44 and has the 250 level (corresponding to 2,500 on the S&P 500) in its sights. After breaking through tough psychological resistance at 240 (corresponding to 2,400 on the S&P 500 index) in late May, it went into a 6-week sideways channel before gathering bullish conviction to break through 245. As I expected, the bearish head-and-shoulders pattern that some chartists read did not manifest. Oscillators RSI, MACD, and Slow Stochastic all suggest higher prices in the near term, but will likely need to retrench soon. The 20-day simple moving average has been providing solid support, while Bollinger Bands have widened to the point that some consolidation is likely coming up, as I would expect in a typical August. My expectation of a move to the upside during the typically bullish month of July panned out, but the dog days of August likely will limit a major upside breakout – especially if small caps are not leading the charge. Support levels include the 20-day SMA (approaching 246), and the convergence of the 50-day SMA with breakout resistance-turned-support at 245, the rising long-term uptrend line around 244, followed by the 100-day SMA near 240, a minor low at 235, and the critical 200-day SMA (around 233). Overall, the technical picture continues to look promising.
Latest sector rankings:
Relative sector rankings are based on our proprietary SectorCast model, which builds a composite profile of each of over 600 equity ETFs based on bottom-up aggregate scoring of the constituent stocks. The Outlook Score employs a forward-looking, fundamentals-based multifactor algorithm considering forward valuation, historical and projected earnings growth, the dynamics of Wall Street analysts’ consensus earnings estimates and recent revisions (up or down), quality and sustainability of reported earnings, and various return ratios. It helps us predict relative performance over the next 1-3 months.
In addition, SectorCast computes a Bull Score and Bear Score for each ETF based on recent price behavior of the constituent stocks on particularly strong and weak market days. High Bull score indicates that stocks within the ETF recently have tended toward relative outperformance when the market is strong, while a high Bear score indicates that stocks within the ETF have tended to hold up relatively well (i.e., safe havens) when the market is weak.
Outlook score is forward-looking while Bull and Bear are backward-looking. As a group, these three scores can be helpful for positioning a portfolio for a given set of anticipated market conditions. Of course, each ETF holds a unique portfolio of stocks and position weights, so the sectors represented will score differently depending upon which set of ETFs is used. We use the iShares that represent the ten major U.S. business sectors: Financial (IYF), Technology (IYW), Industrial (IYJ), Healthcare (IYH), Consumer Goods (IYK), Consumer Services (IYC), Energy (IYE), Basic Materials (IYM), Telecommunications (IYZ), and Utilities (IDU). Whereas the Select Sector SPDRs only contain stocks from the S&P 500, I prefer the iShares for their larger universe and broader diversity.
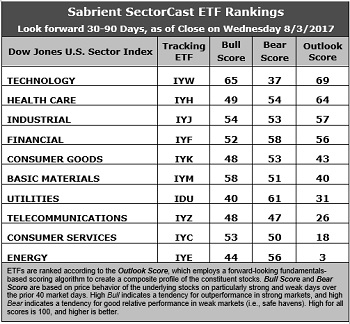
Here are some of my observations on this week’s scores:
1. Technology still sits in the top spot with an Outlook score of 69, which is low for the top-ranked sector. In aggregate, Technology displays one of the best long-term EPS year-over-year growth rates of 15.2%, positive Wall Street sell-side analyst sentiment (i.e., net positive revisions to EPS estimates), the highest return ratios, a forward P/E of about 17.7x, and a low forward PEG of 1.17 (ratio of forward P/E to forward EPS growth rate). Healthcare remains in the second spot due to its positive Wall Street sentiment, decent return ratios, the lowest forward P/E of 16.6x, and an attractive forward PEG of 1.57. Rounding out the top six are Industrial (forward P/E of 19.0x and forward PEG of 1.71), Financial (forward P/E of 16.9x and forward PEG of 1.58), Consumer Goods (Staples/Noncyclical), and Basic Materials.
2. Energy and Consumer Services (Discretionary/Cyclical) sit in the bottom two with Outlook scores of 3 and 18, respectively. Energy displays weak scores across the board, with the exception of long-term EPS year-over-year growth rate of 25.7% on weak comps and the lowest forward PEG of 1.06. Otherwise, the sector displays the weakest analyst sentiment (i.e., solidly negative earnings revisions), the highest forward P/E of 27.3x, weak return ratios, and the worst insider sentiment (net open market buying). Consumer Services displays weak Wall Street sentiment, a high forward P/E of 20.2x, and weak insider sentiment.
3. Looking at the Bull scores, Technology boasts the top score of 65, followed by Materials at 58, as they have displayed relative strength on strong market days, while Utilities is the lowest at 40. The top-bottom spread is 25 points, which reflects low sector correlations on strong market days, which is favorable for stock picking. It is desirable in a healthy market to see low correlations reflected in a top-bottom spread of at least 20 points, which indicates that investors have clear preferences in the market segments and stocks they want to hold (rather than broad risk-on behavior).
4. Looking at the Bear scores, we find Utilities at the top with a score of 61, followed by Financial at 58, which means that stocks within these sectors have been the preferred safe havens lately on weak market days. The retrenchment in Technology has given it the lowest score at 37, as investors have fled during market weakness. The top-bottom spread is 24 points, which reflects low sector correlations on weak market days, which is favorable. Ideally, certain sectors will hold up relatively well while others are selling off (rather than broad risk-off behavior), so it is desirable in a healthy market to see low correlations reflected in a top-bottom spread of at least 20 points.
5. Technology displays the best all-around combination of Outlook/Bull/Bear scores, while Energy is the worst. Looking at just the Bull/Bear combination, Financial is the best, followed closely by Materials, indicating superior relative performance (on average) in extreme market conditions (whether bullish or bearish), while Telecom by far scores the worst, as investors have generally avoided the sector recently.
6. This week’s fundamentals-based Outlook rankings reflect a solidly bullish bias, given that five of the top six sectors (by ordinal rank) are economically-sensitive or all-weather (Technology, Healthcare, Industrial, Financial, and Materials). But on the other hand, I am concerned about the low magnitude of the Outlook scores (all are below 70), which doesn’t reflect as much conviction. Keep in mind, the Outlook Rank does not include timing, momentum, or relative strength factors, but rather reflects the consensus fundamental expectations at a given point in time for individual stocks, aggregated by sector.
ETF Trading Ideas:
Our Sector Rotation model, which appropriately weights Outlook, Bull, and Bear scores in accordance with the overall market’s prevailing trend (bullish, neutral, or defensive), displays a bullish bias and suggests holding Technology (IYW), Basic Materials (IYM), and Industrial (IYJ), in that order. (Note: In this model, we consider the bias to be bullish from a rules-based trend-following standpoint when SPY is above both its 50-day and 200-day simple moving averages.)
Besides iShares’ IYW, IYM, and IYJ, other highly-ranked ETFs in our SectorCast model (which scores over 600 US-listed equity ETFs) from the Technology, Materials, Industrial sectors include PowerShares Dynamic Semiconductors Portfolio (PSI), First Trust Materials AlphaDEX Fund (FXZ), and PowerShares Dynamic Building & Construction Portfolio (PKB).
If you prefer a neutral bias, the Sector Rotation model suggests holding Technology, Healthcare, and Industrial, in that order. On the other hand, if you are more comfortable with a defensive stance on the market, the model suggests holding Financial, Utilities, and Healthcare, in that order.
By the way, an assortment of other unique ETFs that happen to score well (Outlook scores above 90) in our latest rankings include iShares Mortgage Real Estate Capped (REM), PowerShares Dynamic Pharmaceuticals Portfolio (PJP), ALPS Buzz US Sentiment Leaders (BUZ), First Trust NASDAQ ABA Community Bank Index (QABA), iShares US Home Construction (ITB), PureFunds ISE Mobile Payments (IPAY), AlphaMark Actively Managed Small Cap (SMCP), WBI Tactical SMY Shares (WBIC), First Trust Dow Jones Select MicroCap Index Fund (FDM).
IMPORTANT NOTE: I post this information periodically as a free look inside some of our institutional research and as a source of some trading ideas for your own further investigation. It is not intended to be traded directly as a rules-based strategy in a real money portfolio. I am simply showing what a sector rotation model might suggest if a given portfolio was due for a rebalance, and I may or may not update the information on a regular schedule. There are many ways for a client to trade such a strategy, including monthly or quarterly rebalancing, perhaps with interim adjustments to the bullish/neutral/defensive bias when warranted, but not necessarily on the days that I happen to post this article. The enhanced strategy seeks higher returns by employing individual stocks (or stock options) that are also highly ranked, but this introduces greater risks and volatility. I do not track performance of the ideas mentioned here as a managed portfolio.
Disclosure: The author has no positions in stocks or ETFs mentioned.
Disclaimer: This newsletter is published solely for informational purposes and is not to be construed as advice or a recommendation to specific individuals. Individuals should take into account their personal financial circumstances in acting on any opinions, commentary, rankings, or stock selections provided by Sabrient Systems or its wholly-owned subsidiary Gradient Analytics. Sabrient makes no representations that the techniques used in its rankings or analysis will result in or guarantee profits in trading. Trading involves risk, including possible loss of principal and other losses, and past performance is no indication of future results.