Sector Detector: Bulls seek entry point to launch year-end rally
 The U.S. stock market has been reluctant to provide eager bulls with a tasty entry point ahead of the much anticipated year-end rally. Although the major indexes have seen fit to consolidate a bit and work off some of their overbought conditions, bulls have hoped for a something more substantial. But very few holders are selling these days.
As I have written recently, my hope at this point in the market uptrend is that the “junk rally” phase led by lower quality companies is ready to give way to more appropriate leadership from the strongest and highest quality firms. If so, this means that we might not see much in the way of huge market updrafts and instead have to settle for modest gains in a more halting progression.
It is interesting to look at some other markets and asset classes. For example, the iShares MSCI Emerging Markets (EEM) and iShares 20+ Year Treasury Bond ETF (TLT) both fell hard in May and June, and then recovered rapidly during September and October. But this month, both have weakened considerably. Volatility has been much more pronounced in these markets, compared with the virtually monotonic path of U.S. stocks.
The Fed remains firmly in the stock market’s corner. In her prepared remarks for Thursday’s testimony before Congress, nominee Fed Chairman Janet Yellen intends to stay the course with a monetary policy of intervention, “I believe that supporting the recovery today is the surest path to returning to a more normal approach to monetary policy.” I expect bulls will embrace this sentiment.
Individual investors are coming onboard, too. The AAII reported that 45% of individual investors are bullish on stocks, versus the longer-term average of 39%. $76 billion has flowed into U.S. stocks, which is the highest for any year since 2004 -- although investors redeemed $7.5 billion last week during the consolidation period, particularly from Financial and Technology sectors.
High equity correlations are once again a concern. ConvergEx noted in their Morning Briefing this week that the average correlation for the ten S&P 500 sectors was 87% over the past month versus 82% last month and 70% three months ago, while precious metals, fixed income, and currencies have been closer to their norms. Their verdict: “Healthy markets have falling/lower correlations than currently on offer…” This is also reflected in Sabrient’s Bull and Bear scores, as discussed below, which is a bit concerning for the longer term.
But for now, I fully expect the widely anticipated market rally to materialize on schedule. looking forward, we have a dovish Fed, strengthening business and consumer spending, the promise of improving earnings and GDP growth, rising housing prices, and wide skepticism about high equity valuations and P/E multiples.
The SPY chart: The SPDR S&P 500 Trust (SPY) closed Wednesday at 178.38, which is yet another all-time high. It has been holding above all its major simple moving averages as investors have been reluctant to sell. In fact, the 20-day SMA has been serving as strong support during this consolidation period, which has managed to work off some of the overbought conditions without any kind of pullback. The long-standing bullish rising channel remains in play, and the SPY is again challenging resistance at the top of the channel.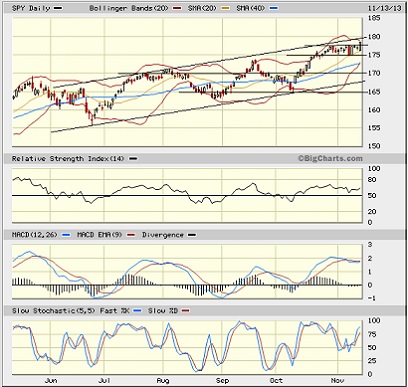
Oscillators RSI and MACD have flat-lined in overbought territory and Slow Stochastic turned back up after a brief attempt to cycle back down, while Bollinger Bands have pinched back together and could be indicating an imminent breakout. On Wednesday, SPY closed above the small sideways channel of consolidation covering the past couple of weeks, so the breakout might be underway already.
The CBOE Market Volatility Index (VIX), a.k.a. “fear gauge,” closed Wednesday at 12.52, which is back near its historic lows. No investor fear anywhere to be found.
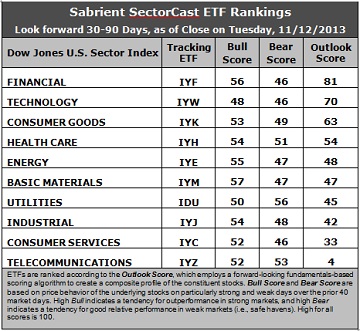
Latest rankings: The table ranks each of the ten U.S. business sector iShares ETFs by Sabrient's proprietary Outlook Score, which employs a forward-looking, fundamentals-based, quantitative algorithm to create a bottom-up composite profile of the constituent stocks within the ETF. The multi-factor model considers forward valuation, historical earnings trends, earnings growth prospects, the dynamics of Wall Street analysts' consensus estimates, accounting practices and earnings quality, and various return ratios. In addition, the table also shows Sabrient's proprietary Bull Score and Bear Score for each ETF.
High Bull score indicates that stocks within the ETF have tended recently toward relative outperformance during particularly strong market periods, while a high Bear score indicates that stocks within the ETF have tended to hold up relatively well during particularly weak market periods. Bull and Bear are backward-looking indicators of recent sentiment trend.
As a group, these three scores can be quite helpful for positioning a portfolio for a given set of anticipated market conditions.
Observations:
1. Financial (IYF) stays at the top spot this week with an Outlook score of 81. IYF displays one of the lowest forward P/Es -- along with Energy (IYE) – and relatively good sentiment among both Wall Street analysts and company insiders (i.e., open-market buying). Technology (IYW) remains in second place with a score of 70. IYW still displays one of the lowest forward P/Es, one of the strongest long-term forward growth rates, and the best return ratios; however, sentiment remains problematic among Wall Street analysts and insiders, alike. Analysts have been downgrading earnings projections. In third place with a score of 63 is Consumer Goods (IYK), followed by Healthcare (IYH), which has recovered somewhat in the rankings. Energy (IYE) rounds out the top five.
2. Telecom (IYZ) is in the cellar yet again with an Outlook score of 4. IYZ scores the lowest in all factors in the model, including the highest forward P/E, lowest return ratios, a low projected long-term growth rate, and poor sentiment among insiders and Wall Street analysts. There has been a rash of earnings downgrades from the sell-side. Consumer Services (IYC) remains in the bottom two with an Outlook score of 33.
3. This week’s fundamentals-based rankings have some minor shuffling but still reflect a mostly bullish bias, with Financial and Tech at the top. But the rise of Healthcare at the expense of Industrial is not so bullish, so it appears the rankings reflect some renewed concern about valuations.
4. Looking at the Bull scores, Basic Materials (IYM) has been the leader on particularly strong market days, scoring 57, followed closely by Financial (IYF). Technology (IYW) is still the only one scoring under 50. The top-bottom spread is only 9 points, which indicates relatively high sector correlations (all-boats-lifted buying) on particularly strong market days.
5. Looking at the Bear scores, Utilities (IDU) holds the top spot as favorite “safe haven” on weak market days, scoring 56. Financial (IYF), Technology (IYW), and Consumer Services (IYC) all display the lowest Bear score of 46, followed closely by Energy (IYE) and Materials (IYM). The top-bottom spread is only 10 points, which indicates relatively low sector correlations (across-the-board selling) on particularly weak market days.
These Outlook scores represent the view that Financial and Technology sectors are still relatively undervalued, while Telecom and Consumer Services may be relatively overvalued based on our 1-3 month forward look.
Although the ten sector iShares provide broad beta exposure to the business sectors, some other ETFs within the Financial and Technology sectors that rank highly in our rankings include the First Trust NASDAQ ABA Community Bank Index Fund (QABA), which scores a perfect 100 Outlook score, and the First Trust NASDAQ Technology Dividend Index Fund (TDIV), which scores a 75. Some top-ranked stocks that are components of IYF and IYW include Visa (V), Altisource Portfolio Solutions (ASPS), Medidata Solutions (MDSO), and Google (GOOG). Each of these ranks highly in the Sabrient Ratings Algorithm, and also scores in the top two quintiles of our proprietary Earnings Quality Rank (i.e., they have lower accounting-based risks).
The Earnings Quality Rank (EQR) is a pure accounting-based risk assessment signal co-developed by Sabrient and subsidiary Gradient Analytics, a forensic accounting research firm that evaluates the quality and sustainability of reported earnings. Gradient’s clients, including institutional portfolio managers and analysts, hedge funds, and wealth managers, use it to avoid meltdowns in long positions and to identify short candidates.
Gradient’s flagship alert service identifies red flags in companies’ financial filings. Over the past several days, some of the stocks on which Gradient has written negative reports have come clean with earnings quality issues or lowered guidance, including Hologic (HOLX), Solazyme (SZYM), and Tesla Motors (TSLA).
The Earnings Quality Rank is a key factor in Sabrient’s “Baker’s Dozen” model. The annual portfolio based on this model is now up +41% since the portfolio’s inception on January 11 through November 13, vs. the S&P 500 return of +21% over the same timeframe. Moreover, all 13 stocks are comfortably positive and 12 are up by double digits, led by Jazz Pharmaceuticals (JAZZ) and their blow-out earnings last week. There have been no offsetting meltdowns in the portfolio, and we believe our Earnings Quality Rank is a primary reason.
JAZZ was up another +8.7% on Wednesday and is up +98% since entering the portfolio on January 11. Other top performers in the 2013 Baker’s Dozen include Genworth Financial (GNW), Alaska Air Group (ALK), NXP Semiconductor (NXPI), Seagate Technology (STX), and Air Lease (AL).
Note that the next Baker’s Dozen portfolio for 2014 will launch in early January, and we also publish quarterly “Earnings Busters” portfolios (of which JAZZ is also a constituent), based on a similar model.
Disclosure: Author has no positions in stocks or ETFs mentioned.
About SectorCast: Rankings are based on Sabrient’s SectorCast model, which builds a composite profile of each equity ETF based on bottom-up aggregate scoring of the constituent stocks. The Outlook Score employs a fundamentals-based multi-factor approach considering forward valuation, earnings growth prospects, Wall Street analysts’ consensus revisions, accounting practices, and various return ratios. It has tested to be highly predictive for identifying the best (most undervalued) and worst (most overvalued) sectors, with a 1-3 month forward look.
Bull Score and Bear Score are based on the price behavior of the underlying stocks on particularly strong and weak days during the prior 40 market days. They reflect investor sentiment toward the stocks (on a relative basis) as either aggressive plays or safe havens. So, a high Bull score indicates that stocks within the ETF have tended recently toward relative outperformance during particularly strong market periods, while a high Bear score indicates that stocks within the ETF have tended to hold up relatively well during particularly weak market periods.
Thus, ETFs with high Bull scores generally perform better when the market is hot, ETFs with high Bear scores generally perform better when the market is weak, and ETFs with high Outlook scores generally perform well over time in various market conditions.
Of course, each ETF has a unique set of constituent stocks, so the sectors represented will score differently depending upon which set of ETFs is used. For Sector Detector, I use ten iShares ETFs representing the major U.S. business sectors.
About Trading Strategies: There are various ways to trade these rankings. First, you might run a sector rotation strategy in which you buy long the top 2-4 ETFs from SectorCast-ETF, rebalancing either on a fixed schedule (e.g., monthly or quarterly) or when the rankings change significantly. Another alternative is to enhance a position in the SPDR Trust exchange-traded fund (SPY) depending upon your market bias. If you are bullish on the broad market, you can go long the SPY and enhance it with additional long positions in the top-ranked sector ETFs. Conversely, if you are bearish and short (or buy puts on) the SPY, you could also consider shorting the two lowest-ranked sector ETFs to enhance your short bias.
However, if you prefer not to bet on market direction, you could try a market-neutral, long/short trade—that is, go long (or buy call options on) the top-ranked ETFs and short (or buy put options on) the lowest-ranked ETFs. And here’s a more aggressive strategy to consider: You might trade some of the highest and lowest ranked stocks from within those top and bottom-ranked ETFs.