Sector Detector: Stocks methodically march ever higher as breadth continues to improve
I haven’t written in a few weeks. That can be a lot of time for the latest news to impact the character and direction of the market, right? So, what has changed since my last article? Well, not much, really. It seems the market isn’t quite so news-driven these days; instead it has been focusing on fundamentals and the overall improvement in prospects for the economy and corporate earnings. And these things are driving it ever higher.
When I last wrote in mid-July, the S&P 500 had just broken out of its long-standing trading range and is now continuing to set new all-time highs. After a long period of extremely narrow leadership during the July-February timeframe, as displayed by extreme outperformance of the cap-weighted large-cap indexes versus the smaller caps and equal-weighted indexes, we continue to see improved market breadth (that includes strength in small caps, transports, and emerging markets), lower sector correlations, and capital flight into higher quality companies with strong fundamentals, valuations, earnings quality, and market positioning.
Although some market segments (like airlines) continue to languish despite attractive forward valuations, in general there are plenty of compelling valuations for strong forward growth expectations that once again are being recognized and bought, rather than ignored like they were during that challenging July-February timeframe.
In this periodic update, I give my view of the current market environment, offer a technical analysis of the S&P 500 chart, review our weekly fundamentals-based SectorCast rankings of the ten U.S. business sectors, and then offer up some actionable ETF trading ideas.
Market overview:
The major market averages (Dow, S&P 500, NASDAQ) all hit new record highs this week simultaneously. The last time that happened was on December 31, 1999. But rather than the irrational exuberance of 1999, current market strength is continuing despite broad investor skepticism and high-profile market players making dire predictions on many fronts -- from a hard landing in China, to Brexit-induced depression in Europe, to a collapse of the oil industry and oil-exporting countries, to overly-elevated valuation multiples, to an inverted yield curve, to a surging US dollar, to a Zika epidemic, to unstoppable terrorism. Moreover, from a historical standpoint, whenever the market index has broken out of a lengthy trading channel like it did just recently, it often has resulted in double-digit gains over the ensuing 12-18 months.
But despite this impressive show of strength and resilience, stocks remain unloved, especially among millennials and retirees. It is notable that there was more in the way of mutual fund and ETF redemptions during 1H 2016 than during the 2008 financial crisis. Compared to other times when the market sold off from a market top, investor sentiment is far from exuberant. And although the mid and large cap, cap-weighted major indexes are at all-time highs, many market segments are not, such as small caps, transports, and emerging markets. Moreover, many high-quality companies with attractive forward valuations and strong market position are not near their highs.
In fact, as we at Sabrient were picking our new summer portfolios (including Forward Looking Value, which launched in June, and this week’s summer Baker’s Dozen), we found many highly compelling forward PEG ratios. And many of those reside among the smaller caps, which is not surprising given their under-performance during that lengthy period of narrow leadership among FANG stocks and a handful of mega caps. We didn’t make a macro decision to focus on the lower market caps -- that’s just where our model identified the most compelling buys.
Regarding the elevated multiple on the S&P 500, if the market were to stay in a risk-on/risk-off, news-driven state, we might be seeing the cap-weighted indexes topping out. But given the healthy broadening action, I see a lot of upside potential, particularly in the mid and small cap space. And why not? Given abundant global monetary stimulus, foreign capital inflows to the US, record low interest rates, massive levels of stock buybacks, low inflation risk, rising real estate activity, increased loan activity, job growth, modest wage inflation, low fuel prices, rising consumer spending, the expectation of improved corporate earnings growth, and pervasive caution among investors with lots of cash still on the sidelines, US equities look like the most attractive investment in town. In fact, many of these elements are reflected in the stock selections for our brand new summer Baker’s Dozen portfolio.
The Atlanta Fed’s GDPNow model is now predicting an expected Q3 real GDP annualized growth rate of 3.8%, assuming robust consumer spending and rising inventories. (For comparison, real GDP rose at an annual rate of 0.8% in Q1 and 1.2% in Q2.) Indeed, consumer spending has been looking good, growing by 4.2% in Q2, which is its highest growth rate since Q4 2014.
Many market observers believe that the US is not really in a recovery, but instead feel that improving economic reports and the surging stock market are simply symptoms of a liquidity-driven bubble. Although I do believe that the over-reliance on monetary policy – rather than long-term fiscal stimulus and structural/regulatory reforms – have exacerbated income inequality and the wealth gap, I also believe that the relentless spirit of the American entrepreneur has found a way to keep moving the ball forward despite government-imposed obstacles. But fiscal and structural stimulus would be so much more effective – and in my opinion will be essential for continued long-term growth.
The 10-year Treasury yield closed Tuesday at 1.58% and the 30-year at 2.30%, while the 2-year is 0.75%. The spread between the 10-year and 2-year has fallen to 83 bps, as the yield curve remains relatively flat. Also, CME fed funds futures on Tuesday are suddenly increasing the odds of a rate hike from where they were on Monday. They are now indicating a 18% probability of a rate hike in September (up from 9% on Monday) and 55% for at least one hike by December (up from 44% on Monday).
The CBOE Market Volatility Index (VIX), aka fear gauge, closed Tuesday at 12.59 and remains well below the 15 threshold between fear and complacency.
As I travel around the country speaking with financial advisors about Sabrient’s portfolios, it has been great to reconnect and interact with so many whom I see periodically and have gotten to know. During these discussions and presentations, my market outlook (which is based on our bottom-up aggregation of Wall Street’s expectation for individual companies) hasn’t changed at all since January. But instead of forecasting a return to rational, fundamentals-based investor behavior and an associated broadening in search of compelling buys, we are actually seeing it come to fruition. I still expect a continued broadening and a flight to high-quality companies with solid fundamentals, strong market position, and attractive forward valuations for their anticipated growth. And I still project that the S&P 500 will close the year with a double-digit gain, which would put it north of 2250.
SPY chart review:
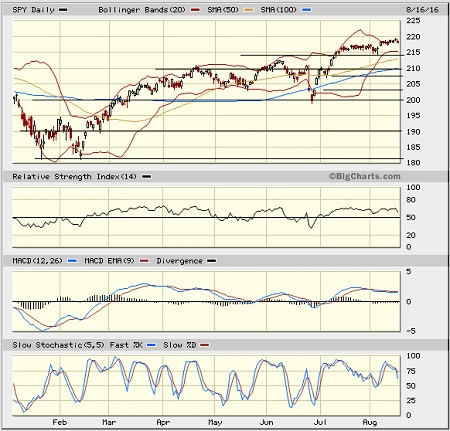
The SPY closed Tuesday at 218, but it continues to incrementally set new all-time highs in a slow but steady march higher. After breaking out in mid-July above the previous high from May 2015 (around 214), it went into a flat-line consolidation phase to work off some overbought conditions before again breaking higher last week, and then again falling into another flat-line, low-volatility consolidation. Bollinger Bands are pinched tightly together, indicating a larger move one way or the other may be imminent, and that move is likely to be to the upside. I think a retest of former resistance-turned-support at 214 would be healthy. Other lines of support should come in at 210, 208, and 204, if it were to fall that far, but I doubt it will. SPY remains well above its 50-day, 100-day, and 200-day simple moving averages, but oscillators RSI and Slow Stochastic look ready to cycle lower, at least briefly to gather some energy. From a technical standpoint, the market is healthy and just waiting for any sort of catalyst as an excuse to go up.
Latest sector rankings:
Relative sector rankings are based on our proprietary SectorCast model, which builds a composite profile of each equity ETF based on bottom-up aggregate scoring of the constituent stocks. The Outlook Score employs a forward-looking, fundamentals-based multifactor algorithm considering forward valuation, historical and projected earnings growth, the dynamics of Wall Street analysts’ consensus earnings estimates and recent revisions (up or down), quality and sustainability of reported earnings (forensic accounting), and various return ratios. It helps us predict relative performance over the next 1-3 months.
In addition, SectorCast computes a Bull Score and Bear Score for each ETF based on recent price behavior of the constituent stocks on particularly strong and weak market days. High Bull score indicates that stocks within the ETF recently have tended toward relative outperformance when the market is strong, while a high Bear score indicates that stocks within the ETF have tended to hold up relatively well (i.e., safe havens) when the market is weak.
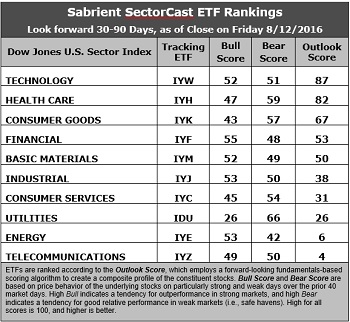
Outlook score is forward-looking while Bull and Bear are backward-looking. As a group, these three scores can be helpful for positioning a portfolio for a given set of anticipated market conditions. Of course, each ETF holds a unique portfolio of stocks and position weights, so the sectors represented will score differently depending upon which set of ETFs is used. We use the iShares that represent the ten major U.S. business sectors: Financial (IYF), Technology (IYW), Industrial (IYJ), Healthcare (IYH), Consumer Goods (IYK), Consumer Services (IYC), Energy (IYE), Basic Materials (IYM), Telecommunications (IYZ), and Utilities (IDU). Whereas the Select Sector SPDRs only contain stocks from the S&P 500, I prefer the iShares for their larger universe and broader diversity.
Here are some of my observations on this week’s scores:
1. Technology retakes the top spot with an Outlook score of 87, but Healthcare remains highly ranked, as well, with an 82. Both sectors display generally good factor scores across the board. Technology has among the best Wall Street analyst sentiment (net revisions to earnings estimates) and insider sentiment, solid return ratios, a reasonable forward P/E of about 16.8x, a strong forward long-term growth rate (14%), and the lowest forward PEG of 1.2. Healthcare has an attractive forward P/E of about 16.3x, the second lowest forward PEG of 1.5, and solid Wall Street analyst sentiment. Rounding out the top of the rankings are Consumer Goods (Staples/Noncyclical), Financial, Basic Materials, Industrial, and Consumer Services (Discretionary/Cyclical). Financial still displays the lowest forward P/E of 15x.
2. Energy and Telecom remain in the bottom two. Nevertheless, Energy displays the second highest forward long-term growth rate of 12.5% (albeit because of a low bar for prior-year comps) and improving sell-side sentiment (net revisions to earnings estimates), but it is held back by a high forward P/E (31x), a forward PEG of 2.5, and weak return ratios. Telecom also displays a relatively high forward P/E of 25.6x and a forward PEG of 2.4.
3. Looking at the Bull scores, Financial has the top score of 55, followed closely by Industrial and Energy, as they display relative strength on strong market days, while Utilities is the lowest at 26. The top-bottom spread is 29 points, which reflects quite low sector correlations on strong market days, which can be good for stock picking. It is desirable in a healthy market to see low correlations reflected in a top-bottom spread of at least 20 points, which indicates that investors have clear preferences in the stocks they want to hold (rather than broad risk-on behavior).
4. Looking at the Bear scores, Utilities (as usual) displays the top score of 66, followed by Healthcare at 59, which means that stocks within these sectors have been the preferred safe havens on weak market days. Energy scores the lowest at 42, as investors flee during market weakness. The top-bottom spread is 24 points, which reflects low sector correlations on weak market days, which can be good for stock picking. Ideally, certain sectors will hold up relatively well while others are selling off (rather than broad risk-off behavior), so it is desirable in a healthy market to see low correlations reflected in a top-bottom spread of at least 20 points.
5. Technology displays the best all-around combination of Outlook/Bull/Bear scores, while Energy is the worst. However, looking at just the Bull/Bear combination, Healthcare is now the best, indicating superior relative performance (on average) in extreme market conditions (whether bullish or bearish), while Utilities is suddenly scoring the worst.
6. This week’s fundamentals-based Outlook rankings look bullish to me given that the top seven sectors include all-weather Healthcare and economically-sensitive Technology, Financial, Basic Materials, Industrial, and Consumer Services (Discretionary/Cyclical), along with just one defensive sector in Consumer Goods (Staples/Noncyclical), while defensive sectors Utilities and Telecom are ranked near the bottom. Keep in mind, the Outlook Rank does not include timing, momentum, or relative strength factors, but rather is a reflection of the fundamental expectations for individual stocks aggregated by sector.
ETF Trading Ideas:
Our Sector Rotation model, which appropriately weights Outlook, Bull, and Bear scores in accordance with the overall market’s prevailing trend (bullish, neutral, or defensive), continues to reflect a bullish bias and suggests holding Technology, Financial, and Healthcare, in that order. (Note: In this model, we consider the bias to be bullish from a rules-based trend-following standpoint when SPY is above both its 50-day and 200-day simple moving averages.)
Besides iShares’ IYW, IYF, and IYH, other highly-ranked ETFs in our SectorCast model from the Technology, Financial, and Healthcare sectors include Guggenheim Invest S&P 500 Equal Weight Technology ETF (RYT), iShares US Broker-Dealers ETF (IAI), and VanEck Vectors Biotech ETF (BBH).
Other ETFs scoring near the top of the rankings include iShares US Home Construction ETF (ITB), Global X SuperDividend REIT ETF (SRET), Guggenheim Invest Shipping ETF (SEA), VanEck Vectors Steel ETF (SLX), PureFunds ISE Mobile Payments ETF (IPAY), Direxion All Cap Insider Sentiment Shares (KNOW), which tracks a Sabrient index, and the First Trust LongShort Equity ETF (FTLS), which employs Sabrient’s proprietary Earnings Quality Rank as a key input factor.
If you prefer a neutral bias, the Sector Rotation model suggests holding Technology, Healthcare, and Consumer Goods (Staples/Noncyclical), in that order. On the other hand, if you prefer a defensive stance on the market, the model suggests holding Healthcare, Utilities, and Consumer Goods (Staples/Noncyclical), in that order.
IMPORTANT NOTE: I post this information periodically as a free look inside some of our institutional research and as a source of some trading ideas for your own further investigation. It is not intended to be traded directly as a rules-based strategy in a real money portfolio. I am simply showing what a sector rotation model might suggest if a given portfolio was due for a rebalance, and I may or may not update the information on a regular schedule. There are many ways for a client to trade such a strategy, including monthly or quarterly rebalancing, perhaps with interim adjustments to the bullish/neutral/defensive bias when warranted -- but not necessarily on the days that I happen to post this article. The enhanced strategy seeks higher returns by employing individual stocks (or stock options) that are also highly ranked, but this introduces greater risks and volatility. I do not track performance of the ideas mentioned here as a managed portfolio.
Disclosure: Scott Martindale is president of Sabrient Systems, LLC. The author has no positions in stocks or ETFs mentioned.
Disclaimer: This newsletter is published solely for informational purposes and is not to be construed as advice or a recommendation to specific individuals. Individuals should take into account their personal financial circumstances in acting on any rankings or stock selections provided by Sabrient. Sabrient makes no representations that the techniques used in its rankings or selections will result in or guarantee profits in trading. Trading involves risk, including possible loss of principal and other losses, and past performance is no indication of future results.