Sector Detector: All eyes on the Fed as inflation metrics give mixed signals
 by Scott Martindale
President & CEO, Sabrient Systems LLC
Given the latest inflation reports last week and this week’s FOMC meeting, I thought I would offer up some perspective today in a short post. Although there are plenty of other issues to worry about, including the historic auto workers’ strike and an impending federal government shutdown, all eyes are focused on the Fed’s reaction to inflation and jobs reports in the form of monetary policy, specifically interest rates and money supply.
The 2-year yield again has been battling the important 5% threshold, which I have called a “line in the sand” for stocks. After challenging the March and July highs above 5% during August, it had appeared to me that it was just another buyable bond selloff, driven by the various reasons I discussed in my 9/1/2023 post. Indeed, yields pulled back substantially to end the month of August, as both bond and stock prices rose. But this month’s renewed weakness in bonds (and the rise in yields) suggests a “buyer’s strike” as investors generally have been moving to cash ahead of this week’s FOMC meeting. At the moment, resistance at the 5-handle seems to have given way, with the rate now at 5.10% as I write (and stocks are weak).
To be sure, last week’s inflation reports gave mixed signals. CPI and PPI both ticked up from their June lows of 3.0% and 0.1%, respectively, to August readings of 3.7% and 1.6%, which appear troubling to the Fed’s ongoing inflation fight. Certainly, the recent surge in oil prices to above $90 has hurt the cause, as has the stubborn shelter cost component, which makes up 42% of CPI. In addition, Mexico’s rise as a “near-shore” manufacturing hub for the US, its extreme wage inflation, and the extraordinary strength of the peso has increased prices of its exports to the US.
On the other hand, rising oil prices are like a tax on consumers, limiting their disposable income to buy other things. Same with the imminent student loan payment restart. Also, core rates (ex-food and energy) for CPI and PPI both fell to 4.3% and 2.2%, respectively. And given the emerging “lag effects” of rising interest rates on rents and owner’s equivalent rent (OER), many economists expect shelter costs to begin to decline very soon. Indeed, by Q4 2024, JPMorgan chief global strategist David Kelly expects both headline and core PCE to fall below the Fed’s 2% target and perhaps hit 1.5%, largely driven by declines in shelter costs, new and used car prices, auto insurance, and car maintenance.
Below is an updated version of a chart I present from time to time. It compares trends in CPI and PPI versus the New York Fed’s Global Supply Chain Pressure Index (GSCPI), which measures the number of standard deviations from the historical average value. It also shows wage growth, M2 money supply (M2SL), and the S&P 500 (SPY). I know the chart is busy, but it tells a good story.
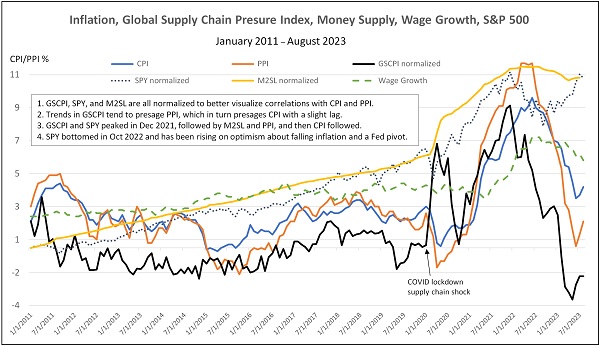
GSCPI tends to presage PPI, which tends to presage CPI. As you can see, GSCPI peaked in December 2021 at +4.31 standard deviations, followed by PPI in March 2022 at 11.2%, and then CPI a few months later in June 2022 at 9.1%. Wage growth also peaked around the same time at 6.7%. This year, GSCPI fell to a low in May of -1.57 (yes, a negative number) before ticking up a bit in July-August to -0.86. In other words, supply chain pressures crashed to historic lows in May, mostly due to softer consumer goods demand, an easing of parts shortages, lesser shipping congestion, and lower freight rates. And as the chart shows, both PPI and CPI quickly followed GSCPI’s lead with their own lows in June of 3.0% and 0.1%, respectively, and have also bounced a tad. But now that GSCPI has flattened in August, CPI/PPI should soon follow suit—and likely grind lower—particularly as cracks form in the labor market such as declining wage growth, quit rates, and job openings, and rising unemployment and labor participation.
In addition, disinflationary secular trends have resumed their impact, including aging demographics, slowing population growth, accelerating disruptive/transformational/productivity-enhancing innovation and automation, and yes, globalization of supply chains—despite some “onshoring,” “near-shoring” (e.g., Mexico), and “friend-shoring” (e.g., Vietnam) of manufacturing facilities to reduce dependency on adversarial countries. And then we have China, which I discussed at length in my 9/1/2023 post, whose economic struggles have unleashed a deflationary impulse on the US and global economies.
As for money supply, recall that the Fed created a 40% pandemic-response surge in money supply in 2020-21, as illustrated in the chart, and SPY historically has displayed correlation with M2 (as well as earnings growth). Both SPY and M2 hit a peak and pulled back in early 2022, but SPY bottomed out in October 2022 and has been recovering ever since. Now that M2 seems to have stopped contracting (and should continue to grind higher to fund fed budget deficit and higher interest payments), it should allow SPY to grind higher as well, particularly given growing optimism about an economic soft landing, stable/falling inflation, and a Fed pause/pivot, which would support higher valuation multiples.
Furthermore, as I have written about frequently in the past, the Fed will be constrained in raising rates by the unintended impacts (and lag effects) outside of its focus on US inflation and unemployment—particularly as real rates rise. These include the critical banking sector (inverted yield curve) and housing market (high mortgage rates), as well as emerging markets and our primary international trading partners. But it’s not the height of interest rates that matters as much as how long they stay high, given our hyper-financialized global economy. Already, it has been estimated that 60% of lower-income countries have entered some level of “debt distress.” This also limits the Fed’s flexibility to shrink (or even flatten) money supply in a world hungry for dollars.
Thus, I continue to believe we have seen that last of Fed rate hikes—no matter what Chairman Powell intimates this week in his statement and press conference. Indeed, I have been opining for several months that it has already gone beyond the “neutral rate” (i.e., the equilibrium short-term interest rate that neither stimulates nor suppresses economic activity). The r* (aka “r-star) is the real (inflation adjusted) version of the neutral interest rate, and its long-run average is about 0.50%. However, given today’s nominal fed funds rate of 5.25%, subtracting CPI of 3.7% suggests a current real rate of 1.55%—so Fed policy is restrictive, as intended. But if CPI returns to the 2-3% range by next year (let’s call it 2.5%) due to sluggish GDP and wage growth and rising unemployment, then r* of 0.50% would suggest the long-run fed funds rate should be around 3.0% (2.50% + 0.50%). Indeed, fed funds futures are predicting three or four 25-bp rate cuts next year. But if David Kelly is right and inflation falls to 1.5% by the end of 2024, it would suggest a fed funds rate of 2.0%, i.e., eight 25-bp cuts.
Although the FOMC will almost certainly keep the fed funds rate steady this week, investors aren’t yet convinced that the rate hike cycle has ended. Fed funds futures indicate a 40% chance of at least one more hike before year end. Certainly, Fed statements have continued to be hawkish, suggesting “more work to be done” and “higher for longer” given the “significant upside risks to inflation.”
What would force the Fed’s hand to pause, in my view, would be the combination of a falling housing market, irate bond vigilantes, and overseas sovereign debt crises stemming from an ultra-strong dollar (which creates widespread dumping of US Treasuries by our trading partners so they can bolster their own currencies and debt.
Overall, I expect inflation will resume its decline, even with positive GDP growth, particularly given slow money supply growth, mended supply chains, stabilizing home prices and rents, lesser consumer spending on goods, slowing wage inflation, accelerating lag effects of high interest rates, and a deflationary impulse from China. This eventually will give the Fed license to cut rates—perhaps early next year (or possibly sooner)—both to head off crises in banking and housing and to mitigate growing strains on businesses, consumers, and our heavily leveraged trading partners of an ultra-strong dollar and high interest rates on rolling maturing debt.
Lastly, as discussed in my 9/1/2023 post, if you look beyond the high-P/E mega cap names (which trade in a category of their own), the average stock still displays a reasonable valuation, especially if earnings hold up while yields fall. For example, while the S&P 500 (SPY) displays a forward P/E around 19.1x, the S&P 500 Equal Weight (RSP) is at only 15.3x and the S&P 600 Small Caps (SPSM) is at only 13.5x. On that note, Sabrient’s Small Cap Growth Portfolio offers an alpha-seeking alternative to a passive position in the Russell 2000 or S&P 600 for gaining small cap exposure.
Latest Sector Rankings:
Relative sector rankings are based on our proprietary SectorCast model, which builds a composite profile of each of over 1,000 equity ETFs based on bottom-up aggregate scoring of the constituent stocks. The Outlook Score is a Growth at a Reasonable Price (GARP) model that employs a forward-looking, fundamentals-based multifactor algorithm considering forward valuation, historical and projected earnings growth, the dynamics of Wall Street analysts’ consensus earnings estimates and recent revisions (up or down), quality and sustainability of reported earnings, and various return ratios. It helps us predict relative performance over the next 3-6 months.
In addition, SectorCast computes a Bull Score and Bear Score for each ETF based on recent price behavior of the constituent stocks on particularly strong and weak market days. A high Bull score indicates that stocks within the ETF recently have tended toward relative outperformance when the market is strong, while a high Bear score indicates that stocks within the ETF have tended to hold up relatively well (i.e., safe havens) when the market is weak. Outlook score is forward-looking while Bull and Bear are backward-looking.
As a group, these three scores can be helpful for positioning a portfolio for a given set of anticipated market conditions. Of course, each ETF holds a unique portfolio of stocks and position weights, so the sectors represented will score differently depending upon which set of ETFs is used. We use the iShares that represent the ten major U.S. business sectors: Financials (IYF), Technology (IYW), Industrials (IYJ), Healthcare (IYH), Consumer Staples (IYK), Consumer Discretionary (IYC), Energy (IYE), Basic Materials (IYM), Telecommunications (IYZ), and Utilities (IDU). Whereas the Select Sector SPDRs only contain stocks from the S&P 500 large cap index, I prefer the iShares for their larger universe and broader diversity.
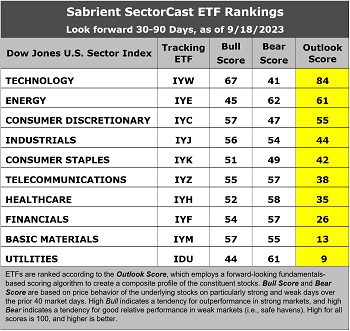
The latest fundamentals-based Outlook rankings continue to display a bullish bias given the dominance of economically sensitive and cyclical sectors at the top. Technology (IYW) takes the top spot with a robust Outlook Score of 84, followed by the Energy sector (IYE) at 61, Consumer Discretionary (IYC) at 55, and Industrials (IYJ) at 44, all of which are either cyclical or high-growth secular sectors. On the other hand, only three firms have Outlook scores above the 50 mid-point, and “deep cyclical” sectors Basic Materials and Financials are in the bottom three, which is somewhat cautionary.
Also notable is that the cyclical Energy sector displays one of lowest Bull scores and the highest Bear score. A high Bear score is usually reflective of a defensive sector, but in this case, I believe it reflects current investor sentiment about the impact of rising oil prices on a fragile economy, i.e., helpful to Energy stocks’ earnings outlook but negative for the broader market (a quasi-tax and inflationary).
As always, I welcome your thoughts on this article! Please email me anytime. Any and all feedback is appreciated! In particular, tell me what sections you find the most valuable—commentary, chart analysis, SectorCast scores, or ETF trading ideas / sector rotation model. Also, please let me know of your interest in a Sabrient index for TAMP or ETF investing…or in the new Sabrient SmartSheets to our full rankings of stocks and ETFs…or in having me speak at your event.
IMPORTANT NOTE: I post this information periodically as a free look inside some of our institutional research and as a source of some trading ideas for your own further investigation. It is not intended to be traded directly as a rules-based strategy in a real money portfolio. I am simply showing what a sector rotation model might suggest if a given portfolio was due for a rebalance, and I do not update the information on a regular schedule or on technical triggers. There are many ways for a client to trade such a strategy, including monthly or quarterly rebalancing, perhaps with interim adjustments to the bullish/neutral/defensive bias when warranted, but not necessarily on the days that I happen to post this article. The enhanced strategy seeks higher returns by employing individual stocks (or stock options) that are also highly ranked, but this introduces greater risks and volatility. I do not track performance of the ideas mentioned here as a managed portfolio.
Disclosure: At the time of this writing, the author held no positions in the securities mentioned.
Disclaimer: Opinions expressed are the author’s alone and do not necessarily reflect the views of Sabrient. This newsletter is published solely for informational purposes and is not to be construed as advice or a recommendation to specific individuals. Individuals should take into account their personal financial circumstances in acting on any opinions, commentary, rankings, or stock selections provided by Sabrient Systems or its wholly owned subsidiary, Gradient Analytics. Sabrient makes no representations that the techniques used in its rankings or analysis will result in or guarantee profits in trading. Trading involves risk, including possible loss of principal and other losses, and past performance is no indication of future results.