Scott Martindale


  by Scott Martindale
  CEO, Sabrient Systems LLC


Quick note: Sabrient’s annual Forward Looking Value 14 portfolio just launched last week on 8/26 with a diverse mix of 31 stocks across 9 business sectors and a 50/50 Large/SMID-cap mix. Think of it as a less-concentrated and more value-oriented version of Baker’s Dozen. Last year’s FLV 13 terminates 11/17 and is up +38.4% vs. +19.4% for S&P 500 Value (SPYV) and +20.2% for S&P 500 (SPY) as of 9/2. I personally like the UIT structure as a diversifier for a client’s equity portfolio because they are unmanaged—while most other products are managed to some extent, even quarterly rebalanced rules-based indexes—and most active managers tend to underperform their benchmarks. Also, value stocks tend not to be as volatile, so value or dividend portfolios tend to fit well with the unmanaged, buy-and-hold-for-15-months structure.

Overview:

The US economy is changing faster than the traditional macro indicators can explain it. On the one hand, Q2 GDP (just +1.5%) and jobs growth look sluggish, inflation is sticky, debt and bond yields are surging, and the bifurcated “K-shaped” economy is causing poor consumer sentiment and public dissatisfaction—to the point that socialism(!) is gaining traction. The top 10% by net worth own 87% of stocks and 68% of total net worth, while the bottom 50% own just 1% of stocks but carry 52% of consumer debt. Consumer debt is rising while the personal savings rate remains low to support spending. Real (inflation-adjusted) consumer spending was essentially flat in July, while the personal savings rate finally edged up slightly to 3.0% in July after a steady decline from 6.4% in January 2024 to as low as 2.6% in June 2026.

On the other hand, the official Q2 GDP reading was held down by high AI-related imports and inventory drawdowns, which actually reflect robust economic activity. Private domestic demand (considered a truer signal of underlying economic health) was quite strong in Q2 at +4.2% annualized rate, consumer spending was up +3.4%, business investment excluding housing was up +8.5%. Indeed, the Atlanta Fed’s GDPNow now forecasts Q3 GDP at 4.7% (as of 9/3). Corporate profits, productivity, margins, cash flow, and capex are massive. Jobless claims in our “low-hire, low-fire” labor market are near their lowest level in decades, which Fed chairman Kevin Warsh calls "an empirically robust real-time indicator” constrained only by flattening labor supply (a lack of willing workers).

Perhaps the low personal savings rate is to be expected as Baby Boomers retire and draw down their wealth, and household debt as a percentage of disposable personal income has stopped rising in Q1-Q2. Stocks are near all-time highs even though interest rates have become punitive (compared to what the broad economy had become accustomed to), and market breadth is improving.

While these data points might seem like contradictions, they may in fact be a predictable reflection of a structural transition toward a more capital-intensive, AI-driven, productivity-led economy.

Regarding inflation and Fed policy, Warsh stated in his Jackson Hole speech, “Certain sectors—like housing and agriculture—are showing strains. But, on balance, I would be hard pressed to describe broad financial conditions as restrictive…. We must be confident that underlying inflation is moving to our objective, clearly and at sufficient speed. Otherwise, we have work to do.” But you likely heard it paraphrased as simply, “Inflation is running too hot…financial conditions are not restrictive…we have work to do,” which is clearly more hawkish than his actual statement and seemingly a fait accompli that rate hikes are imminent. Fed funds futures now imply 2+ rate hikes over the next 12 months, with 50% odds of a 25-bp hike at the upcoming FOMC meeting this month.
 
However, I humbly disagree. I think Warsh’s actual statement cleverly balanced between sounding sufficiently hawkish to appease the “bond vigilantes” while leaving himself an opening to avoid hiking rates. Most of the non-supply-shock components of inflation are relatively subdued, and by some key metrics, underlying inflation is indeed moving toward the 2% objective—for example, Warsh’s preferred Trimmed Mean PCE has held steady at +2.3% in June/July, and the real-time, blockchain-based Truflation CPI is also +2.3% (as of 9/3). Meanwhile, all is not well in this K-shaped economy. The labor market is stagnant, the lower/working class consumer and wage earner is struggling, and monetary policy is clearly restrictive in the most rate-sensitive industries and demographics.

We can’t continue to rely solely on massive AI capex and retiring Baby-Boomer spending (neither of which are particularly rate sensitive) to power our economy while watching the lower leg of the K languish. All it takes is for one hyperscaler to announce a significant reduction in capex and we’ll likely see economic growth fall—along with the stock market.

So, I continue to believe a rate cut is appropriate—certainly not a hike (as fed funds futures and Polymarket confidently predict). A hike would only further hinder those struggling cash-poor segments (many of whom are warming up to the socialist “free stuff” rhetoric) while doing little to restrain the cash-rich AI trade or resolve the event-driven supply shock. I feel alone in the woods on this, but I see the neutral rate at 3.0-3.25%. Unfortunately, such an action apparently would be quite unpopular in the bond market and thus is unlikely to happen anytime soon, thus keeping the economy bifurcated. However, in speeches this week, Fed governor Christopher Waller and NY Fed president John Williams pumped the brakes on the tightening narrative (“Give disinflation a chance”).

Kevin Warsh has suggested in the past a preference for fulfilling his mandate of price stability through a combination of: 1) a lower fed funds rate, 2) continued balance sheet reduction to constrain money supply growth (including a revised Treasury-Fed relationship that gives the Treasury more say over balance-sheet decisions), and 3) structural reform of how inflation is measured (replacing the lagged and imputed components). This approach would ensure that liquidity is cheaper to access, preventing credit markets from locking up without flooding the entire financial system with inflationary liquidity. Less Fed demand for bonds might steepen the yield curve somewhat and keep 30-year mortgage rates elevated, but a lower fed funds rate reduces rates on short-term construction loans and adjustable mortgages.

According to global liquidity expert Michael Howell of CrossBorder Capital, the “Fed does not need to cut Fed funds to loosen US monetary conditions. It can hold the policy rate steady while Treasury bill issuance, reserve management and bank balance-sheet expansion deliver the liquidity impulse. This is the essence of ‘Treasury QE’: fiscal expansion financed at the short end, supported by enough reserve liquidity to keep funding markets orderly.”

By the way, regarding the sudden tariff flare-up with Canada, our neighbor’s retaliation could have targeted industrial inputs but instead it’s notable that they only apply to food and consumer products in an (admittedly) targeted effort to pressure Republican candidates in competitive US midterm election races in swing states like Pennsylvania, Michigan, and Wisconsin, and red states like Ohio, Indiana, and Kentucky.

In my full commentary below, I discuss:

1. Broadening continues as small caps, value, and the S&P 493 carry the baton
2. High earnings vs. high yields and the impact on valuations
3. The NVIDIA juggernaut and AI Phase II: proving the economy-wide ROI
4. Materials and power constraints on the AI buildout
5. K-shaped economy, inflation, and the Fed’s policy dilemma
6. Runaway Federal debt and the need to grow our way out of it
7. Crude oil inventory drawdown and oil company windfall profits
8. My Final Comments essay: Is AI opposition a nuclear power redux?
9. Sabrient’s sector rankings, positioning of our sector rotation model, and some top-ranked ETF ideas

According to Morgan Stanley, AI’s diffusion across the global economy is a $40 trillion opportunity that will rely on affordable compute. Indeed, there is so much demand for compute, some say it is becoming a new asset class—like stocks, bonds, commodities, real estate, private credit, crypto, collectibles, royalties, cash-flowing private businesses, or carbon credits. Pending regulatory review, CME Group and Silicon Data have announced plans to launch futures contracts on compute by tracking daily and hourly on-demand GPU rental cost indexes for NVIDIA's H100 and next-gen Blackwell B200 chips. This allows a company reliant on AI to lock in a future price and ensure delivery from a new datacenter that takes 2-3 years to build.

Some are worried about falling token prices hurting the projected ROI on capex. But at the Google I/O 2026 Conference, CEO Sundar Pichai said that AI is using 3.2 quadrillion tokens per month, which is up 7x YoY. Indeed, rapidly falling inference costs can create demand that didn’t exist at previous prices. This is largely due to Jevons Paradox, which says efficiency gains lower production cost, which gets passed on to customers, thus driving up demand, which increases total resource usage over time—i.e., demand for a product or resource rises as price falls (aka demand elasticity). So, if the hyperscaler can produce and sell compute tokens cheaper, usage surges, and the hyperscaler makes more money overall. It seems this trend can only be disrupted by misguided (or deliberately subversive) politicians hell-bent on obstructing this broad, multi-layered, truly all-in, capital-investment cycle, as I discuss further in my Final Comments essay below.

This is just one of the many reasons I expect to see, through the end of this decade and likely beyond, smaller government and less low-ROI government spending in favor of more high-ROI capital allocation from an unleashed private sector as the primary engine of organic economic growth through fiscal support like favorable tax policy, deregulation, and other supply-side incentives for reshoring/onshoring to increase productive capacity.

As such, I still think the S&P 500 could reach 8,000 by year end. However, I also think a further market pullback this month is likely, perhaps to test support at the 50-day moving average, and as a reminder, September is the only month since 1975 in which the S&P 500 has averaged a net loss (-0.8%). But assuming continued healthy market broadening beyond the Big Tech titans, and praying the Fed does not start tightening, I continue to see opportunities in active stock selection, equal-weight indexes, value stocks, cyclical sectors, small caps, and bond-alternative dividend payers. I also continue to believe the Healthcare sector, which finally came alive this year, offers tremendous growth opportunities as it leverages AI. Sector earnings for Healthcare Select SPDR (XLV) are projected to rise by 22% YoY in 2027, which is second only to Technology.

Sabrient’s quant-based, actively selected (“quantamental”) Baker’s Dozen, Forward Looking Value, Dividend, and Small Cap Growth portfolios have been largely outperforming their benchmarks—several by substantial margins. And as a reminder, our Earnings Quality Rank (EQR) is licensed as a quality prescreen to the actively managed, low-beta First Trust Long-Short ETF (FTLS), which now has more than $2.5 billion in AUM.

Here is a link to this full post in printable PDF format. As always, I’d love to hear from you! Please feel free to email me your thoughts on this article or if you’d like me to speak on any of these topics at your event.  Read on….

Scott Martindale

 
  by Scott Martindale
  CEO, Sabrient Systems LLC


Quick note 1: Sabrient’s new Dividend 56 Portfolio just launched on 5/6 as a 24-month portfolio holding 46 dividend-paying stocks across a range of market caps and sectors. It employs a Growth & Income strategy, offering a bond-like current dividend yield of 3.36% while seeking capital appreciation potential. Notably, the next-to-terminate Dividend 48 ends on 5/22 and currently shows a gross total return of +55% vs. +26% for S&P 500 High Dividend ETF (SPYD) and +44% for S&P 500 (SPY), as of 5/15.

Quick note 2: Sabrient employs a variety of fundamental financial factors in our quantitative models and portfolio selection process. Sabrient Scorecards for Stocks and ETFs are investor tools that provide access to several of our proprietary models for idea generation and portfolio monitoring. I invite you as well to visit https://MoonRocksToPowerStocks.com to immediately download founder David Brown’s latest book (an Amazon international bestseller) and 2 bonus reports (on investing in the Future of Energy and Space Exploration)—all in PDF format.

Overview

The market has been in parabolic mode—and it’s all about earnings, pricing power, and ROI (current and forward) rather than multiple expansion (or hope and prayers). As Bespoke Investment Group observed last week, following a 70% gain just since 3/31 the PHLX Semiconductor Index (SOX) was trading 36% above its 50-day moving average for only the third time in the past 30 years, with the other two occurring during the dot-com bubble. Moreover, the Nasdaq 100 (QQQ) was trading 15% above its 50-day moving average for the first time since 2009 (coming out of the GFC). However, today’s enthusiasm differs from prior speculative technology cycles in several ways. For instance, revenue growth tied to AI infrastructure has been tangible and substantial, particularly with datacenter businesses that fulfill the insatiable compute demand by housing high-density servers, GPUs, and networking equipment that act as the infrastructure backbone for cloud computing and AI training workloads. In other words, the rally is not being driven solely by narrative momentum like the dot-com boom—it is also driven by accelerating revenue generation and real cash flow and earnings.

Indeed, Q1 corporate earnings season has been particularly strong, beating even the most optimistic forecasts and providing big increases in forward guidance. Approximately 84% of S&P 500 companies have exceeded analyst profit expectations, representing the highest beat rate since 2021, according to FactSet. Large-cap companies, especially within Technology and Communications Services, continue to demonstrate operating leverage and strong margin resilience despite elevated interest rates and lingering inflationary pressures. According to DataTrek, “US Big Tech (ex-Nvidia) generated $183.4 bn in cash flow in Q1 2026 and spent $183.7 bn on CapEx and strategic investments….” We are entering a productivity boom, which is driving an historic earnings boom. Forward estimates are growing faster than they did in the mid-90s or late dot-com bubble years—and without having economic recovery comps to artificially boost them.

FactSet data shows that for Q1, with 89% of companies having reported, the S&P 500 in aggregate is showing a YoY earnings growth rate of +27.7% (the highest since +32.0% in Q4 2021). The sectors seeing the biggest increases are Information Technology (+50.7%); Communication Services (+48.8%); and Materials (+43.2%), while Healthcare trails with a negative growth rate of -3.1% (the only one negative). As for revenue growth, the aggregate is +11.4% YoY (the highest since +13.9% in Q2 2022), led by InfoTech at +29.2% and Comm Services at +15.0%. Moreover, analysts have increased their S&P 500 earnings estimate for CY2026 to $333.25—implying a P/E of 22.2x based on the closing price on 5/15. Thus the CY2026 EPS forecast suggests +21.3% YoY growth over CY2025 (vs. +17.1% expected as of 3/31, before the latest reports and guidance came out), and Tech is now indicating +38.7% YoY EPS growth (vs. +23.4% expected on 3/31).

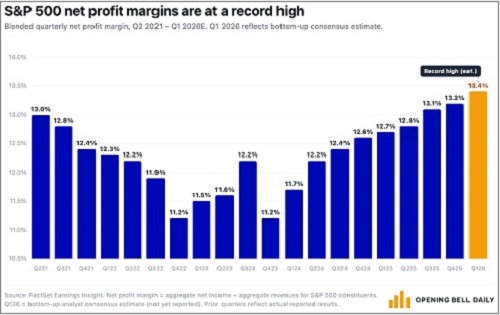
Furthermore, according to FactSet, Q1 2026 net profit margin for the S&P 500 (aggregated bottom-up) is tracking toward a record high (since data began publication in 2009) of 13.9% vs. the 5-year average of 12.3%, as illustrated in the chart below from Phil Rosen of Open Bell Daily. Notably, 6 of the 11 sectors are tracking above their 5-year average. And looking ahead, net margin is expected to climb to 14.6% by Q3. According to DataTrek Research, ““Earnings growth drives the narrative around price/earnings ratios, but it is trends in structural profitability that actually change investors' perceptions of underlying value…. Index valuations are increasing as a result, a natural if underappreciated outcome related to these improvements…and supports the argument for a ‘recession proof’ US economy.”

Net profit margins history chart

The Buffett Indicator (total US stock market cap divided by GDP) has reached 230% of GDP, far beyond even the 2000 dot-com bubble. And yet because of extraordinary earnings reports and optimistic forward guidance, P/E multiples are actually falling. For example, the next-12-months forward P/E for the Technology Select Sector SPDR (XLK) is 27.6x, down from its peak above 31 last October. Meanwhile, the S&P 500 trades at only 22.0x, down from 23.5x in October.

As for inflation and interest rates, I continue to believe the Fed is missing the mark and should be more accommodative. Incoming Fed chair Kevin Warsh will confront an FOMC that largely believes monetary policy should be tighter, with higher fed funds rate in the face of rising inflation readings. However, as I explain in my full commentary below, the latest inflationary surge is an event-driven supply shock—i.e., supply chain disruptions in the Strait of Hormuz and the resulting oil price spike (illustrated by the surging Global Supply Chain Pressure Index)—rather than structural (i.e., an overheated economy and excess consumer demand), many interest-rate-sensitive segments of the economy are still struggling. I believe that the fed funds rate should be 3.0% and that the 10-year Treasury note yield will eventually retreat back down to around 4.0%.

In my full commentary below, I discuss stock patterns and valuations, the AI-driven earnings boom, the 4-layer AI “stack” and its major players, GDP, productivity, inflation, liquidity, and Fed policy. And in my Final Comments section I discuss why the Iran oil supply shock is a reason to better diversify oil supply routes and pursue nuclear energy—not give license to ramp up solar, wind, and batteries. Then I close with my usual update on Sabrient’s sector rankings, positioning of our sector rotation model, and some top-ranked ETF ideas.

Despite narrow market breadth, Big Tech remains a must-own for its amazing growth and safe haven sentiment among investors. Still, 2026 should continue to be a good year for active stock selection, small caps, and bond-alternative dividend payers (particularly since the dividend yield on the S&P 500 is down to just 1.03%). Indeed, Sabrient’s Baker’s Dozen, Forward Looking Value, Small Cap Growth, and Dividend portfolios have been largely outperforming their benchmarks. Each is packaged and distributed as a unit investment trust (UIT) by First Trust Portfolios (https://ftportfolios.com).

By the way, our new Q2 2026 Baker’s Dozen Portfolio just launched on 4/17 as a 15-month portfolio with a mid-cap bias and a diverse group of 13 stocks across 8 business sectors (InfoTech, Financials, Industrials, Healthcare, Consumer, Comm Services, Energy, and Materials). Notably, last year’s Q1 2025 Baker’s Dozen terminated on 4/20 with a gross total return of +46.7% (vs. +20.3% for SPY), and the next-to-terminate Q2 2025 portfolio is up +56% vs +42% for SPY (as of 5/15). And, as a reminder, our Earnings Quality Rank (EQR) is licensed to the actively managed, low-beta First Trust Long-Short ETF (FTLS) as a quality prescreen. It has over $2.3 billion in AUM.

Sabrient’s models and selection process seek high-quality companies with strong growth trends and expectations. Specifically, it identifies stocks that are fundamentally strong with a history of consistent, reliable, resilient, durable, and accelerating sales and earnings growth, positive revisions to Wall Street analysts’ consensus estimates, a history of meeting/beating estimates, rising profit margins and free cash flow, high capital efficiency (e.g., ROI), solid earnings quality and conservative accounting practices, a strong balance sheet, low debt burden, competitive advantage, a wide moat, and a reasonable valuation compared to its peers and its own history.

These are the factors Sabrient employs in our quantitative models and “quantamental” portfolio selection process. You can learn how to access several of our proprietary models for idea generation and portfolio monitoring through Sabrient Scorecards, as well as download Sabrient founder David Brown’s latest book (an Amazon international bestseller), by visiting this link: Moon Rocks to Power Stocks

Here is a link to this post in printable PDF format, where you also can find my latest Baker’s Dozen presentation slide deck. As always, I’d love to hear from you! Please feel free to email me your thoughts on this article or if you’d like me to speak on any of these topics at your event!  Read on….

Scott Martindale


  by Scott Martindale
  CEO, Sabrient Systems LLC

Quick note: The previous website had some issues, but I invite you now to visit https://MoonRocksToPowerStocks.com to learn more about Sabrient founder David Brown’s new book, Moon Rocks to Power Stocks, which teaches how to build wealth through data and discipline. You can immediately download the book and two bonus reports (on investing in the future of Energy and Space Exploration) in PDF format and learn how to access the Sabrient Scorecards subscription product.

Overview

War and its impact on oil, LNG, and fertilizer supplies and pricing—and by extension the impact on inflation, supply chains, bond yields and mortgage rates, dollar strength, global liquidity and global GDP—continue to top the headlines. And as if that’s not enough, we have our worsening political polarization, an utterly feckless US Congress, and complete lack of bipartisan agreement on anything, with the severe fallout of no DHS funding and long TSA lines at the airport. And lest we forget, we have rising debt and expanding deficits, sticky services inflation, and a softening labor market with falling job openings, layoffs, stalled wage growth, and new college graduates facing rising unemployment. But the buildout of physical AI infrastructure is creating real ROI, wealth creation, and productivity gains, and the companies building the AI compute stack have been delivering incredibly bullish earnings calls and forward guidance—and they are not dissuaded in the least by any of those onerous macro issues.

The doomsayers have been joined by the realists and pragmatists in believing there is no escaping $150/bbl oil and an economic recession, depending upon how much longer the oil market and energy supply chain disruption goes on—leaving only the eternal optimists to carry the bullish flag. History shows that stocks tend to recover nicely following military conflicts that are resolved relatively quickly, finding a bottom concurrently with the peak in oil prices. But production and refining capacity take to time to bring back online, and destruction of energy infrastructure among the Gulf Cooperation Council countries (GCC—Bahrain, Kuwait, Oman, Qatar, Saudi Arabia, and UAE) can take years to rebuild. If the Iranian regime tries to take it all down concurrent with their own demise, including crippling their own Kharg Island facilities—the future of their own citizens be damned—then the near-term future indeed may be challenging (or even bleak).

The war continues to consume precious resources and disrupt the global economy, as the whole world waits out with bated breath each missile launch and utterance from our president. President Trump’s goals are to defang Iran’s military and long-range missile capability, nuclear infrastructure, and terrorist network, and decapitate its radical, hateful, theocratic regime (and hopefully usher in a friendlier government) without destroying the civilian infrastructure and power grid so that the Iranian people (and the country’s future) aren’t catastrophically crippled. Indeed, rather than Trump “TACOing” again on harsh escalation (i.e., chickening out, as his critics accuse him of), I believe it is really an indication of his desire not to cripple Iran’s future as a thriving participant in the global economy. Trump doesn’t require a secular democracy there; he just wants to see a responsible, approachable government that doesn’t oppress its people, threaten all non-believers with death, aspire to a global caliphate, or zealously pursue an apocalyptic ending that ushers in the “Twelfth Imam.”

What’s left of Iran’s tyrannical regime is behaving like the Black Knight in the old comedy movie, Monty Python and the Holy Grail. Although thoroughly defeated, the regime just keeps on with its impotent saber-rattling. “It’s just a flesh wound!” the Black Knight exclaims after King Arthur chops off his arm. And after the king has chopped off all his arms and legs, the Black Knight says, “Alright, we’ll call it a draw.” Here’s the 4-minute clip. I have much more to say about the Iran War in my Final Comments section below.

Unfortunately, enough market participants are worried that maybe the Iranian regime’s bluster has a kernel of truth, or that US boots on the ground will lead to intolerable death and destruction in a bloody effort to take control of Kharg Island and ship traffic in the Strait of Hormuz. My view is that the regime is flailing like the Black Knight, and that the end is near. No money, dwindling munitions and resources. JP Morgan CEO Jamie Dimon opined that he is optimistic about the aftermath of the war given the new mentality across the region born of recent strong economic growth that has been creating incentives for stability and a desire among the GCC for a “permanent peace in the Middle East” that would open the region to foreign investment and robust growth. He said, “The Iran war gives it a better chance in the long run; [but] it’s probably riskier in the short run." BlackRock’s Larry Fink sees just two extreme potential outcomes with no middle ground: either we see growth, abundance, and $40 oil, or we see global recession and years of $150 oil. It’s worth noting that spikes in oil-to-natural gas ratio historically have receded within a few months; however, destroyed energy infrastructure could easily change this dynamic.

Since its all-time high of 7,000 on 1/28, the S&P 500 is down about 9% (as of 3/30), which means it has lost over $5 trillion in market cap, mostly due to fear-driven selling but also profit protection, capital preservation, and algo trading that is now short-biased. On Friday 3/27 alone, the MAG-7 stocks shed $330 billion in market cap. Traders have been clearing out positions ahead of each weekend due to uncertainty about war escalations. Even holding overnight is worrying for them. The Dow and Nasdaq have fallen more than 10% (i.e., correction territory). Investor trepidation has led to beat-and-raise earnings reports from dominant Tech companies being met with selling—notably Micron (MU) and its incredible quarterly report that confirmed huge demand for AI memory, as well as NVIDIA (NVDA) and its 73% YoY revenue increase that defied the “law of large numbers” for the largest market cap company in the world. Despite seeing its market cap contract for over $5 trillion to closer to $4 trillion, NVIDIA remains an incredibly profitable company with remarkable margins and ROE, and an index weighting of about 8% of the S&P 500—which is more than the weightings of 5 of the 11 GICS sectors (Consumer Staples, Energy, Utilities, Materials, and Real Estate).

The forward P/E on the S&P 500 has fallen from a high around 23x to around 20x today, which is near its 10-year average, The CBOE Volatility Index (VIX) closed last week in panic territory above 31. Bonds have offered no safe haven as auctions have seen limited demand. Nor have gold, silver, and crypto as the US dollar has firmed up and central banks, which had been accumulating gold in a big way, find they desperately need to sell non-interest-bearing assets (like gold) to raise money to either offset lost oil export revenue or to pay the surging price of oil imports. But money is flowing into hard assets, like oil, agriculture, industrial metals, and commodities broadly. Some say the dominos are stacking up much like 2008, this time driven by surging oil prices and a potential meltdown in private credit. The chart below shows the divergent performance of various asset class ETFs, including oil (USO), commodities (DBC), driven mostly by oil and gasoline prices which have seen their biggest surge in four years, agriculture (DBA), bitcoin (BTC-USD), long-term US Treasuries (TLT), and gold (GLD).
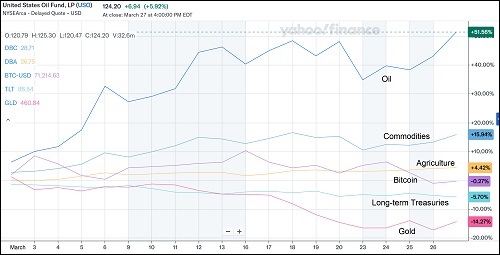
Asset class performance comparison

This market correction has served to reset lofty valuations in prominent names that many investors want to own for the long term. Keep in mind, large capital spending commitments for AI, defense, and energy projects persist and even grow, such as Meta Platforms’ (META) announcement of an increase in its investment in a state-of-the-art, 1.0 GW AI datacenter in El Paso, Texas, raising its projected capex for the project from $1.5 billion to over $10 billion, as part of a total $135 billion capital spending plan for 2026, creating 4,000 construction jobs and ultimately 300 permanent operations jobs. Moreover, it will be water-positive by employing a closed-loop cooling system, and the company will fully fund all associated infrastructure and power grid connections. This is why engineering & construction firms like Comfort Systems (FIX)—the top performer in our next-to-terminate Q1 2025 Baker’s Dozen—and Sterling Infrastructure (STRL)—a top performer in our Q2 2025 and Q3 2025 Baker’s Dozens—have held up so well despite the profit-taking in their benefactors. I talk more about these firms in my full commentary.

The One Big Beautifull Bill Act (OBBA) has fully kicked in, with its tax reform, deregulation, pro-energy policies, and broad support for the private sector to retake its rightful place as the primary engine of growth via re-privatization, reshoring, and re-industrialization, with much more efficient capital allocation and ROI than government. US corporate earnings are expected to increase by 17% YoY in full-year 2026, according to FactSet—the most since the post-pandemic recovery and a level more typical of an economy emerging from a recession—as analysts keep revising upwards even as share prices fall. However, as DataTrek pointed out, while earnings growth isn’t a concern, Big Tech reinvestment rates are a concern (i.e., capex/cash flow ratio). To be sure, analyst optimism on earnings assumes only a temporary war shock and continued tech strength. As Barclays sees it, “There is a wall of worry—but it’s worth climbing.”

Yes, the Iran hostilities have created vast uncertainties and impacts on energy and supply chains—and by extension inflation. But I still think the overall picture suggests room for another Fed rate cut (certainly not a rate hike!). I go further into all of this in my full post below, including the economy, inflation, Fed policy, and the continued promise of the Tech sector. Then I close with my Final Comments section to expand on my opinions on the Iran “excursion” and the politics around it here at home, followed by an update on Sabrient’s sector rankings, positioning of our sector rotation model, and some top-ranked ETF ideas.

Looking ahead, stock market performance should be more dependent upon earnings growth and ROI rather than multiple expansion—although with this market correction, valuations have pulled back to the 10-year average, which may leave room for some multiple expansion as well. But regardless, rather than the broad passive indexes (which are dominated by growth stocks, Big Tech, and the AI hyperscalers), I think 2026 should continue to be a good year for active stock selection, small caps, and bond-alternative dividend payers—which bodes well for Sabrient’s Baker’s Dozen, Forward Looking Value, Small Cap Growth, and Dividend portfolios, which are packaged and distributed as unit investment trusts (UITs) by First Trust Portfolios.

Witness our Baker’s Dozen portfolios, which have held up relatively well compared to the benchmark S&P 500. The Q1 2026 portfolio (launched 1/17/26) is down only -1.7% vs. -6.1% for SPY (as of 3/27/26). It is led by refiner Valero Energy (VLO) and digital storage maker Western Digital (WDC). It remains in primary market until the Q2 2026 Baker’s Dozen launches on 4/17/26. Notably, last year’s Q1 2025 Baker’s Dozen that terminates on 4/16 has more than tripled the benchmark with a gross total return of +26.3% vs. +7.8% for SPY (as of 3/27/26).

Also, small caps and high-dividend payers tend to benefit from falling interest rates and market rotation—which should resume as the war comes to a (hopefully swift) resolution. Roughly 2/3 of Russell 2000 companies topped Q4 earnings expectations, which is the best beat rate since 2021 (coming out of the pandemic). So, Sabrient’s quarterly Small Cap Growth and Dividend portfolios might be timely investments. And, as a reminder, our Earnings Quality Rank (EQR) is licensed to the actively managed, low-beta First Trust Long-Short ETF (FTLS) as a quality prescreen. Worth checking out.

I have been imploring investors in my recent posts to exploit any significant market pullback by accumulating high-quality stocks as they rebound, with earnings fueled by massive capex in AI, blockchain, energy, and onshoring of power infrastructure and factories, leading to rising productivity, increased productive capacity, and economic expansion. By “high-quality stocks,” I mean fundamentally strong, displaying a history of consistent, reliable, resilient, durable, and accelerating sales and earnings growth, positive revisions to Wall Street analysts’ consensus estimates, a history of meeting/beating estimates, rising profit margins and free cash flow, high capital efficiency (e.g., ROI), solid earnings quality and conservative accounting practices, a strong balance sheet, low debt burden, competitive advantage, a wide moat, and a reasonable valuation compared to its peers and its own history.

These are the factors Sabrient employs in our quantitative models and portfolio selection process. As former engineers, we use the scientific method and hypothesis-testing to build models that make sense. As a reminder, Sabrient founder David Brown reveals the primary financial factors used in our models and his portfolio construction process in his latest book, Moon Rocks to Power Stocks—now an Amazon international bestseller.
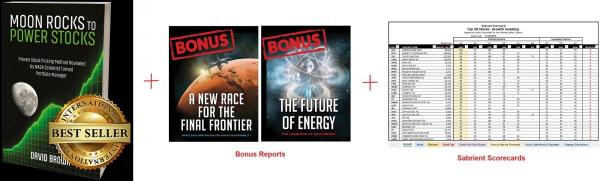
Moon Rocks to Power Stocks book, bonus reports, and Scorecards promo

Here is a link to this post in printable PDF format, where you also can find my latest Baker’s Dozen presentation slide deck. As always, I’d love to hear from you! Please feel free to email me your thoughts on this article or if you’d like me to speak on any of these topics at your event!  Read on….

Scott Martindale  by Scott Martindale
  President & CEO, Sabrient Systems LLC

Well, the election is finally upon us, and most folks on either side of the aisle seem to think that the stakes couldn’t be higher. That might be true. But for the stock market, I think removing the uncertainty will send stocks higher in a “relief rally” no matter who wins, as additional COVID stimulus, an infrastructure spending bill, and better corporate planning visibility are just a few of the slam-dunk catalysts. Either way, Modern Monetary Theory (MMT) is here, as both sides seem to agree that the only way to prevent a COVID-induced depression in a highly indebted economy is to print even more money and become even more leveraged and indebted. Now investors can only anxiously pray for a clean, uncontested election, followed soon by a reopening of schools and businesses. Stocks surely would soar.

Of course, certain industries might be favored over others depending upon the party in power, but in general I expect greater market breadth and higher prices into year-end and into the New Year. However, last week, given the absence of a COVID vaccine and additional fiscal stimulus plus the resurgence of COVID-19 in the US and Europe, not to mention worries of a contested election that ends up in the courts, stocks fell as investors took chips off the table and raised cash to ride out the volatility and prepare for the next buying opportunity. The CBOE Volatility Index (VIX) even spiked above 41 last week and closed Friday at 38, which is in panic territory (although far below the all-time high of 85.47 in March).

Nevertheless, even as the market indices fell (primarily due to profit-taking among the bigger growth names that had run so high), many of the neglected value stocks have held up pretty well. And lest you forget, global liquidity is abundant and continuing to rise (no matter who wins the election) – and searching for higher returns than ultra-low (or even negative) government and sovereign debt obligations are yielding.

All in all, this year has been a bit deceiving. While the growth-oriented, cap-weighted indexes have been in a strong bull market thanks to a handful of mega-cap Tech names, the broader market essentially has been in a downtrend since mid-2018, making it very difficult for any valuation-oriented portfolio or equal-weight index to keep up. However, since mid-July (and especially since the September lows) we have seen signs of a nascent rotation into value/cyclicals/small caps, which is a bullish sign of a healthy market. Institutional buyers are back, and they are buying the higher-quality stocks, encouraged by solid Q3 earnings reports.

Going forward, our expectation is that the historic imbalances in Value/Growth and Small/Large performance ratios will continue to gradually revert and market leadership will broaden such that strategic beta ETFs, active selection, and equal weighting will thrive once again. This should be favorable for value, quality, and growth at a reasonable price (GARP) strategies like Sabrient’s, although not to the exclusion of the unstoppable secular growth industries. In other words, investors should be positioned for both cyclical and secular growth.

Notably, Sabrient has enhanced its GARP strategy by adding our new Growth Quality Rank (GQR), which rewards companies with more consistent and reliable earnings growth, putting secular-growth stocks on more competitive footing in the rankings with cyclical growth (even though their forward valuations are often higher than our GARP model previously rewarded). As a result, our newer Baker’s Dozen portfolios launched since December 2019 reflect better balance between secular growth and cyclical/value stocks and across large/mid/small market caps. And those portfolios have shown markedly improved performance relative to the benchmark, even with this year’s continued bifurcation. Names like Adobe (ADBE), Autodesk (ADSK), Digital Turbine (APPS), Amazon (AMZN), Charter Communications (CHTR), NVIDIA (NVDA), and SolarEdge Technologies (SEDG) became eligible with the addition of GQR, and they have been top performers. But at the same time, our portfolios are also well-positioned for a broadening or rotation to value, cyclicals, and small caps. In addition, our three Small Cap Growth portfolios that have launched during 2020 using the same enhanced selection process are all nicely outperforming their benchmark. So, IMHO, this provides solid justification for an investor to take a fresh look at Sabrient’s portfolios today.

In this periodic update, I provide a comprehensive market commentary, offer my technical analysis of the S&P 500 chart, review Sabrient’s latest fundamentals-based SectorCast rankings of the ten US business sectors, and serve up some actionable ETF trading ideas. In summary, I expect stocks to move higher once the election results are finalized – but with plenty of volatility along the way until the economy is fully unleashed from its COVID shackles. In addition, our sector rankings reflect a moderately bullish bias (as the corporate outlook is starting to clear up), the technical picture looks ready for at least a modest bullish bounce from last week’s profit-taking, and our sector rotation model retains its neutral posture. As a reminder, you can go to http://bakersdozen.sabrient.com/bakers-dozen-marketing-materials to find my latest Baker’s Dozen slide deck and commentary on terminating portfolios. Read on....

Stocks are hitting new highs across the board, even though earnings reports have been somewhat disappointing. Actually, to be more precise, Q4 results have been pretty good, but it is forward guidance that has been cautious and/or cloudy as sales into overseas markets are expected to suffer due to strength in the US dollar.

Today’s market was strong with lots of volume to open the week and close the quarter.  The strongest index of the day was the Russell 2000, up 1.8%, followed by the S&P 500, up 0.8%, and the NASDAQ, up 0.7%.  NYSE volume was a strong 810 million.  The S&P 500 squeaked out a narrow 0.7% gain for the month, which is better than the NASDAQ’s 2.5% drop and the Russell 2000’s 1% drop.  The biotechnology ETF, IBB, delivered an exceptionally strong perfo

david / Tag: IBB, ALK, JAZZ, MRVL / 0 Comments

Repeating Friday’s market performance, today, the S&P 500 sold off in the last 30 to 40 minutes, giving up its entire daily gain for a loss of 0.27%.  Nevertheless, it did gain 0.1% last week for its eighth consecutive weekly gain. 

david / Tag: VIX, AMZN, EBAY, MRVL, NUS, NXPI / 0 Comments