It all rides on inflation and the Fed, but signals are looking bullish
 by Scott Martindale
President & CEO, Sabrient Systems LLC
So far this year, the Federal Reserve has been removing liquidity from the markets via rate hikes and quantitative tightening, hence the 1H22 crash. But stocks have rallied strongly since the mid-June lows on the growing belief that the Fed will make one more rate hike in September and then pause ahead of the midterm elections – and perhaps even start cutting rates in the New Year. However, many others remain adamant that the Fed is committed to keep raising rates until it is clear that inflation is under control.
I remain of the belief that the hyper-financialization of the US and global economies means that rising rates could cripple debt-addicted businesses and governments (including our own federal government!), and the housing market (which is critical for a healthy consumer) depends upon mortgage rates stabilizing soon. And as the dollar further strengthens (it just went above parity with the Euro!) given the relatively higher interest rates paid by the US, some emerging market economies with dollar-denominated debt may be forced to default. In other words, today’s financial system simply can’t handle much higher rates – which suggests the Fed may already be at or near the elusive “neutral rate” and will ultimately choose to live with elevated inflation.
Earnings season has turned out better than expected, even though profit margins have been challenged by inflationary pressures. Still, at an estimate of about 12.4% (down from a record 12.8% in Q1), profit margins remain well above the 5-year average of 10.8%, according to FactSet. After a long period of low and falling inflation, massive monetary and fiscal stimulus combined with extreme supply chain disruptions (including lockdowns in manufacturing centers, labor shortages, logistics bottlenecks, and elevated energy and labor costs) sent inflation soaring. This cut into profit margins (albeit less than many predicted), as did falling US labor force productivity, which has seen its worst drop so far this year since 1948, according to DataTrek.
But now, inflation is showing signs of retreating due to both demand destruction and mending supply chains (including lower energy, commodity, and shipping costs), as well as a strong dollar. U.S. business inventories are up such that the important inventory/sales ratio is back to near pre-pandemic levels, which is disinflationary. Moreover, productivity-enhancing technologies continue to proliferate along with other disinflationary structural trends, which I believe will reverse the troublesome recent trend in labor productivity and help to contain costs and boost profitability – leading to rising corporate earnings and real wages, which together reflect a healthy and sustainable economy and stock market. All of this is of critical importance because the direction of interest rates and stock prices largely depend upon the direction of inflation and the Fed’s reaction to it.
In addition, positive catalysts like an end to Russia’s war on Ukraine or China’s COVID lockdowns, and/or a Republican sweep in November that brings greater support for domestic oil & gas production, all would be expected to hasten improvement in supply chains and have an immediate impact on inflation. In other words, compared to prior inflationary periods in history, it seems to me that there is a lot more potential on the supply side of the equation to alleviate inflation rather relying primarily on Fed policy to depress the demand side.
So, what comes next? I suggested in my late-June post that there were numerous signs of a market capitulation, and indeed the market has roared back. The big questions are whether we have seen the lows for the year and whether we will see new highs; whether this has been simply a strong bear-market rally or the start of a new bull market. I believe the current pullback is simply a normal reaction to the extremely overbought technical conditions after such a strong (nearly monotonic) rally. It simply ran into a brick wall at the convergence of the May highs and the 200-day moving average, mostly due to buyer exhaustion. In fact, some traders have observed that the S&P 500 historically has never fallen to new lows after retracing more than 50% of its bear-market losses, as it has done. I talk more about this in my full post.
In this periodic update, I provide a comprehensive market commentary, offer my technical analysis of the S&P 500 chart, review Sabrient’s latest fundamentals based SectorCast quant rankings of the ten US business sectors, and serve up some actionable ETF trading ideas. To summarize, our SectorCast rankings reflect a bullish bias, with 5 of the top 6 scorers being cyclical sectors. In addition, the technical picture looks short-term bearish but longer term bullish, and our sector rotation model has taken on a neutral posture (at least until the S&P 500 retakes its 200-day moving average). I also offer up a political comment that you might want to ponder. Read on…
Market commentary:
Share prices depend upon earnings and interest rates. The market selloff during the first half of the year was driven by investor uncertainty about the speed and magnitude of the Fed’s interest rate policy and what impact higher rates would have on the economy and corporate earnings. As inflation has begun to recede, clarity on policy and visibility on corporate earnings has improved, and it has become more likely that stocks have entered a new secular bull market. As JP Morgan has observed, “Better-than-feared economic data are inducing equity and credit markets to price out recession risk.” Market breadth has been healthy, which supports the bull market thesis, as “a rising tide lifts all boats” (albeit some more than others). In fact, before the latest pullback, over 90% of the S&P 500 stocks were trading above their 50-day moving averages, which is a rare – and typically bullish – occurrence.
As for the CBOE Volatility Index (VIX), it had fallen back into the “complacency zone” below 20 during the rally, which suggested a pullback was likely at some point. As technicals pushed into extremely overbought territory, short interest grew. Now, as markets pull back and short sellers become further emboldened, it may be setting up for a short-covering melt-up. Also, bond yields remain volatile but should resume their retreat as income-hungry global investors – plus institutions with a strict “cash & cash equivalents” allocation mandate – seek safe yields, which would further support stock prices (on a discounted cash flow basis).
Look, I have read all the gloom & doom arguments about runaway inflation, crushing global debt, China’s economy, growing geopolitical tensions, etc., and they should not be dismissed out of hand. While some like Bridgewater’s Ray Dalio has doubled down on Big Tech during Q2, others like Scion Capital’s Michael Burry, who famously shorted the mortgage market during the Financial Crisis, thinks stocks are headed toward a similar fate today and effectively liquidated his firm’s entire portfolio (except for a small firm that leases facilities for prisons and mental health facilities!).
Furthermore, I have heard a compelling technical argument that this latest rally is simply the end (rally leg) of Phase 1 of a 3-phase bear market pattern, where each phase undertakes an A-B-C (down-up formation, with a lower high), and Phase 3 is the final capitulation (VIX over 40, blood in the streets, etc.). However, the S&P 500 has retraced more than 50% of its bear-market losses, and some traders have observed that, since World War II, stocks have never made new lows after making such a recovery. Importantly, corporate bond spreads have narrowed considerably as well, which serves to corroborate investor confidence in the robustness of corporate earnings. That’s not say we go straight up from here. It might take some successful testing of technical resistance-turned-support levels before the 2H22 rally officially begins. Let me also add that I think a change of political control of Congress in November could further goose “animal spirits.”
Inflation and interest rates:
Although the CPI hit 40-year high of 9.1% YoY in June, it seems to have topped and may be in retreat (as I have predicted in prior posts). Many commentators have been attempting to predict the future of inflation and the economy by making comparisons with prior periods of high inflation. But what makes today’s situation unique is the impact of artificial supply chain disruption (due to forced lockdowns) rather than economic forces. Thus, I believe the Fed has been trying to “buy time” to allow supply chains to mend by creating as much demand destruction as possible – without overtly crushing the economy into recession (a la Paul Volcker, over 40 years ago).
Here are several signs that inflationary pressures are receding:
- CPI began to flatten out in July after 16 straight months of increases, coming in at 8.5% YoY (after topping out at 9.1% in June).
-
Business inventories have risen sharply, which implies disinflationary pressure on finished goods, and the important inventory/sales ratio is clawing its way back to pre-pandemic levels. Also, wholesale prices and import prices both came in better than predicted. Moreover, commodity prices, shipping rates, and home prices are all stabilizing or falling.
- The Fed’s preferred inflation gauge – Personal Consumption Expenditures (PCE) Index excluding food and energy – has slowed each month since its February peak, falling from 5.3% to 4.7%.
-
PPI data showed an even bigger decline in producer prices. Economists expected producer prices to rise 0.2% in July, but instead they fell 0.5%, which was the first decline in producer prices since pre-pandemic. Historically, large moves to negative PPI readings like this have led to significantly lower inflation over the subsequent months.
-
The New York Fed’s Global Supply Chain Pressure Index (GSCPI) has been falling rapidly since the start of the year.
- The St. Louis Fed’s 5-year Breakeven Inflation Rate has fallen to 2.72%, and the 5-year/5-year Forward Inflation Expectation Rate is only 2.38% as of 8/19, which gives an indication of what the institutional market expects. Also, the University of Michigan Inflation Expectations survey of consumers, which presents the median expected price change, are at 5.0% for the next 1 year and 3.0% for the next 5 years.
- Gold prices continue to languish due to the ultra-strong dollar and expectations for rising real interest rates (nominal rate minus inflation). Historically, gold thrives when inflation rises and real interest rates fall, leading to a weaker dollar, which makes gold attractive as a store of value. But there has been no rush among investors to hold gold.
Of course, Fed monetary policy can only impact demand; its money printer has no impact on disrupted global supply chains. The Fed can only withdrawal stimulus by unwinding QE (i.e., letting bonds on its balance sheet mature and/or selling some into the market) and raising interest rates to the “neutral rate” (which neither stimulates nor restricts economic growth) – although it has a new challenge in funding Congress’s new climate change bill (the misnamed Inflation Reduction Act). Still, I believe we are close to that elusive neutral rate, given how sensitive the highly leveraged US and global economies (consumers, businesses, and governments) have become to debt carrying costs. All ears will be on the September FOMC meeting on 9/21, when the Fed may announce a final rate hike followed by language indicating that it will “wait & see” how conditions develop going forward.
Fed funds futures predict 100% probability of another rate hike at the September FOMC meeting: 44% chance for 50 bps and 56% for 75 bps. By the February 2023 meeting, fed funds futures traders are predicting a 53% likelihood that the discount rate will be no more than 125 bps higher than today (essentially two more hikes of 75 bps and 50 bps), or 3.50%.
Still, bond yields remain volatile, and the 2-10 yield curve remains inverted. The 2-year T-note is at 3.314% as of 8/22 and the 10-year is 3.028%, which is up from a recent low of 2.53% but lower than the June selloff high of 3.48%. So, it is inverted by 29 bps. I believe bonds have been simply retracing some of their gains, similar to what stocks are now doing. If yields continue to spike higher, stock prices will surely continue to fall. But I don’t foresee that scenario.
My view is that inflation and interest rates have already topped and will resume a downward trend as demand destruction continues, bonds catch a bid, disinflationary structural trends resume, and the Fed decides it must resume buying bonds to ensure financial liquidity (i.e., a sufficient global supply of US dollars) in a world hungry for dollars. (Note: 85% of all foreign exchange transactions, 60% of all foreign exchange reserves, and 50% of all cross-border loans and international debt are in US dollars.) Furthermore, with US corporate debt/GDP rising to 50%, global GDP at about $85 trillion, and total global debt estimated at more than $305 trillion, rising interest rates put a tremendous burden on both the US and global economies for debt service. This puts the Fed between a rock and hard place with its limited tools to fight inflation.
I have been predicting a sequence of events as follows: more hawkish Fed rhetoric and further tightening actions, modest demand destruction, a temporary economic slowdown or mild recession, and more stock market volatility…followed by mending supply chains, some catch-up of supply to slowing demand, moderating inflationary pressures, bonds continuing to find buyers (and yields falling), and a dovish/neutral/less-hawkish pivot from the Fed – ultimately leading to a rising stock market. But again, rather than investing in the major cap-weighted index ETFs, stocks outside of the big-name mega-caps may offer better opportunities due to lower valuations and higher growth rates.
GDP, corporate earnings:
As for Q2 real GDP, it declined at a -0.9% annual rate after falling -1.6% YoY in Q1. However, the latest strength in data regarding the labor market and manufacturing sector has the Atlanta Fed GDPNow model (as of 8/17) raising its Q3 GDP estimate to +1.6%. And as for corporate earnings, according to FactSet, the Energy sector reported the highest earnings growth of all 11 sectors at +299%. By itself, Energy reported an aggregate YoY EPS increase of $47.7 billion, while the S&P 500 overall reported only $31.1 billion. Thus, although the S&P 500 reported a YoY increase in earnings of +6.7%, if you exclude the Energy sector, it would have shown an earnings decline of -3.7%. Looking ahead, the sharp decline in oil prices this quarter will certainly have an impact on Energy sector earnings.
Nevertheless, as DataTrek recently point out, Q2 2022 nominal US GDP was 17% higher than in Q2 2019, and S&P 500 earnings are up 39% over the same 3-year timeframe, “which entirely explains why the index is 41% higher than it was in Q3 2019.” This illustrates the impressive resiliency and adaptability of these companies, and indeed, Q2 2022 was a record quarter for profits, at $56.82/share for the S&P 500.
Value vs. Growth factors:
Although the Value factor is still outperforming Growth over the past 12 months and YTD, Growth has been dominant over the past 3 months, as shown in the chart below, led by small caps and InfoTech. It compares S&P 500 Value (SPYV), S&P 500 Growth (SPYG), S&P 600 Small Cap Value (SLYV), and S&P 600 Small Cap Growth (SLYG). Note that the forward P/E for SPYG is 23.6x and SPYV 14.9x, as of 8/19, while small cap SLYG is 13.5x and SLYV is 12.8x – which illustrates the huge premium commanded by large caps, and especially large cap Growth.
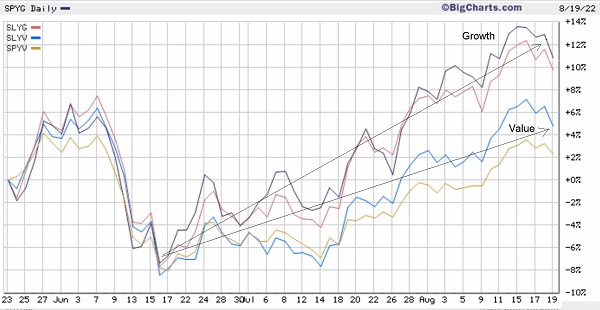
Some commentators believe that Value should enjoy some mean reversion performance going into Q4, in which case Healthcare, Financials, and Industrials would be desirable given their higher sector weights in the Value indexes. But in my view, if interest rates stay low and the narrative that the fed funds rate is near the neutral rate, and the Fed is unlikely to tighten much more, long duration Growth sectors (especially InfoTech) may still have the fuel to outperform.
Either way, assuming we can avoid a deep recession, Energy also seems like a good bet (as reflected in Sabrient’s SectorCast rankings, discussed later), with the Energy Select SPDR ETF (XLE) displaying a forward P/E of only 8.2x as of 8/19 (compared to SPY at 18.3x). In addition, it is worth noting that many of the most prominent investors are heavily invested in real assets, e.g., oil, commodities, natural resources, real estate, farmland, precious metals, agriculture, and utilities – whether as a primary investment thesis or as a hedge on a more Tech-oriented growth portfolio.
Summing up:
We continue to suggest staying net long but hedged, with a heightened emphasis on quality and a balance among value/cyclicals, high-quality secular growers, and dividend payers. Moreover, rather than investing in the major cap-weighted index ETFs, stocks outside of the mega-caps may offer better opportunities due to lower valuations and higher growth rates. Regardless, Sabrient’s Baker’s Dozen, Dividend, and Small Cap Growth portfolios leverage our enhanced model-driven selection approach (which combines Quality, Value, and Growth factors) to provide exposure to both the longer-term secular growth trends and the shorter-term cyclical growth and value-based opportunities. In particular, our Dividend Portfolio – which seeks quality companies selling at a reasonable price with a solid growth forecast, a history of raising dividends, a good coverage ratio, and an aggregate dividend yield approaching 4%+ to target both capital appreciation and steady income – has been performing quite well.
All told, I continue to believe that the Fed will not raise as much as previously feared, and in fact may instead decide to ease later this year or early next, which would be bullish for stocks (especially growth stocks). And, as I have discussed in this post, it appears other market participants have come around to similar thinking. Nevertheless, you can’t ignore credible investors like Michael Burry who are expecting a major stock market crash, so hedges (e.g., protective puts, leveraged inverse ETFs, and real assets) are appropriate. In addition, China remains a wildcard with its ongoing COVID lockdowns and a brewing meltdown in its real estate-based domestic economy, not to mention its saber-rattling about Taiwan. [I have written several times in the past (e.g., here) about China being a veritable house-of-cards with its debt-driven, GDP-targeting approach, and the commonality among Chinese investors to store money like a savings account in questionable real estate developments.] Regardless, I still believe the path of least resistance for stocks is higher.
Some final thoughts:
Throughout history, political leaders are elected based on promises made to the electorate. Pass new laws, enact regulations, protect this group, punish that group, incentivize this, disincentivize that, and sometimes “play God.” It happens in all political systems, whether authoritarian or “free.” Moreover, we expect our elected leaders to “do something” whenever there is the slightest whiff of challenge or hardship on the horizon. Heaven forbid the US electorate must deal with some adversity … much less make their own decisions on protecting themselves and their families.
Instead, government jumps into action, whether it be Fed rate cuts or liquidity injections, or congressional spending programs that pick winners and losers among industries and companies. Or they fearmonger and declare a national emergency as a pretense to suspend the Bill of Rights or state voting laws, and seize autocratic control across local, state, and national levels – including restrictions on the 1st amendment (freedom of speech and the press … “misinformation!”), 2nd amendment (gun rights … “white supremacists!”), 4th amendment (unreasonable search and seizure), 5th amendment (due process), 6th amendment (speedy public trial … “insurrection!”), and the 10th amendment (federal government only has powers specifically delegated by the Constitution) – to make draconian, fail-safe (“One life lost is too many!”), ill-advised decisions, like lockdowns, mask mandates, police defunding/standdowns, zero-cash bail, open borders/”catch & release,” and so on.
However well-intentioned they may have been, such policies have proven to cause far more damage than they prevent to both the individual and society as a whole. As Ronald Reagan famously said, “The most terrifying words in the English language are: I'm from the government and I'm here to help.”
One can hope that the proverbial pendulum has swung too far to the left and is already beginning to make its way back to a saner middle ground. As Ronald Reagan also said, “Freedom is never more than one generation away from extinction.”
Now that it is time to pay the piper – such as by raising interest rates, withdrawing liquidity, suffering through a mild recession, or dealing with the crime, homelessness, and mental health fallout – along comes Congress with a pre-midterm-election boondoggle, despite an existing Federal debt of $30 trillion (almost 8x annual tax revenues of $4 trillion) and much more in unfunded liabilities. The new spending bill is simply a watered-down version of last year’s failed Build Back Better Act, but misleadingly relabeled as the Inflation Reduction Act. That’s because inflation is an immediate priority for most Americans, whereas climate change is much less so (unless you recently have been flooded out of your home).
The long-term goal of course is to change the trajectory of an evolving and more severe climate – quite a tall task for a global community that is highly diverse, nationalistic, antagonistic, and largely uncooperative (even within their own borders much less beyond them). But also, there is no nation (including the US) so “fat & happy” that it would be willing to dramatically cut back its existing standard of living in pursuit of amorphous objectives. Humans are much better at adapting than making immediate and extraordinary changes to their lives and habits.
As market maven Alexander Green has opined, “The greatest threat … is not a tightening Fed, higher valuations or moderating corporate profits. It's the growing clamor for regulatory and redistributive policies that will reduce innovation, lessen productivity, and undermine the economy.” Nevertheless, I still believe we may be on the cusp of a new expansionary economic cycle (and a “Roaring ‘20s redux” from 100 years ago) – so long as our political leaders don’t screw it up.
SPY Chart Review:
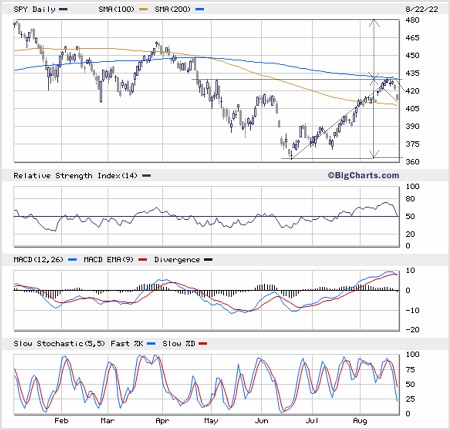
The SPDR S&P 500 Trust (SPY) closed Monday just above 413 after falling a little over 2% intraday. After falling nearly 25% from its January all-time high near 480 to its June low of 362, the strong rally to its August 16 intraday peak near 432 constituted a 60% retracement from the June low. However, the convergence of the 200-day simple moving average (SMA) with the early-May high proved to be strong resistance, and so we are getting a solid pullback. The near-monotonic rally created extremely overbought technical conditions, which needed at least a lengthy consolidation if not a significant correction – and we appear to be getting the latter. I think the pullback could extend all the way down to 400, which marks convergence of the 50-day SMA with a previous mid-July high. Slow Stochastics has rolled over and has further to fall, RSI is about the cross the neutral line, and MACD appears to be just starting a bearish crossover. If the pullback remains shallow, it may form a bull flag pattern as shown. Regardless, I don’t believe this market is destined for a catastrophic selloff. As I said earlier, no previous retracement of over 50% from bear-market lows has ever led to a subsequent return to new lows.
Latest Sector Rankings:
Relative sector rankings are based on our proprietary SectorCast model, which builds a composite profile of each of over 900 equity ETFs based on bottom-up aggregate scoring of the constituent stocks. The Outlook Score employs a forward-looking, fundamentals-based multifactor algorithm considering forward valuation, historical and projected earnings growth, the dynamics of Wall Street analysts’ consensus earnings estimates and recent revisions (up or down), quality and sustainability of reported earnings, and various return ratios. It helps us predict relative performance over the next 2-6 months.
In addition, SectorCast computes a Bull Score and Bear Score for each ETF based on recent price behavior of the constituent stocks on particularly strong and weak market days. A high Bull score indicates that stocks within the ETF recently have tended toward relative outperformance when the market is strong, while a high Bear score indicates that stocks within the ETF have tended to hold up relatively well (i.e., safe havens) when the market is weak.
Outlook score is forward-looking while Bull and Bear are backward-looking. As a group, these three scores can be helpful for positioning a portfolio for a given set of anticipated market conditions. Of course, each ETF holds a unique portfolio of stocks and position weights, so the sectors represented will score differently depending upon which set of ETFs is used. We use the iShares that represent the ten major U.S. business sectors: Financials (IYF), Technology (IYW), Industrials (IYJ), Healthcare (IYH), Consumer Staples (IYK), Consumer Discretionary (IYC), Energy (IYE), Basic Materials (IYM), Telecommunications (IYZ), and Utilities (IDU). Whereas the Select Sector SPDRs only contain stocks from the S&P 500 large cap index, I prefer the iShares for their larger universe and broader diversity.
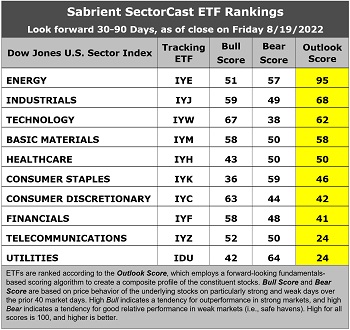
Here are some of my observations on this week’s scores:
1. The rankings are led by deep cyclicals Energy and Industrials, with Outlook scores of 95 and 68, respectively. You would expect strength in cyclical sectors given their high earnings leverage within a growing economy. Energy in particular scores extraordinarily well in the model. It enjoys by far the strongest analyst sentiment (recent positive net revisions to EPS estimates), the lowest forward P/E of 8.1x, good YoY projected EPS growth rate of 14.9%, the lowest forward PEG (forward P/E divided by projected EPS growth rate) of 0.55, and the strongest insider sentiment (open market buying). Industrials comes in a distant second, with reasonable scores across the board, including a solid YoY projected EPS growth of 13.4% and a forward PEG of 1.42. Rounding out the top five are Technology, Basic Materials, and Healthcare.
2. At the bottom are Utilities and Telecom with Outlook scores of 24. Both are considered defensive sectors, with their stable business models and dividend yields. Utilities has a low (but stable) growth rate of only 7.3%, but it has been bid up to the highest forward P/E of 23.1x by income-seeking investors for its 2.12% dividend yield, which makes it popular as a bond alternative, but its forward PEG is the highest at 3.17.
3. Looking at the Bull scores, Technology has the top score of 67, followed by Consumer Discretionary at 63, as stocks within these sectors have displayed relative strength on strong market days. Consumer Staples scores the lowest at 36. The top-bottom spread is quite wide at 31 points, which reflects low sector correlations on strong market days. It is desirable in a healthy market to see low correlations reflected in a top-bottom spread of at least 20 points, which indicates that investors have clear preferences in the market segments and stocks they want to hold.
4. Looking at the Bear scores, Utilities scores the highest at 64, followed by Consumer Staples at 59, as stocks within these defensive/dividend-paying sectors have been the preferred safe havens on weak market days. Technology displays the lowest score of 38, as investors have fled the sector during market weakness. The top-bottom spread is 26 points, which reflects low sector correlations on weak market days. Ideally, certain sectors will hold up relatively well while others are selling off (rather than broad risk-off behavior), so it is desirable in a healthy market to see low correlations reflected in a top-bottom spread of at least 20 points.
5. Energy displays by far the best all-around combination of Outlook/Bull/Bear scores, while Telecom is the worst. Looking at just the Bull/Bear combination (investor sentiment indicator), Energy, Industrials, and Basic Materials share the top score, indicating superior and consistent relative performance (on average) in extreme market conditions whether bullish or bearish, while Healthcare is the worst.
6. This week’s fundamentals-based Outlook rankings continue to display a bullish bias given that the top 4 sectors are all economically sensitive or cyclical, while two of the most defensive sectors are relegated to the bottom. Keep in mind, the Outlook Rank does not include timing, momentum, or relative strength factors, but rather reflects the consensus fundamental expectations at a given point in time for individual stocks, aggregated by sector.
ETF Trading Ideas:
Our Sector Rotation model, which appropriately weights Outlook, Bull, and Bear scores in accordance with the overall market’s prevailing trend (bullish, neutral, or defensive), is in a neutral posture. This suggests holding Energy (IYE), Industrials (IYJ), and Technology (IYW), in that order. (Note: In this model, we consider the bias to be neutral from a rules-based trend-following standpoint when SPY is between its 50-day and 200-day simple moving averages.)
If you prefer a defensive bias, the Sector Rotation model suggests holding Energy, Utilities (IDU), and Consumer Staples (IYK), in that order. Or, if you are more aggressively pursuing a bullish stance, the model similarly suggests holding Technology, Industrials, and Consumer Discretionary, in that order.
An assortment of other interesting ETFs that are scoring well in our latest rankings include: First Trust Natural Gas (FCG), First Trust Indxx Global Natural Resources Income (FTRI), Vanguard Energy (VDE), First Trust Energy AlphaDEX (FXN), Innovator IBD 50 (FFTY), iShares US Oil & Gas Exploration & Production (IEO), WBI BullBear Value 3000 (WBIF), WisdomTree US Growth & Momentum (WGRO), iShares US Home Construction (ITB), VanEck Vectors Steel (SLX), Alpha Architect US Quantitative Momentum (QMOM), First Trust Active Factor Small Cap (AFSM), QRAFT AI-Enhanced US Large Cap Momentum (AMOM), WBI BullBear Quality 3000 (WBIL), Avantis US Small Cap Value (AVUV), AdvisorShares Alpha DNA Equity Sentiment (SENT), ProShares Nanotechnology (TINY), and Donoghue Forlines Yield Enhanced Real Asset (DFRA). All score in the top decile (90-100) of Outlook scores.
As always, I welcome your thoughts on this article! Please email me anytime. Any and all feedback is appreciated! In particular, please tell me what sections you find the most valuable – commentary, chart analysis, SectorCast scores, or ETF trading ideas / sector rotation model.
IMPORTANT NOTE: I post this information periodically as a free look inside some of our institutional research and as a source of some trading ideas for your own further investigation. It is not intended to be traded directly as a rules-based strategy in a real money portfolio. I am simply showing what a sector rotation model might suggest if a given portfolio was due for a rebalance, and I do not update the information on a regular schedule or on technical triggers. There are many ways for a client to trade such a strategy, including monthly or quarterly rebalancing, perhaps with interim adjustments to the bullish/neutral/defensive bias when warranted, but not necessarily on the days that I happen to post this article. The enhanced strategy seeks higher returns by employing individual stocks (or stock options) that are also highly ranked, but this introduces greater risks and volatility. I do not track performance of the ideas mentioned here as a managed portfolio.
Disclosure: At the time of this writing, the author held no positions in any of the securities mentioned.
Disclaimer: Opinions expressed are the author’s alone and do not necessarily reflect the views of Sabrient. This newsletter is published solely for informational purposes and is not to be construed as advice or a recommendation to specific individuals. Individuals should take into account their personal financial circumstances in acting on any opinions, commentary, rankings, or stock selections provided by Sabrient Systems or its wholly owned subsidiary, Gradient Analytics. Sabrient makes no representations that the techniques used in its rankings or analysis will result in or guarantee profits in trading. Trading involves risk, including possible loss of principal and other losses, and past performance is no indication of future results.